| Issue |
A&A
Volume 500, Number 2, June III 2009
|
|
|---|---|---|
| Page(s) | 807 - 815 | |
| Section | Interstellar and circumstellar matter | |
| DOI | https://doi.org/10.1051/0004-6361/200809849 | |
| Published online | 01 April 2009 | |
Spitzer observations of the N157B supernova remnant and its surroundings
E. R. Micelotta - B. R. Brandl - F. P. Israel
Sterrewacht Leiden, Leiden University, PO Box 9513, 2300 RA
Leiden, The Netherlands
Received 26 March 2008 / Accepted 16 February 2009
Abstract
Aims. We study the LMC interstellar medium in the field of the nebula N157B, which contains a supernova remnant, an OB association, ionized gas, and high-density dusty filaments in close proximity. We investigate the relative importance of shock excitation by the SNR and photo-ionization by the OB stars, as well as possible interactions between the supernova remnant and its environment.
Methods. We apply multiwavelength mapping and photometry, along with spatially resolved infrared spectroscopy, to identifying the nature of the ISM using new infrared data from the Spitzer space observatory and X-ray, optical, and radio data from the literature.
Results. The N157B SNR has no infrared counterpart. Infrared emission from the region is dominated by the compact blister-type HII region associated with 2MASS J05375027-6911071 and excited by an O8-O9 star. This object is part of an extended infrared emission region that is associated with a molecular cloud. We find only weak emission from the shock-indicator [FeII], and both the excitation and the heating of the extended cloud are dominated by photo-ionization by the early O stars of LH 99.
Conclusions. Any possible impact by the expanding SNR does not now affect the extended cloud of molecules and dust, despite the apparent overlap of SNR X-ray emission with infrared and H![]() emission from the cloud. This implies that the supernova progenitor cannot have been more massive than about 25
emission from the cloud. This implies that the supernova progenitor cannot have been more massive than about 25 ![]() .
.
Key words: ISM: supernova remnants - ISM: individual objects: N157B - galaxies: individual: LMC - H II regions - dust, extinction
1 Introduction
The H![]() -emitting region N157 B (Henize 1956) in the Large
Magellanic Cloud is on the southwestern fringe (projected linear
distance 90 pc from the center) of the major star-forming complex
30 Doradus. In a limited area of (projected) diameter 65 pc, the field
contains a supernova remnant, an OB association, HII emission regions,
bubbles of low-density hot gas, as well as the neutral material in
dense clouds (Lazendic et al. 2000, and references therein). The structure,
dynamics, and energy balance of this region are poorly understood.
There is even uncertainty about the nature of the emission observed at
different wavelengths.
-emitting region N157 B (Henize 1956) in the Large
Magellanic Cloud is on the southwestern fringe (projected linear
distance 90 pc from the center) of the major star-forming complex
30 Doradus. In a limited area of (projected) diameter 65 pc, the field
contains a supernova remnant, an OB association, HII emission regions,
bubbles of low-density hot gas, as well as the neutral material in
dense clouds (Lazendic et al. 2000, and references therein). The structure,
dynamics, and energy balance of this region are poorly understood.
There is even uncertainty about the nature of the emission observed at
different wavelengths.
The OB association LH 99 (Lucke & Hodge 1970) is seen on the sky in the same direction as N157B, and is often considered to be associated with it because it has the same foreground extinction (Wang & Gotthelf 1998). LH 99 contains a large number of (early) O stars (Schild & Testor 1992), powerful ionizing sources whose strong stellar winds are expected to produce bubbles of low-density hot gas (Townsley et al. 2006) and to illuminate the dusty filaments and clouds such as the nearby molecular cloud 30Dor-22 (Johansson et al. 1998).
Much of the nebula N157 B can be identified with the Crab-like
supernova remnant (SNR) B0538-691. Its embedded X-ray pulsar
PSR J0537-6910 suggests an age of about 5000 yr (Marshall et al. 1998; Wang & Gotthelf 1998).
The N157B radio counterpart MC 69 (Le Marne 1968; McGee et al. 1972) has a
spectral index
![]() ,
,
![]() (Mills et al. 1978; Lazendic et al. 2000). Such a flat spectrum is characteristic
of thermal HII region emission, as well as of nonthermal Crab-type SNR
emission. However, various observations strongly support the latter
interpretation: bright X-ray emission coincides with the radio source
(Long & Helfand 1979), the ratio of radio-to-optical intensity is quite high
(Dickel et al. 1994), spectral line images (Danziger et al. 1981) reveal filamentary
structures with a high line ratio [SII]/H
(Mills et al. 1978; Lazendic et al. 2000). Such a flat spectrum is characteristic
of thermal HII region emission, as well as of nonthermal Crab-type SNR
emission. However, various observations strongly support the latter
interpretation: bright X-ray emission coincides with the radio source
(Long & Helfand 1979), the ratio of radio-to-optical intensity is quite high
(Dickel et al. 1994), spectral line images (Danziger et al. 1981) reveal filamentary
structures with a high line ratio [SII]/H
![]() ,
the lines
of [OI], [FeII], and [FeIII] are strong, whereas the HeI
,
the lines
of [OI], [FeII], and [FeIII] are strong, whereas the HeI ![]() 4686
Å line is weak. The SNR has a peculiar one-sided morphology, does
not have a well-determined outer boundary, and exhibits bright
radio/X-ray core surrounded by an extended envelope of linear size of
4686
Å line is weak. The SNR has a peculiar one-sided morphology, does
not have a well-determined outer boundary, and exhibits bright
radio/X-ray core surrounded by an extended envelope of linear size of
![]() pc (Lazendic et al. 2000; Chu et al. 1992; Dickel et al. 1994), or even larger
(Townsley et al. 2006) making the remnant unusually large in both radio and
X-ray emission (Wang & Gotthelf 1998; Lazendic et al. 2000).
pc (Lazendic et al. 2000; Chu et al. 1992; Dickel et al. 1994), or even larger
(Townsley et al. 2006) making the remnant unusually large in both radio and
X-ray emission (Wang & Gotthelf 1998; Lazendic et al. 2000).
In such a complex environment, shocks from SNRs and photons from luminous stars compete as heating agents for the ISM. The conditions in and around N157B have therefore been a frequent subject of study. Several authors, e.g. Chu et al. (1992), Townsley et al. (2006), Chen et al. (2006) have concluded that the expanding SNR is presently colliding with the molecular cloud to its south. The impact of a shock front on dense cloud material should leave a signature detectable at mid-infrared (MIR) wavelengths (Reach & Rho 2000; Oliva et al. 1999). Confirmation of the proposed collision is of great interest, as it would identify an excellent source for studying the physics of ongoing dense ISM processing by shocks.
The use of infrared observations is particularly well-suited to trace
physical conditions in dusty environments because of their
insensitivity to extinction. In the following, we combine our
Spitzer observations with literature data at a variety of
wavelengths to study the role of the different physical components
(SNR, HII region, OB association, dust clouds) and heating processes
(shock-excitation, photo-ionization) in shaping the N157B region.
Throughout, we adopt a distance of 50 kpc for the LMC (Westerlund 1997),
so that 10
![]() correspond to 2.4 pc.
correspond to 2.4 pc.
2 Observations and data processing
![\begin{figure}
\par\mbox{\subfigure[]{
\includegraphics[width=8cm]{9849fg1a.eps...
...s} }
\subfigure[]{
\includegraphics[width=8cm]{9849fg1f.eps} }}
\end{figure}](/articles/aa/full_html/2009/23/aa09849-08/img13.png) |
Figure 1: IRAC and MIPS images of the N157B region, calibrated in MJy/sr. The diamond marks the peak of the supernova remnant X-ray emission (Sasaki et al. 2000) and the circle marks the 2MASS compact source J05375027-6911071. The coordinates are (RA, Dec) J2000. |
| Open with DEXTER | |
We have observed N157B with the Infrared Array Camera (IRAC)
(Fazio et al. 2004) and with the Infrared Spectrograph (IRS)
(Houck et al. 2004) on board the Spitzer Space Telescope (Werner et al. 2004),
as part of the IRS guaranteed-time program (PID 63, PI J. R. Houck).
The images from the Multiband Imaging Photometer for Spitzer (MIPS)
have been retrieved from the archive (MIPS 24 ![]() m: program 3680, PI
K.J. Borkowski, MIPS 70
m: program 3680, PI
K.J. Borkowski, MIPS 70 ![]() m: program 20203, PI M. Meixner).
m: program 20203, PI M. Meixner).
The IRAC data (Fig. 1) were taken on 7 December 2003
and consist of mosaic images in
four channels at 3.6, 4.5, 5.8 and 8.0 ![]() m. The Basic Calibrated
Data (BCD) products from the Spitzer Science Center (SSC) pipeline
were used to construct the mosaic images.
m. The Basic Calibrated
Data (BCD) products from the Spitzer Science Center (SSC) pipeline
were used to construct the mosaic images.
The IRS spectra were taken on 26 May 2005 using the standard IRS ``Staring Mode'' Astronomical Observing Template (AOT). The observational setup is reported in Table 1. The IRS slit coverage is shown in Fig. 2 - left panel, outlined with rectangles: SL goes from East to West, LL2 from North to South and SH and LH are the two small rectangles in the center of the field.
Each cycle yielded two exposures at different nod positions along the
slit. The data have been pre-processed by the SSC data reduction
pipeline version 12.0.2 (Spitzer Observer's Manual, chapter
7![]() ). The
two-dimensional BCD constituted the basis for further processing.
First we corrected the BCD frames for bad and rogue pixels with the
IRSCLEAN
). The
two-dimensional BCD constituted the basis for further processing.
First we corrected the BCD frames for bad and rogue pixels with the
IRSCLEAN![]() tool. IRSCLEAN identifies bad and rogue pixels and replaces them with
the average of good nearest neighbors. Rogue pixels are
single-detector pixels that show time-variable and abnormally high
flux values. Next, we combined the frames from the same nod position
using the mean where two frames were available, and using the median
in case of three available frames. For each integration at the same
position on the target, an off-source sky exposure is provided, so we
computed the mean/median sky (depending again on the number of
available frames) and subtracted it from the corresponding nod
position frame.
tool. IRSCLEAN identifies bad and rogue pixels and replaces them with
the average of good nearest neighbors. Rogue pixels are
single-detector pixels that show time-variable and abnormally high
flux values. Next, we combined the frames from the same nod position
using the mean where two frames were available, and using the median
in case of three available frames. For each integration at the same
position on the target, an off-source sky exposure is provided, so we
computed the mean/median sky (depending again on the number of
available frames) and subtracted it from the corresponding nod
position frame.
Further processing was done using the SMART package version 5.5 (Higdon et al. 2004) - a suite of IDL software tools developed for spectral extraction and spectral analysis of IRS data. The high-resolution spectra were extracted using full slit extraction. The low-resolution spectra were instead extracted using SMART's interactive column extraction. The calibration is based on observations of standard stars (Decin et al. 2004). The ends of each orders, where the noise increases significantly, were manually clipped. To obtain a good match between the low and high resolution modules, the SL + LL2 spectra were scaled up by 10%. Finally the resulting spectra from the two nod positions were averaged to obtain the final spectrum shown in Fig. 4.
3 Results and analysis
3.1 IRAC and MIPS images
The IRAC and MIPS images (Fig. 1) of the N157B
region are dominated by emission from the dust associated with the
molecular cloud south of the X-ray emission region (peak marked by a
diamond). Relatively faint in the 3.6 ![]() m and 4.5
m and 4.5 ![]() m images, the
irregularly shaped diffuse emission is quite bright at 5.8
m images, the
irregularly shaped diffuse emission is quite bright at 5.8 ![]() m,
8.0
m,
8.0 ![]() m, and 24
m, and 24 ![]() m where it appears more extended with a
quasi-circular shape. In the 70
m where it appears more extended with a
quasi-circular shape. In the 70 ![]() m image, it no longer stands out
clearly as it suffers from confusion with the very extended
low-surface brightness emission characteristic of the whole 30 Doradus
region. The cloud is listed as object No. 1448 in the IRAS catalogue
of LMC sources by Schwering (1989) and shows up in the relatively
low-resolution IRAS maps as an extension of the main 30 Doradus IR
source. Figures 2 (left) and 3
show that the contour of the 8
m image, it no longer stands out
clearly as it suffers from confusion with the very extended
low-surface brightness emission characteristic of the whole 30 Doradus
region. The cloud is listed as object No. 1448 in the IRAS catalogue
of LMC sources by Schwering (1989) and shows up in the relatively
low-resolution IRAS maps as an extension of the main 30 Doradus IR
source. Figures 2 (left) and 3
show that the contour of the 8 ![]() m emission (sensitive to PAHs)
from the cloud follows reasonably well
the outline of extinction in the H
m emission (sensitive to PAHs)
from the cloud follows reasonably well
the outline of extinction in the H![]() image (Fig. 2 - right).
Much of the infrared-emitting dust must therefore be either in front of the
ionized gas, or embedded within it. From the MIPS 24
image (Fig. 2 - right).
Much of the infrared-emitting dust must therefore be either in front of the
ionized gas, or embedded within it. From the MIPS 24 ![]() m, the size of the cloud is roughly 2' (28.8 pc). Its dimensions
are thus similar to those of the SNR but the two are offset from one another,
as shown by the superposition of the X-ray and 8
m, the size of the cloud is roughly 2' (28.8 pc). Its dimensions
are thus similar to those of the SNR but the two are offset from one another,
as shown by the superposition of the X-ray and 8 ![]() m maps
in Fig. 2, left-hand panel.
Although there is considerable overlap between the X-ray and
H
m maps
in Fig. 2, left-hand panel.
Although there is considerable overlap between the X-ray and
H![]() emission regions (Fig. 2, right-hand panel),
there is no trace of an IR counterpart to the X-ray SNR emission: the
two occur almost side-by-side.
emission regions (Fig. 2, right-hand panel),
there is no trace of an IR counterpart to the X-ray SNR emission: the
two occur almost side-by-side.
The bright and compact object at RA (J2000)
![]() ,
Dec (J2000)
,
Dec (J2000)
![]() 11
11![]() 07.1
07.1
![]() is located within the confines of the
infrared cloud. In the IRAC images, it has a diameter of
is located within the confines of the
infrared cloud. In the IRAC images, it has a diameter of ![]() 3 pc
and it is the brightest source in the field in all IRAC bands.
Centimeter-wavelength radio maps by Dickel et al. (1994) and Lazendic et al. (2000)
reveal weak radio emission at its position. Although there is ISO SWS
and LWS spectroscopy of the extended cloud just described
(Vermeij & van der Hulst 2002), the ISO apertures did not include this bright
object. We have chosen this object, which is identical to the 2MASS
near-IR source J05375027-6911071, as the reference position for the
IRS slits (Fig. 2 - left panel).
3 pc
and it is the brightest source in the field in all IRAC bands.
Centimeter-wavelength radio maps by Dickel et al. (1994) and Lazendic et al. (2000)
reveal weak radio emission at its position. Although there is ISO SWS
and LWS spectroscopy of the extended cloud just described
(Vermeij & van der Hulst 2002), the ISO apertures did not include this bright
object. We have chosen this object, which is identical to the 2MASS
near-IR source J05375027-6911071, as the reference position for the
IRS slits (Fig. 2 - left panel).
We have collected infrared flux densities for both the compact object
and the whole dust cloud shown in Fig. 1 by
integrating the emission over circles with radii
![]() and
and
![]() centered on RA(
centered on RA(
![]() ), Dec(
), Dec(
![]() 11
11![]() 07
07
![]() )
and
RA(
)
and
RA(
![]() ), Dec(
), Dec(
![]() 10
10![]() 47
47
![]() ), respectively. The
results are listed in Table 2, which for convenience also
yields the relevant flux densities taken from the 2MASS on-line data
archive, and the IRAS database published by Schwering (1989). Although
all flux-densities in Table 2 have very small formal
errors, a major uncertainty (easily a factor of two) arises in the
separation of the source from its surroundings. As noted by
Schwering, this is clearly true for the IRAS flux densities, which are
very hard to separate from the overwhelming emission of the 30 Doradus
complex, but a glance at Fig. 1 shows that this
problem is not limited to the IRAS data, but also extends to the
Spitzer mapping of this complex region.
), respectively. The
results are listed in Table 2, which for convenience also
yields the relevant flux densities taken from the 2MASS on-line data
archive, and the IRAS database published by Schwering (1989). Although
all flux-densities in Table 2 have very small formal
errors, a major uncertainty (easily a factor of two) arises in the
separation of the source from its surroundings. As noted by
Schwering, this is clearly true for the IRAS flux densities, which are
very hard to separate from the overwhelming emission of the 30 Doradus
complex, but a glance at Fig. 1 shows that this
problem is not limited to the IRAS data, but also extends to the
Spitzer mapping of this complex region.
3.2 IRS spectroscopy of J05375027-6911071
Table 1: IRS observational setup. The IRS modules are SL: Short-Low, LL2: Long-Low 2, SH: Short-High, LH: Long-High.
The combined high- and low-resolution spectrum of the 2MASS source
J05375027-6911071 covers the wavelength range from 5 ![]() m to 38
m to 38 ![]() m,
and is shown in Fig. 4. The (short-wavelength)
low-resolution part has been extracted from the single slit
segment centered on 2MASS-J05375027-6911071 (see below), while the
high resolution part results from integration over the full length
covered by the SH and LH slits (see Fig. 2 - left-hand
panel). This area includes J05375027-6911071 but also some of its
fainter surroundings. As a result, the spectrum in
Fig. 4 accurately reflects the emission from
J05375027-6911071 shortwards of
m,
and is shown in Fig. 4. The (short-wavelength)
low-resolution part has been extracted from the single slit
segment centered on 2MASS-J05375027-6911071 (see below), while the
high resolution part results from integration over the full length
covered by the SH and LH slits (see Fig. 2 - left-hand
panel). This area includes J05375027-6911071 but also some of its
fainter surroundings. As a result, the spectrum in
Fig. 4 accurately reflects the emission from
J05375027-6911071 shortwards of ![]() 20
20 ![]() m. However, at
wavelengths beyond 20
m. However, at
wavelengths beyond 20 ![]() m the spectrum includes a non-negligible
contribution from the surrounding diffuse emission.
m the spectrum includes a non-negligible
contribution from the surrounding diffuse emission.
Different ISM processes have left their mark on the spectrum: emission
from PAHs, absorption by silicates around 10 ![]() m and in a broad band
between 15
m and in a broad band
between 15 ![]() m and 22
m and 22 ![]() m, various fine-structure emission lines
and steeply increasing continuum emission from hot dust. The dust PAH
features have been modelled with the program
PAHFIT
m, various fine-structure emission lines
and steeply increasing continuum emission from hot dust. The dust PAH
features have been modelled with the program
PAHFIT![]() (Smith et al. 2007) and
the results are presented in Table 4. PAHFIT is an
IDL tool for decomposing Spitzer IRS spectra, with special attention
to PAH emission features, and it is primarily designed for use with
Spitzer low-resolution IRS spectra. The program is based on a model
consisting of starlight, thermal dust continuum with temperature from
35 to 300 K, resolved dust features and feature blends, prominent
emission lines and dust extinction dominated by the silicate
absorption bands at 9.7
(Smith et al. 2007) and
the results are presented in Table 4. PAHFIT is an
IDL tool for decomposing Spitzer IRS spectra, with special attention
to PAH emission features, and it is primarily designed for use with
Spitzer low-resolution IRS spectra. The program is based on a model
consisting of starlight, thermal dust continuum with temperature from
35 to 300 K, resolved dust features and feature blends, prominent
emission lines and dust extinction dominated by the silicate
absorption bands at 9.7 ![]() m and 15-22
m and 15-22 ![]() m. PAHFIT uses Gaussian
profiles to recover the full strength of emission lines and Drude
profiles for dust emission features and blends. The fine-structure
lines have been measured by single Gaussian fits within SMART, and the
results are listed in Table 3. All these lines, except
the iron lines, are typically associated with ionized gas in
photon-dominated regions (PDRs - e.g. Tielens 2005; Martín-Hernández et al. 2002).
m. PAHFIT uses Gaussian
profiles to recover the full strength of emission lines and Drude
profiles for dust emission features and blends. The fine-structure
lines have been measured by single Gaussian fits within SMART, and the
results are listed in Table 3. All these lines, except
the iron lines, are typically associated with ionized gas in
photon-dominated regions (PDRs - e.g. Tielens 2005; Martín-Hernández et al. 2002).
3.3 IRS spectroscopy of the extended dust cloud
As shown in Fig. 2, the SH and LH slits cover only a very limited part of the cloud, mainly the compact 2MASS object. The two much longer low-resolution slits LL2 and SL sample a much larger part of cloud, even extending into the cloud surroundings. The slits are almost perpendicular to one another and overlap at the position of the compact object 2MASS J05375027-6911071.
In order to study the spatial variation of the spectral features along
the two slits, we sub-divided the region covered by each slit into 33
segments and extracted a spectrum from each segment. We have chosen
overlapping extraction windows of three pixels width, moving them
along the slit in single-pixel steps. Thus, adjacent extractions are
not independent of one another as they overlap by two pixels. The
corresponding spectrum is therefore effectively a boxcar-smoothed
spectrum. These particular choices resulted from tests performed on
the data to find the minimum extraction requirements needed to obtain
spectra free of sampling artifacts. For the same reason, the region
containing the bright object J05375027-6911071 was treated slightly
differently. Here, we applied an extraction window five pixels wide,
not overlapping with the adjacent pixels. As a consequence, the size
of the extraction window for J05375027-6911071 exceeds the dimensions
of the intersection region common to both the SL and LL2 slits; it
corresponds to a 7 pc ![]() 2.7 pc rectangle. We used PAHFIT with
its default set of lines and continuum features to determine the
intensities of the spectral features at every slit position. We have
plotted the intensities of fine-structure emission lines and dust
features thus extracted as a function of the position along the slit,
expressed in terms of the distance (positive and negative) from
J05375027-6911071 in Figs. 5-7.
2.7 pc rectangle. We used PAHFIT with
its default set of lines and continuum features to determine the
intensities of the spectral features at every slit position. We have
plotted the intensities of fine-structure emission lines and dust
features thus extracted as a function of the position along the slit,
expressed in terms of the distance (positive and negative) from
J05375027-6911071 in Figs. 5-7.
The SL spectra show PAH emission in the 6.2, 7.7, 8.6, 11.2 and
12.7 ![]() m bands. In determining the intensity of the latter, we
first removed the contribution from the [NeII] 12.8
m bands. In determining the intensity of the latter, we
first removed the contribution from the [NeII] 12.8 ![]() m line. We
note that the PAH emission from the N157B region is remarkably weak
compared to that of other sources in 30 Doradus (Brandl 2008).
m line. We
note that the PAH emission from the N157B region is remarkably weak
compared to that of other sources in 30 Doradus (Brandl 2008).
4 Discussion
4.1 The nature of the compact object J05375027-6911071
The flux densities in Table 2 are not accurate enough to
warrant detailed SED fitting of J05375027-6911071. However, by
comparing various modified blackbody fits with straightforward
integration we find an integrated flux of 5-
![]() W
m-2 which implies a luminosity L = 3.8-
W
m-2 which implies a luminosity L = 3.8-
![]() .
This luminosity corresponds to that of a B1-O9 star if
all stellar photons are converted to IR emission; it thus places a
lower limit on the spectral type of the exciting star(s). Much of the
emission must arise from hot dust, with temperatures between 180 and
350 K. The exciting star must therefore be close to the dense neutral
material, and we would expect the interface between star and neutral
material to consist of very dense ionized gas.
.
This luminosity corresponds to that of a B1-O9 star if
all stellar photons are converted to IR emission; it thus places a
lower limit on the spectral type of the exciting star(s). Much of the
emission must arise from hot dust, with temperatures between 180 and
350 K. The exciting star must therefore be close to the dense neutral
material, and we would expect the interface between star and neutral
material to consist of very dense ionized gas.
The Spitzer spectrum of J05375027-6911071
(Fig. 4) contains several diagnostic fine-structure
lines. The [SIII] lines at 18.7 ![]() m and 33.5
m and 33.5 ![]() m arise from
different levels with the same excitation energy and their ratio
provides a measure of the electron density (e.g. Tielens 2005). We
find a [SIII] 18.7
m arise from
different levels with the same excitation energy and their ratio
provides a measure of the electron density (e.g. Tielens 2005). We
find a [SIII] 18.7 ![]() m/ [SIII] 33. 5
m/ [SIII] 33. 5 ![]() m ratio of 0.24. Collisional
excitation models (Alexander et al. 1999) place this ratio in the low-density
limit, and indicate the presence of an ionized gas with
m ratio of 0.24. Collisional
excitation models (Alexander et al. 1999) place this ratio in the low-density
limit, and indicate the presence of an ionized gas with
![]() .
Such a density is not uncommon for a
parsec-sized HII region (cf. Fig. 2 in Habing & Israel 1979). It is
also quite consistent with the weak radio emission (about 40 mJy at
.
Such a density is not uncommon for a
parsec-sized HII region (cf. Fig. 2 in Habing & Israel 1979). It is
also quite consistent with the weak radio emission (about 40 mJy at
![]() 3.5-13 cm) in the maps published by Lazendic et al. (2000) and
Dickel et al. (1994). Assuming all radio emission in this direction to be
thermal and optically thin free-free emission, we calculate an
rms electron density
3.5-13 cm) in the maps published by Lazendic et al. (2000) and
Dickel et al. (1994). Assuming all radio emission in this direction to be
thermal and optically thin free-free emission, we calculate an
rms electron density
![]() -
-
![]() .
It
is unlikely that the ionized gas and the hot dust have different
sources of excitation. We must conclude that the bulk of the infrared
line and radio continuum emission arises from gas extended over a
volume much larger than occupied by the dense ionized gas surmised in
the previous paragraph. As we have not resolved structure on scales
less than a few parsecs, this is quite feasible.
.
It
is unlikely that the ionized gas and the hot dust have different
sources of excitation. We must conclude that the bulk of the infrared
line and radio continuum emission arises from gas extended over a
volume much larger than occupied by the dense ionized gas surmised in
the previous paragraph. As we have not resolved structure on scales
less than a few parsecs, this is quite feasible.
![\begin{figure}
\par\includegraphics[width=18cm]{9849fig2.eps} \end{figure}](/articles/aa/full_html/2009/23/aa09849-08/img32.png) |
Figure 2:
Left panel: IRAC 8.0 |
| Open with DEXTER | |
The ratios of lines of the same species but arising from different
ionization states reflect the degree of ionization and the hardness of
the stellar radiation field. We have measured such pairs of neon and
sulphur lines and find ratios [SIV]/[SIII] = 0.18 and [NeIII]/[NeII] =
0.49. In a sample of HII regions with different metallicities in the
Milky Way, the LMC, and the SMC these two ratios are tightly
correlated (cf. Fig. 1 by Martín-Hernández et al. 2002). Our result fits this
correlation very well but the individual ratios are lower than those
in the (very) bright LMC HII regions which have [SIV]/[SIII] =
0.6-1.0, and [NeIII]/[NeII] = 1.4-6.3. Not surprisingly, the gas in
J05375027-6911071 thus has a lower degree of ionization as is expected
from excitation by stars less hot than the ionizing stars in the
bright LMC HII regions. The photoionization models by Schaerer & de Koter (1997)
(CoStar) and by Pauldrach et al. (2001) show our line ratios to result from
stellar radiation fields with
![]() -
-
![]() corresponding to spectral type O5-O9 (cf. Martins et al. 2002). Under
the same assumption of optically thin free-free radio emission, we
calculate from the maps by Dickel et al. (1994) and Lazendic et al. (2000) a minimum
required Lyman-continuum photon flux
corresponding to spectral type O5-O9 (cf. Martins et al. 2002). Under
the same assumption of optically thin free-free radio emission, we
calculate from the maps by Dickel et al. (1994) and Lazendic et al. (2000) a minimum
required Lyman-continuum photon flux
![]() .
This
corresponds to the output of an O7.5-O9 star (Vacca et al. 1996).
.
This
corresponds to the output of an O7.5-O9 star (Vacca et al. 1996).
![\begin{figure}
\par\includegraphics[width=8.0cm]{9849fig3.eps}
\end{figure}](/articles/aa/full_html/2009/23/aa09849-08/img36.png) |
Figure 3:
Composite image of the N157B region:
red = Spitzer IRAC 8.0 |
| Open with DEXTER | |
Bright [FeII] 17.9 ![]() m, [FeII] 26.0
m, [FeII] 26.0 ![]() m and [SiII] 34.8
m and [SiII] 34.8 ![]() m
lines trace the return of iron and silicon to the gas phase following
the destruction of dust grains by shocks (Reach & Rho 2000; Oliva et al. 1999),
but a strong [SiII] line is also frequently detected
in PDRs (Peeters et al. 2002). In J05375027-6911071 [SiII] is one of the
strongest detected lines, whereas the [FeII] lines are weak with
respect to the others. The [SI] 25
m
lines trace the return of iron and silicon to the gas phase following
the destruction of dust grains by shocks (Reach & Rho 2000; Oliva et al. 1999),
but a strong [SiII] line is also frequently detected
in PDRs (Peeters et al. 2002). In J05375027-6911071 [SiII] is one of the
strongest detected lines, whereas the [FeII] lines are weak with
respect to the others. The [SI] 25 ![]() m line, also expected in
shocked gas (Tielens 2005), is missing but sulphur is detected as
[SIII] and [SIV], a situation characteristic for photo-ionized gas.
m line, also expected in
shocked gas (Tielens 2005), is missing but sulphur is detected as
[SIII] and [SIV], a situation characteristic for photo-ionized gas.
The intensity of the optical lines [SII]
![]() 6717, 6731
Å and H
6717, 6731
Å and H![]()
![]() 6563 Å provides a reliable tool to
discriminate between shock-excited and photo-ionized plasma
(Long et al. 1990) and were, in fact, used to establish the nature of
N157B (Danziger et al. 1981). In SNRs, [SII] emission is usually stronger
than in photoionized HII regions, where sulphur is mostly doubly
ionized. The value of the [S II]/H
6563 Å provides a reliable tool to
discriminate between shock-excited and photo-ionized plasma
(Long et al. 1990) and were, in fact, used to establish the nature of
N157B (Danziger et al. 1981). In SNRs, [SII] emission is usually stronger
than in photoionized HII regions, where sulphur is mostly doubly
ionized. The value of the [S II]/H![]() ratio separating SNRs and
HII regions is about 0.4 (Long et al. 1990; Fesen et al. 1985; D'Odorico et al. 1980). No optical
spectra are available for J05375027-6911071, but we may estimate the
[SII]/H
ratio separating SNRs and
HII regions is about 0.4 (Long et al. 1990; Fesen et al. 1985; D'Odorico et al. 1980). No optical
spectra are available for J05375027-6911071, but we may estimate the
[SII]/H![]() ratio from the MCELS line emission maps. The lines
are close enough to assume that they suffer approximately the same
extinction. We find a ratio [SII]/H
ratio from the MCELS line emission maps. The lines
are close enough to assume that they suffer approximately the same
extinction. We find a ratio [SII]/H
![]() ,
which is typical
for H II regions (Long et al. 1990). Note that in most of N157B, this
ratio exceeds
,
which is typical
for H II regions (Long et al. 1990). Note that in most of N157B, this
ratio exceeds ![]() 0.7 (Danziger et al. 1981).
0.7 (Danziger et al. 1981).
Finally, we note that the 9.7 ![]() m silicate absorption feature is
very strong towards J05375027-6911071, with an optical depth
m silicate absorption feature is
very strong towards J05375027-6911071, with an optical depth
![]() .
This implies the presence of a large
column of neutral material in front of the ionized line emission
region.
.
This implies the presence of a large
column of neutral material in front of the ionized line emission
region.
Thus, the 2MASS source J05375027-6911071 contains a purely photo-ionized gas of moderate density. The high column-density and elevated temperature of the dust suggests a blister-type geometry (Israel 1978) seen from the back, and a source of excitation located close to the interface of the HII region with the obscuring dense neutral material. In that case, no more than about half of the ionizing photons may escape, and we conclude from this and the local radiation field hardness that the excitation of J05375027-6911071 is caused by an obscured but no longer embedded O8 or O9 star.
4.2 The northeast edge of the dust cloud
The intensity variation of the spectral features along the rather
short SL slit is shown in Figs. 6 and
7. The SL slit runs from northeast to
southwest. It is potentially of interest as it cuts across the X-ray
SNR/IR dust cloud boundary (Fig. 2 left-hand panel).
Apart from J05375027-6911071, most of the emission in all lines comes
from the dust cloud, outside the X-ray contours. The [S IV]
intensities peak around +15 arcsec (3.5 pc) southwest from
J05375027-6911071. Towards the object itself, because of the low
resolution of the SL slit we could not separate the [SIV] emission
from the silicate absorption at 9.7 ![]() m, contrary to the high
resolution spectrum where the [SIV] is well detected. Both [Ar III]
and [Ne II] have intensity distributions strongly peaking on
J05375027-6911071, and that of [ArIII] is almost symmetrical.
The [NeII] distribution has an asymmetry similar to but less outspoken
than that of [SIV]. The ion with the highest ionization potential
(S[IV]) appears to trace the dust continuum best, but the lack of more
extensive spectral coverage makes it very hard to draw any solid
conclusions.
m, contrary to the high
resolution spectrum where the [SIV] is well detected. Both [Ar III]
and [Ne II] have intensity distributions strongly peaking on
J05375027-6911071, and that of [ArIII] is almost symmetrical.
The [NeII] distribution has an asymmetry similar to but less outspoken
than that of [SIV]. The ion with the highest ionization potential
(S[IV]) appears to trace the dust continuum best, but the lack of more
extensive spectral coverage makes it very hard to draw any solid
conclusions.
Table 2: Infrared flux densities.
![\begin{figure}
\par\includegraphics[width=9cm,clip]{9849fig4.eps} \end{figure}](/articles/aa/full_html/2009/23/aa09849-08/img40.png) |
Figure 4: Combined low- and high-resolution IRS spectrum of the 2MASS source J05375027-6911071. |
| Open with DEXTER | |
Table 3: Spitzer fine-structure lines observed in J05375027-6911071.
The various (weak) PAH features have symmetrical intensity
distributions, very similar to each other
(Fig. 7) and consistent with the 8.0 ![]() m
image which shows the stronger emission in southwest of the X-ray
contours. Figure 7 also shows the
[NeII]/[SIV] ratio. The excitation potentials of NeII
and SIV are 21.6 and 34.8 eV respectively. The ratio of the corresponding
ionic lines [NeII]/[SIV] can be used as a tracer of the hardness of
the interstellar radiation field (ISRF) in a similar way as the ratio
[NeII]/[NIII] (see for exemple Giveon et al. 2002): a lower ratio
corresponds to a harder ISRF. If PAHs were destroyed by FUV photons
(e.g. Madden et al. 2006), PAH intensities should be correlated with the
[NeII]/[SIV] ratio.
m
image which shows the stronger emission in southwest of the X-ray
contours. Figure 7 also shows the
[NeII]/[SIV] ratio. The excitation potentials of NeII
and SIV are 21.6 and 34.8 eV respectively. The ratio of the corresponding
ionic lines [NeII]/[SIV] can be used as a tracer of the hardness of
the interstellar radiation field (ISRF) in a similar way as the ratio
[NeII]/[NIII] (see for exemple Giveon et al. 2002): a lower ratio
corresponds to a harder ISRF. If PAHs were destroyed by FUV photons
(e.g. Madden et al. 2006), PAH intensities should be correlated with the
[NeII]/[SIV] ratio.
Inspection of Fig. 7 reveals a clear trend:
the PAH profiles peak where the [NeII]/[SIV] ratio dives (
![]() W)
probably indicating the edge of an ionized region where PAHs are destroyed.
We refer for a more extensive and detailed discussion of
PAHs in the whole 30 Doradus region to Bernard-Salas (2008).
W)
probably indicating the edge of an ionized region where PAHs are destroyed.
We refer for a more extensive and detailed discussion of
PAHs in the whole 30 Doradus region to Bernard-Salas (2008).
![\begin{figure}
\par\includegraphics[width=9cm,clip]{9849fig5.eps} \end{figure}](/articles/aa/full_html/2009/23/aa09849-08/img43.png) |
Figure 5: Spatial variation of continuum and emission line intensities along the low-resolution slit LL2, calculated with the program PAHFIT. The vertical bar on the left mark indicates the representative error on fitted intensities. Spatial distances along the slit are measured from the position of J05375027-6911071 (0 arcsec). The horizontal bar indicates the size of the five-pixel wide extraction window for J05375027-6911071; all other data points refer to three-pixel wide extraction windows. |
| Open with DEXTER | |
4.3 Conditions in the extended dust cloud
Table 4: PAH dust emission features measured in J05375027-6911071.
![\begin{figure}
\par\includegraphics[width=9cm,clip]{9849fig6.eps}
\end{figure}](/articles/aa/full_html/2009/23/aa09849-08/img45.png) |
Figure 6: Spatial variation of emission line intensities along the low-resolution slit SL. Otherwise as Fig. 5. Towards J05375027-6911071 the [S IV] line is undetectable because of strong silicate absorption. |
| Open with DEXTER | |
![\begin{figure}
\par\includegraphics[width=9cm,clip]{9849fig7.eps}
\end{figure}](/articles/aa/full_html/2009/23/aa09849-08/img46.png) |
Figure 7: Spatial variation of PAH feature intensities ( top panels) compared to the [Ne II]/[S IV] ratio (same plot reproduced in both bottom panels for clarity) along the low-resolution slit SL. The vertical bar on the left mark indicates the representative error on fitted intensities in the region between -35 and -5 arcsec. The oscillations are due to instabilities in the fit caused by weak signals. Otherwise as Fig. 5. |
| Open with DEXTER | |
Figure 5 depicts the spatial intensity variation of
spectral features along the significantly longer SE-NW LL2 slit. The
slit extends from a region with weak IR emission and no X-rays to the
northwest, fully crossing the H![]() and X-ray emitting SNR
(Fig. 2 left-hand panel). The compact source
J05375027-6911071 is brighter than its surroundings in the continuum,
and in the [SIII] and [FeII] lines, but not in the [NeIII] line.
Beyond this source, the distributions of [SIII], [NeII] and the
continuum are similar and peak about 50 arcsec (12 pc projected
distance) to its northwest. The [FeII] from the diffuse cloud is
relatively sharply peaked. Although uncertain, this peak may indicate
the presence of shocked gas at an SNR/dust cloud interface. As the
Ne[III] and [SIII] intensity distributions peak closest to the early O
stars in LH 99 (see Fig. 2 and Sect. 4.3), they seem to
reflect the radiative effects of these.
and X-ray emitting SNR
(Fig. 2 left-hand panel). The compact source
J05375027-6911071 is brighter than its surroundings in the continuum,
and in the [SIII] and [FeII] lines, but not in the [NeIII] line.
Beyond this source, the distributions of [SIII], [NeII] and the
continuum are similar and peak about 50 arcsec (12 pc projected
distance) to its northwest. The [FeII] from the diffuse cloud is
relatively sharply peaked. Although uncertain, this peak may indicate
the presence of shocked gas at an SNR/dust cloud interface. As the
Ne[III] and [SIII] intensity distributions peak closest to the early O
stars in LH 99 (see Fig. 2 and Sect. 4.3), they seem to
reflect the radiative effects of these.
The ISO SWS and LWS instruments have provided spectroscopy from
differently-sized regions (Vermeij et al. 2002) roughly covering the O3
stars marked in Fig. 2. The LL2 slit misses the SWS
aperture completely, but does overlap with part of the LWS aperture.
The [NeIII] 15.6/36.0 ![]() m, [SIII] 18.7/33.5
m, [SIII] 18.7/33.5 ![]() m, and [OIII]
51.8/88.4
m, and [OIII]
51.8/88.4 ![]() m ratios (6.73, 0.40, 0.56 resp.) are all in the
low-density limit, indicating
m ratios (6.73, 0.40, 0.56 resp.) are all in the
low-density limit, indicating
![]() .
The ISO
spectra also show [FeII] 26.0
.
The ISO
spectra also show [FeII] 26.0 ![]() m and [SiII] 34.8
m and [SiII] 34.8 ![]() m line
emission but not sufficiently dominant to be ascribed unequivocally to
shock excitation. More importantly, the ISO data by Vermeij et al. (2002)
imply ratios [SIV]/[SIII] = 0.25 and [NeIII]/[NeII] = 1.74. These
values are also in excellent agreement with the relation established
by Martín-Hernández et al. (2002), and place the cloud somewhat closer to the bright
LMC nebulae. Although there are complications briefly discussed by
Martín-Hernández et al. (2002), the ratios, taken at face value, suggest excitation by
O5-O6 stars rather than by O3 stars.
m line
emission but not sufficiently dominant to be ascribed unequivocally to
shock excitation. More importantly, the ISO data by Vermeij et al. (2002)
imply ratios [SIV]/[SIII] = 0.25 and [NeIII]/[NeII] = 1.74. These
values are also in excellent agreement with the relation established
by Martín-Hernández et al. (2002), and place the cloud somewhat closer to the bright
LMC nebulae. Although there are complications briefly discussed by
Martín-Hernández et al. (2002), the ratios, taken at face value, suggest excitation by
O5-O6 stars rather than by O3 stars.
The spectral energy distribution of the extended infrared cloud is shown
in Fig. 8. The emission peak is consistent with a modified
black-body of temperature
![]() (
(
![]() ,
with
,
with ![]() ).
Integration of the emission yields a flux of 1.1-
).
Integration of the emission yields a flux of 1.1-
![]() implying a luminosity L = 0.8-
implying a luminosity L = 0.8-
![]() .
There is a second hot dust component, with a temperature
.
There is a second hot dust component, with a temperature
![]() K,
and a luminosity (excluding emission from J05375027-6911071)
L = 4-
K,
and a luminosity (excluding emission from J05375027-6911071)
L = 4-
![]() .
In the 12
.
In the 12 ![]() m
IRAS band the compact source has a strong silicate absorption at 10
m
IRAS band the compact source has a strong silicate absorption at 10 ![]() m,
which makes not possible the separation of the compact source and extended
cloud contributions. Before fitting the hot dust component we thus removed
the 12
m,
which makes not possible the separation of the compact source and extended
cloud contributions. Before fitting the hot dust component we thus removed
the 12 ![]() m IRAS point, for which the flux density is in fact 30 times lower
than for the neighboring bands.
Because of the very strong
temperature dependence of dust emissivity, the mass in the hot dust
component represents only a minute fraction of the total mass. The
three O3 stars dominating the LH 99 population are projected onto
the northeastern edge of the infrared cloud as depicted at 24
m IRAS point, for which the flux density is in fact 30 times lower
than for the neighboring bands.
Because of the very strong
temperature dependence of dust emissivity, the mass in the hot dust
component represents only a minute fraction of the total mass. The
three O3 stars dominating the LH 99 population are projected onto
the northeastern edge of the infrared cloud as depicted at 24 ![]() m
in Fig. 1. To their southwest,
i.e. closer to the brightest part of the nebula, there are at least 2
O5 stars, 5 O6 stars, and 5 O7 stars (cf. Schild & Testor 1992). Using the
luminosity scale by Vacca et al. (1996), we find that these stars add
another
m
in Fig. 1. To their southwest,
i.e. closer to the brightest part of the nebula, there are at least 2
O5 stars, 5 O6 stars, and 5 O7 stars (cf. Schild & Testor 1992). Using the
luminosity scale by Vacca et al. (1996), we find that these stars add
another
![]() -
-
![]() to the
luminosity
to the
luminosity
![]() already
provided by the brightest stars. The hardness of the resulting mean
radiation field should therefore not be very different from the one
estimated above.
already
provided by the brightest stars. The hardness of the resulting mean
radiation field should therefore not be very different from the one
estimated above.
Emission from the radio source appears to avoid the dark cloud (see
Fig. 4 in Dickel et al. 1994). This is not expected if the dust cloud is
only a foreground object, and it therefore indicates physical contact
between the radio (SNR) and infrared (molecular cloud) sources
respectively. However, the infrared cloud reradiates at most 15![]() of the total photon output of the association members, requiring it to
cover only about a steradian as seen from the average O star. LH 99
should thus be deemed to be quite capable of providing the energy to
power the infrared cloud, and there seems to be no need to invoke
energy inputs provided by an SNR impact.
of the total photon output of the association members, requiring it to
cover only about a steradian as seen from the average O star. LH 99
should thus be deemed to be quite capable of providing the energy to
power the infrared cloud, and there seems to be no need to invoke
energy inputs provided by an SNR impact.
Chu et al. (1992) have suggested that no more than about 20![]() of the
radio emission from MC 69 is thermal in origin, so that
of the
radio emission from MC 69 is thermal in origin, so that
![]() (cf. Lazendic et al. 2000). This requires a
maximum Lyman continuum photon flux
(cf. Lazendic et al. 2000). This requires a
maximum Lyman continuum photon flux
![]() s-1. The three somewhat excentric O3 stars provide a combined
flux
s-1. The three somewhat excentric O3 stars provide a combined
flux
![]() s-1, and the more embedded
later-type O stars an almost equal
s-1, and the more embedded
later-type O stars an almost equal
![]() s-1. Thus, the UV photon flux likewise should be sufficient to
provide for the ionization of the HII nebula associated with the SNR
and dust cloud.
s-1. Thus, the UV photon flux likewise should be sufficient to
provide for the ionization of the HII nebula associated with the SNR
and dust cloud.
4.4 The SNR revisited
![\begin{figure}
\includegraphics[width=9cm,clip]{9849fig8.eps}
\end{figure}](/articles/aa/full_html/2009/23/aa09849-08/img63.png) |
Figure 8:
Spectral energy distribution of infrared
emission from the extended dust cloud. The data points are
fitted with two modified black-body with T = 230 and
T = 29 K. The horizontal bars indicate the width
of the IRAC (Fazio et al. 2004), MIPS (Rieke et al. 2004) and
IRAS bands (Schwering 1989). The 12 |
| Open with DEXTER | |
The actual location of the cloud with respect to the remnant is still
poorly determined. The data presented here have revealed no evidence
for shocked material, although the dense cloud of dust and molecules
does appear to be quite close to the SNR. Is the absence of such
impact (shock) signatures consistent with the dynamical evolution of
the remnant? We assume that the remnant expansion is in the Sedov
phase (Wang & Gotthelf 1998), so that the temporal evolution of the
spherical blast wave with radius ![]() ,
produced by the supernova
explosion into a medium of uniform density
,
produced by the supernova
explosion into a medium of uniform density ![]() ,
is described by
(Sedov 1959; McCray & Snow 1979):
,
is described by
(Sedov 1959; McCray & Snow 1979):
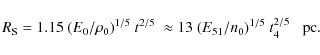
We assume an initial energy E51 =
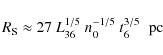
where
Thus, we conclude that the lack of clear indications for an SNR impact
on the dust cloud seen in the IRAC and MIPS images is consistent with
the supernova explosion of a moderately massive star. Only now would
the SNR expanding in the cavity begin to overtake the windblown shell
produced by the star over its lifetime. The apparent lack of shocks
is not easily reconcilable with a supernova progenitor as massive as
the presently most luminous members of the LH 99 association. This
confirms an independent conclusion by Chen et al. (2006) that the
progenitor should have been in the narrow mass range M = 20-
![]() .
.
5 Conclusions
From an analysis of Spitzer photometric mapping and spectroscopy of the SNR-dominated region N157B in the LMC, we find that:
- There is no evidence of an infrared counterpart to the supernova remnant in the IRAC and MIPS images.
- The infrared emission is dominated by a cloud of dust and molecular gas adjacent to the remnant, containing the compact 2MASS source J05375027-6911071.
- The object J05375027-6911071 has a diameter of about 3 pc, an electron-density of 100-250 cm-3, and is photo-ionized by an O8-O9 star. It is probably an open HII blister structure, seen from the back.
- In spite of the projected overlap between the SNR X-ray emission and the infrared cloud, there is at best very marginal evidence of shocked gas, while almost all data suggest photo-ionization and photon-heating to be the mechanisms dominating the infrared cloud.
- The extended dust cloud is associated with ionized emission of a density of typically 100 cm-3, presumably at the edges of a denser molecular cloud. As the extended dust reradiates only about 10 per cent of the luminosity of the 15 brightest and nearby O stars in the LH 99 OB association, these stars are sufficient to explain the heating of the dust cloud.
- The absence of clear evidence of shocks implies that at
present the molecular/dust cloud is not significantly impacted by
the remnant. This suggests that the supernova progenitor was a
moderately massive star of mass
 .
.
Acknowledgements
We gratefully acknowledge D. Wang, J. Dickel, and R. Gruendl for providing Chandra data, radio continuum observations, and information on the N157B stellar population, and we would like to thank the referee for careful reading and useful comments. E.R.M. thanks A. Jones and A. Tielens for support and useful discussions and acknowledges financial support by the EARA Training Network (EU grant MEST-CT-2004-504604). This work is based in part on observations made with the Spitzer Space Telescope, which is operated by the Jet Propulsion Laboratory, California Institute of Technology, under NASA contract 1047.
References
- Alexander, T., Sturm, E., Lutz, D., et al. 1999, ApJ, 512, 204 [NASA ADS] [CrossRef] (In the text)
- Bernard-Salas, J. 2008, in preparation (In the text)
- Brandl, B. R. 2008, in preparation (In the text)
- Chen, Y., Wang, Q. D., Gotthelf, E. V., et al. 2006, ApJ, 651, 237 [NASA ADS] [CrossRef] (In the text)
- Chu, Y.-H., Kennicutt, Jr., R. C., Schommer, R. A., & Laff, J. 1992, AJ, 103, 1545 [NASA ADS] [CrossRef]
- Danziger, I. J., Goss, W. M., Murdin, P., Clark, D. H., & Boksenberg, A. 1981, MNRAS, 195, 33P [NASA ADS] (In the text)
- Decin, L., Morris, P. W., Appleton, P. N., et al. 2004, ApJS, 154, 408 [NASA ADS] [CrossRef] (In the text)
- Dickel, J. R., Milne, D. K., Kennicutt, R. C., Chu, Y.-H., & Schommer, R. A. 1994, AJ, 107, 1067 [NASA ADS] [CrossRef] (In the text)
- D'Odorico, S., Dopita, M. A., & Benvenuti, P. 1980, A&AS, 40, 67 [NASA ADS]
- Fazio, G. G., Hora, J. L., Allen, L. E., et al. 2004, ApJS, 154, 10 [NASA ADS] [CrossRef] (In the text)
- Fesen, R. A., Blair, W. P., & Kirshner, R. P. 1985, ApJ, 292, 29 [NASA ADS] [CrossRef]
- Giveon, U., Sternberg, A., Lutz, D., Feuchtgruber, H., & Pauldrach, A. W. A. 2002, ApJ, 566, 880 [NASA ADS] [CrossRef] (In the text)
- Habing, H. J., & Israel, F. P. 1979, ARA&A, 17, 345 [NASA ADS] [CrossRef] (In the text)
- Heger, A., Fryer, C. L., Woosley, S. E., Langer, N., & Hartmann, D. H. 2003, ApJ, 591, 288 [NASA ADS] [CrossRef] (In the text)
- Henize, K. G. 1956, ApJS, 2, 315 [NASA ADS] [CrossRef] (In the text)
- Higdon, S. J. U., Devost, D., Higdon, J. L., et al. 2004, PASP, 116, 975 [NASA ADS] [CrossRef] (In the text)
- Houck, J. R., Roellig, T. L., van Cleve, J., et al. 2004, ApJS, 154, 18 [NASA ADS] [CrossRef] (In the text)
- Israel, F. P. 1978, A&A, 70, 769 [NASA ADS] (In the text)
- Johansson, L. E. B., Greve, A., Booth, R. S., et al. 1998, A&A, 331, 857 [NASA ADS] (In the text)
- Karttunen, H. 1995, Fundamental Astronomy (Springer) (In the text)
- Lazendic, J. S., Dickel, J. R., Haynes, R. F., Jones, P. A., & White, G. L. 2000, ApJ, 540, 808 [NASA ADS] [CrossRef] (In the text)
- Le Marne, A. E. 1968, MNRAS, 139, 461 [NASA ADS]
- Long, K. S., & Helfand, D. J. 1979, ApJ, 234, L77 [NASA ADS] [CrossRef] (In the text)
- Long, K. S., Blair, W. P., Kirshner, R. P., & Winkler, P. F. 1990, ApJS, 72, 61 [NASA ADS] [CrossRef] (In the text)
- Lucke, P. B., & Hodge, P. W. 1970, AJ, 75, 171 [NASA ADS] [CrossRef] (In the text)
- Madden, S. C., Galliano, F., Jones, A. P., & Sauvage, M. 2006, A&A, 446, 877 [NASA ADS] [CrossRef] [EDP Sciences] (In the text)
- Marshall, F. E., Gotthelf, E. V., Zhang, W., Middleditch, J., & Wang, Q. D. 1998, ApJ, 499, L179 [NASA ADS] [CrossRef]
- Martín-Hernández, N. L., Vermeij, R., Tielens, A. G. G. M., van der Hulst, J. M., & Peeters, E. 2002, A&A, 389, 286 [NASA ADS] [CrossRef] [EDP Sciences]
- Martins, F., Schaerer, D., & Hillier, D. J. 2002, A&A, 382, 999 [NASA ADS] [CrossRef] [EDP Sciences] (In the text)
- McCray, R., & Snow, Jr., T. P. 1979, ARA&A, 17, 213 [NASA ADS] [CrossRef]
- McGee, R. X., Brooks, J. W., & Batchelor, R. A. 1972, Austr. J. Phys., 25, 581 [NASA ADS]
- Mills, B. Y., Turtle, A. J., & Watkinson, A. 1978, MNRAS, 185, 263 [NASA ADS]
- Oliva, E., Moorwood, A. F. M., Drapatz, S., Lutz, D., & Sturm, E. 1999, A&A, 343, 943 [NASA ADS]
- Pauldrach, A. W. A., Hoffmann, T. L., & Lennon, M. 2001, A&A, 375, 161 [NASA ADS] [CrossRef] [EDP Sciences] (In the text)
- Peeters, E., Martín-Hernández, N. L., Damour, F., et al. 2002, A&A, 381, 571 [NASA ADS] [CrossRef] [EDP Sciences] (In the text)
- Reach, W. T., & Rho, J. 2000, ApJ, 544, 843 [NASA ADS] [CrossRef]
- Rieke, G. H., Young, E. T., Engelbracht, C. W., et al. 2004, ApJS, 154, 25 [NASA ADS] [CrossRef] (In the text)
- Sasaki, M., Haberl, F., & Pietsch, W. 2000, A&AS, 143, 391 [NASA ADS] [CrossRef] [EDP Sciences] (In the text)
- Schaerer, D., & de Koter, A. 1997, A&A, 322, 598 [NASA ADS] (In the text)
- Schild, H., & Testor, G. 1992, A&AS, 92, 729 [NASA ADS] (In the text)
- Schwering, P. B. W. 1989, A&AS, 79, 105 [NASA ADS] (In the text)
- Sedov, L. 1959, Similarity and Dimensional Methods in Mechanics (New York: Academic)
- Smith, J. D. T., Draine, B. T., Dale, D. A., et al. 2007, ApJ, 656, 770 [NASA ADS] [CrossRef] (In the text)
- Smith, R. C., & MCELS Team 1998, Publ. Astron. Soc. Austr., 15, 163 [NASA ADS] (In the text)
- Thielemann, F.-K., Nomoto, K., & Hashimoto, M.-A. 1996, ApJ, 460, 408 [NASA ADS] [CrossRef] (In the text)
- Tielens, A. G. G. M. 2005, The Physics and Chemistry of the Interstellar Medium (University of Cambridge Press)
- Townsley, L. K., Broos, P. S., Feigelson, E. D., et al. 2006, AJ, 131, 2140 [NASA ADS] [CrossRef] (In the text)
- Vacca, W. D., Garmany, C. D., & Shull, J. M. 1996, ApJ, 460, 914 [NASA ADS] [CrossRef] (In the text)
- Vermeij, R., Damour, F., van der Hulst, J. M., & Baluteau, J.-P. 2002, A&A, 390, 649 [NASA ADS] [CrossRef] [EDP Sciences] (In the text)
- Vermeij, R., & van der Hulst, J. M. 2002, A&A, 391, 1081 [NASA ADS] [CrossRef] [EDP Sciences] (In the text)
- Wang, Q. D., & Gotthelf, E. V. 1998, ApJ, 494, 623 [NASA ADS] [CrossRef] (In the text)
- Werner, M. W., Roellig, T. L., Low, F. J., et al. 2004, ApJS, 154, 1 [NASA ADS] [CrossRef] (In the text)
- Westerlund, B. E. 1997, The Magellanic Clouds (University of Cambridge Press) (In the text)
- Woosley, S. E., & Weaver, T. A. 1995, ApJS, 101, 181 [NASA ADS] [CrossRef] (In the text)
Footnotes
- ...
7
![[*]](/icons/foot_motif.png)
- http://ssc.spitzer.caltech.edu/documents/SOM
- ...
IRSCLEAN
- Available at http://ssc.spitzer.caltech.edu/archanaly/contributed/
- ...
PAHFIT
- Available at http://turtle.as.arizona.edu/jdsmith/pahfit.php
All Tables
Table 1: IRS observational setup. The IRS modules are SL: Short-Low, LL2: Long-Low 2, SH: Short-High, LH: Long-High.
Table 2: Infrared flux densities.
Table 3: Spitzer fine-structure lines observed in J05375027-6911071.
Table 4: PAH dust emission features measured in J05375027-6911071.
All Figures
| |
Figure 1: IRAC and MIPS images of the N157B region, calibrated in MJy/sr. The diamond marks the peak of the supernova remnant X-ray emission (Sasaki et al. 2000) and the circle marks the 2MASS compact source J05375027-6911071. The coordinates are (RA, Dec) J2000. |
| Open with DEXTER | |
| In the text | |
| |
Figure 2:
Left panel: IRAC 8.0 |
| Open with DEXTER | |
| In the text | |
| |
Figure 3:
Composite image of the N157B region:
red = Spitzer IRAC 8.0 |
| Open with DEXTER | |
| In the text | |
| |
Figure 4: Combined low- and high-resolution IRS spectrum of the 2MASS source J05375027-6911071. |
| Open with DEXTER | |
| In the text | |
| |
Figure 5: Spatial variation of continuum and emission line intensities along the low-resolution slit LL2, calculated with the program PAHFIT. The vertical bar on the left mark indicates the representative error on fitted intensities. Spatial distances along the slit are measured from the position of J05375027-6911071 (0 arcsec). The horizontal bar indicates the size of the five-pixel wide extraction window for J05375027-6911071; all other data points refer to three-pixel wide extraction windows. |
| Open with DEXTER | |
| In the text | |
| |
Figure 6: Spatial variation of emission line intensities along the low-resolution slit SL. Otherwise as Fig. 5. Towards J05375027-6911071 the [S IV] line is undetectable because of strong silicate absorption. |
| Open with DEXTER | |
| In the text | |
| |
Figure 7: Spatial variation of PAH feature intensities ( top panels) compared to the [Ne II]/[S IV] ratio (same plot reproduced in both bottom panels for clarity) along the low-resolution slit SL. The vertical bar on the left mark indicates the representative error on fitted intensities in the region between -35 and -5 arcsec. The oscillations are due to instabilities in the fit caused by weak signals. Otherwise as Fig. 5. |
| Open with DEXTER | |
| In the text | |
| |
Figure 8:
Spectral energy distribution of infrared
emission from the extended dust cloud. The data points are
fitted with two modified black-body with T = 230 and
T = 29 K. The horizontal bars indicate the width
of the IRAC (Fazio et al. 2004), MIPS (Rieke et al. 2004) and
IRAS bands (Schwering 1989). The 12 |
| Open with DEXTER | |
| In the text | |
Copyright ESO 2009
Current usage metrics show cumulative count of Article Views (full-text article views including HTML views, PDF and ePub downloads, according to the available data) and Abstracts Views on Vision4Press platform.
Data correspond to usage on the plateform after 2015. The current usage metrics is available 48-96 hours after online publication and is updated daily on week days.
Initial download of the metrics may take a while.