| Issue |
A&A
Volume 495, Number 3, March I 2009
|
|
|---|---|---|
| Page(s) | 837 - 846 | |
| Section | Interstellar and circumstellar matter | |
| DOI | https://doi.org/10.1051/0004-6361:200811001 | |
| Published online | 14 January 2009 | |
Lack of PAH emission toward low-mass embedded young stellar objects![[*]](/icons/foot_motif.gif)
V. C. Geers 1,2 - E. F. van Dishoeck1 - K. M. Pontoppidan3 - F. Lahuis4 - A. Crapsi1,5 - C. P. Dullemond6 - G. A. Blake3
1 - Leiden Observatory, Leiden University, PO Box 9513, 2300 RA Leiden, The Netherlands
2 - University of Toronto, 50 St. George St., Toronto, ON M5R 2W9, Canada
3 - Division of Geological and Planetary Sciences, Mail Code 150-21, California Institute of Technology, Pasadena, CA 91125, USA
4 - SRON Netherlands Institute for Space Research, PO Box 800, 9700 AV Groningen, The Netherlands
5 - Observatorio Astronómico Nacional (IGN), Alfonso XII, 3, 28014 Madrid, Spain
6 - Max-Planck-Institut für Astronomie, Koenigstuhl 17, 69117 Heidelberg, Germany
Received 19 September 2008 / Accepted 2 December 2008
Abstract
Aims. Polycyclic aromatic hydrocarbons (PAHs) have been detected toward molecular clouds and some young stars with disks, but have not yet been associated with embedded young stars. We present a sensitive mid-infrared spectroscopic survey of PAH features toward a sample of low-mass embedded young stellar objects (YSOs). The aim is to put constraints on the PAH abundance in the embedded phase of star formation using radiative transfer modeling.
Methods. VLT-ISAAC L-band spectra for 39 sources and Spitzer IRS spectra for 53 sources are presented. Line intensities are compared to recent surveys of Herbig Ae/Be and T Tauri stars. The radiative transfer codes RADMC and RADICAL are used to model the PAH emission from embedded YSOs consisting of a pre-main-sequence star with a circumstellar disk embedded in an envelope. The dependence of the PAH feature on PAH abundance, stellar radiation field, inclination and the extinction by the surrounding envelope is studied.
Results. The 3.3 ![]() m PAH feature is undetected for the majority of the sample (97%), with typical upper limits of
m PAH feature is undetected for the majority of the sample (97%), with typical upper limits of
![]() W m-2. One source originally classified as class I, IRS 48, shows a strong 3.3
W m-2. One source originally classified as class I, IRS 48, shows a strong 3.3 ![]() m feature from a disk. Compact 11.2
m feature from a disk. Compact 11.2 ![]() m PAH emission is seen directly towards 1 out of the 53 Spitzer Short-High spectra, for a source that is borderline embedded. For all 12 sources with both VLT and Spitzer spectra, no PAH features are detected in either. In total, PAH features are detected toward at most 1 out of 63 (candidate) embedded protostars (
m PAH emission is seen directly towards 1 out of the 53 Spitzer Short-High spectra, for a source that is borderline embedded. For all 12 sources with both VLT and Spitzer spectra, no PAH features are detected in either. In total, PAH features are detected toward at most 1 out of 63 (candidate) embedded protostars (![]() 2%), even lower than observed for class II T Tauri stars with disks (11-14%). Models predict the 7.7
2%), even lower than observed for class II T Tauri stars with disks (11-14%). Models predict the 7.7 ![]() m feature as the best tracer of PAH emission, while the 3.3
m feature as the best tracer of PAH emission, while the 3.3 ![]() m feature is relatively weak. Assuming typical class I stellar and envelope parameters, the absence of PAH emission is most likely explained by the absence of emitting carriers through a PAH abundance at least an order of magnitude lower than in molecular clouds but similar to that found in disks. Thus, most PAHs likely enter the protoplanetary disks frozen out in icy layers on dust grains and/or in coagulated form.
m feature is relatively weak. Assuming typical class I stellar and envelope parameters, the absence of PAH emission is most likely explained by the absence of emitting carriers through a PAH abundance at least an order of magnitude lower than in molecular clouds but similar to that found in disks. Thus, most PAHs likely enter the protoplanetary disks frozen out in icy layers on dust grains and/or in coagulated form.
Key words: stars: pre-main sequence - stars: planetary systems: protoplanetary disks - stars: circumstellar matter - astrochemistry
1 Introduction
Polycyclic aromatic hydrocarbons (PAHs) have been observed toward a wide range of astrophysical environments (Peeters et al. 2002; Allamandola et al. 1989), including the interstellar medium (ISM) and star-forming regions, first hinted at by the discovery of widespread broad emission features in the mid-infrared. Since PAHs are a good tracer of UV radiation, they are an indirect probe of star formation in the high opacity environments of molecular clouds as well as circumstellar disks. Recent spectroscopic studies have detected PAHs toward a significant fraction, 11-14% and 54% of low-mass and intermediate mass pre-main-sequence (PMS) stars respectively (Acke & van den Ancker 2004; Geers 2007, Chap. 2), and recent ground-based high spatial resolution observations show evidence that the PAH emission originates from the circumstellar disks (Geers et al. 2007a; Habart et al. 2006; Ressler & Barsony 2003; Geers et al. 2007b). PAHs are also prominently seen toward photon dominated regions (PDRs) in dense clouds exposed to massive young stars (e.g., Verstraete et al. 1996). However, to this date, no significant PAH emission has been reported to be directly associated with the earlier class 0-I phase, when a (proto)star with a circumstellar disk is still embedded in an envelope of gas and dust. Deeply embedded high-mass young stellar objects (YSOs) also lack prominent PAH emission (van Dishoeck & van der Tak 2000).
PAHs are believed to form in the outflows of carbon-rich asymptotic giant branch (AGB) stars, which deposit them in the interstellar medium (e.g., Helling et al. 1996). Their ubiquitous presence in the ISM shows that at least larger PAH molecules (of 50-100 carbon atoms or more) will survive this phase, until being incorporated in molecular clouds. The amount of carbon locked up in PAHs is [C/H]
![]() (Habart et al. 2004), corresponding to PAH abundances of
(Habart et al. 2004), corresponding to PAH abundances of ![]()
![]() relative to H, for PAH molecules of 100 carbon atoms, making them among the most abundant molecules after H2 and CO.
relative to H, for PAH molecules of 100 carbon atoms, making them among the most abundant molecules after H2 and CO.
PAHs can play an important role in the star-forming environments. As large molecules, they provide efficient heating of the gas in both the ISM and circumstellar disks. Small dust particles like PAHs have also been suggested as the main formation site of molecules such as H2 and water in the later evolutionary phases of circumstellar disks when classical grains have grown to large sizes (Jonkheid et al. 2006).
The shape and relative strength of the PAH features in the 6-9 ![]() m region has been shown to vary between various astrophysical environments from AGBs and the ISM to the class II disk sources. This has provided evidence that the emission characteristics of PAHs are sensitive to local physical conditions and that interstellar PAHs undergo processing in space environments (Peeters et al. 2002). Further support for this comes from recent values for the PAH abundance in disk surface layers, which is a factor of 10-100 lower than in the ISM for sources with sufficient UV radiation to excite them (Geers et al. 2006). PAHs frozen out on icy grains can chemically react with other molecules to form a large variety of complex species, including pre-biotic molecules (Ehrenfreund et al. 2006; Bernstein et al. 1999).
A study of PAHs toward embedded low-mass young stars is important to find out what happens to PAHs and how large a role they may play in these embedded objects.
m region has been shown to vary between various astrophysical environments from AGBs and the ISM to the class II disk sources. This has provided evidence that the emission characteristics of PAHs are sensitive to local physical conditions and that interstellar PAHs undergo processing in space environments (Peeters et al. 2002). Further support for this comes from recent values for the PAH abundance in disk surface layers, which is a factor of 10-100 lower than in the ISM for sources with sufficient UV radiation to excite them (Geers et al. 2006). PAHs frozen out on icy grains can chemically react with other molecules to form a large variety of complex species, including pre-biotic molecules (Ehrenfreund et al. 2006; Bernstein et al. 1999).
A study of PAHs toward embedded low-mass young stars is important to find out what happens to PAHs and how large a role they may play in these embedded objects.
In this paper we present the first mid-infrared spectroscopic survey for PAH emission from embedded low-mass young stellar objects using the Infrared Spectrometer And Array Camera (ISAAC) mounted on the ESO Very Large Telescope (VLT) and the Infrared Spectrograph (IRS) on board the NASA Spitzer Telescope, in a wide range of nearby star-forming regions. We subsequently use a radiative transfer code to model PAH emission from young stars with disks embedded in an envelope, and discuss the observed detection rate in the context of PAH abundance, the strength of UV emission from the protostar and the extinction from the envelope.
2 Observations and data reduction
A large sample of low-mass embedded objects was selected from two previous mid-infrared studies. A set of 39 sources was selected from a VLT-ISAAC 3-5 ![]() m band survey
(van Dishoeck et al. 2003), of which 32 were previously presented in Pontoppidan et al. (2003) and three additional sources in Thi et al. (2006). For this survey L-band spectroscopy was obtained with ISAAC, the Infrared Spectrometer And Array Camera, installed at the VLT Antu (UT1) at ESO's Paranal Observatory in Chile, in the low resolution (
m band survey
(van Dishoeck et al. 2003), of which 32 were previously presented in Pontoppidan et al. (2003) and three additional sources in Thi et al. (2006). For this survey L-band spectroscopy was obtained with ISAAC, the Infrared Spectrometer And Array Camera, installed at the VLT Antu (UT1) at ESO's Paranal Observatory in Chile, in the low resolution (
![]() -1200) spectroscopic mode in the spectral domain 2.8-4.2
-1200) spectroscopic mode in the spectral domain 2.8-4.2 ![]() m using a
m using a
![]() slit. The telescope was operated using a standard chop-throw scheme with typical chop-throws of 10-20
slit. The telescope was operated using a standard chop-throw scheme with typical chop-throws of 10-20
![]() .
A full description of observation and reduction techniques is given in Pontoppidan et al. (2003). These sources were required to have a rising spectral energy distribution (SED) in the mid-infrared as well as the presence of an H2O ice feature at 3
.
A full description of observation and reduction techniques is given in Pontoppidan et al. (2003). These sources were required to have a rising spectral energy distribution (SED) in the mid-infrared as well as the presence of an H2O ice feature at 3 ![]() m. The selected sources are listed in Table A.1.
m. The selected sources are listed in Table A.1.
In addition, a sample of 53 Spitzer Space Telescope Infrared Spectrograph (Spitzer IRS) Short-High (10-20 ![]() m,
m, ![]() )
spectra and 33 Short-Low (5-14.5
)
spectra and 33 Short-Low (5-14.5 ![]() m,
m, ![]() )
of class I sources were obtained in the context of the ``Cores to Disks'' (c2d) Legacy program (Evans et al. 2003).
These sources were selected as showing the silicate 10
)
of class I sources were obtained in the context of the ``Cores to Disks'' (c2d) Legacy program (Evans et al. 2003).
These sources were selected as showing the silicate 10 ![]() m feature in absorption, and the list includes a small number of known or candidate edge-on disks, which are labelled in Table A.1. Most of them have spectral slopes
m feature in absorption, and the list includes a small number of known or candidate edge-on disks, which are labelled in Table A.1. Most of them have spectral slopes ![]() between 2 and 24
between 2 and 24 ![]() m > 0.
The vast majority of class 0 and I sources in the c2d sample were found to have luminosities of
m > 0.
The vast majority of class 0 and I sources in the c2d sample were found to have luminosities of
![]()
![]() (Evans et al. 2008) indicative of low mass young stars and consistent with the observational fact that the majority of the young stars in the regions studied by c2d are K- and M-type stars (Luhman 2007; Oliveira et al. 2008). The reduction of the Spitzer spectroscopy was performed using the optimal PSF extraction technique developed within the c2d program, to allow separation of the compact source and extended emission components (Lahuis et al. 2007). The source size is determined from the width of the PSF function fitted to the source, compared to the width of the PSF function fit for standard calibrator stars. Comparison of the optimal PSF extraction and the full aperture extraction provides a direct estimate of any potential extended emission. An application of the same technique to remove background PAH features has been given for the source VSSG 1 in Geers et al. (2006, see their Fig. 4).
The details of the observations and reduction procedures are described in Lahuis et al. (2006) and Lahuis (2007, thesis Chap. 3).
(Evans et al. 2008) indicative of low mass young stars and consistent with the observational fact that the majority of the young stars in the regions studied by c2d are K- and M-type stars (Luhman 2007; Oliveira et al. 2008). The reduction of the Spitzer spectroscopy was performed using the optimal PSF extraction technique developed within the c2d program, to allow separation of the compact source and extended emission components (Lahuis et al. 2007). The source size is determined from the width of the PSF function fitted to the source, compared to the width of the PSF function fit for standard calibrator stars. Comparison of the optimal PSF extraction and the full aperture extraction provides a direct estimate of any potential extended emission. An application of the same technique to remove background PAH features has been given for the source VSSG 1 in Geers et al. (2006, see their Fig. 4).
The details of the observations and reduction procedures are described in Lahuis et al. (2006) and Lahuis (2007, thesis Chap. 3).
In total, the sample contains 80 sources, for which 12 sources were observed with both ISAAC and Spitzer. Based on new 2MASS-Spitzer-MIPS 2-24 ![]() m spectral slopes and/or sub-mm line and continuum data, as well as CO 4.7
m spectral slopes and/or sub-mm line and continuum data, as well as CO 4.7 ![]() m spectroscopy, the classification has been refined (Enoch et al. 2008; van Kempen 2008; van Kempen et al. 2008; Jørgensen et al. 2008, Pontoppidan priv. comm.). These updates have confirmed 53 embedded sources and 17 sources to be disk sources, while for
10 sources the classification remains uncertain (Table A.1).
m spectroscopy, the classification has been refined (Enoch et al. 2008; van Kempen 2008; van Kempen et al. 2008; Jørgensen et al. 2008, Pontoppidan priv. comm.). These updates have confirmed 53 embedded sources and 17 sources to be disk sources, while for
10 sources the classification remains uncertain (Table A.1).
3 Results and discussion
3.1 VLT-ISAAC spectra
The VLT-ISAAC L-band spectra are presented in Fig. 1.
Only 1 source in this sample shows a clear 3.3 ![]() m PAH emission feature, IRS 48. This source is known to have a spatially resolved disk surrounded by a very tenuous envelope at most (Geers et al. 2007a). No clear PAH feature is seen toward any of the other sources.
To derive upper limits, a Gaussian with a peak flux equal to the 3
m PAH emission feature, IRS 48. This source is known to have a spatially resolved disk surrounded by a very tenuous envelope at most (Geers et al. 2007a). No clear PAH feature is seen toward any of the other sources.
To derive upper limits, a Gaussian with a peak flux equal to the 3![]() noise and
noise and
![]()
![]() m is generated and integrated to retrieve the line flux of the largest PAH 3.3
m is generated and integrated to retrieve the line flux of the largest PAH 3.3 ![]() m feature that would still fall within the noise. The results are listed in Table A.1.
m feature that would still fall within the noise. The results are listed in Table A.1.
The hydrogen Pf ![]() (3.296
(3.296 ![]() m), Pf
m), Pf ![]() (3.739
(3.739 ![]() m) and Br
m) and Br ![]() (4.051
(4.051 ![]() m) are detected toward most sources, with the exception of IRAS 11068-7717 and Cha IRN. These lines are believed to be produced in the accretion column onto the central star (Calvet & Gullbring 1998), and/or in the wind launched close to the star (Kraus et al. 2008). The broad absorption features by water ice (2.8
m) are detected toward most sources, with the exception of IRAS 11068-7717 and Cha IRN. These lines are believed to be produced in the accretion column onto the central star (Calvet & Gullbring 1998), and/or in the wind launched close to the star (Kraus et al. 2008). The broad absorption features by water ice (2.8 ![]() m) and the 3.47
m) and the 3.47 ![]() m ice feature can be clearly seen toward the majority of the sources.
m ice feature can be clearly seen toward the majority of the sources.
![\begin{figure}
\par\includegraphics[width=8cm]{1001fg01.ps}
\end{figure}](/articles/aa/full_html/2009/09/aa11001-08/img24.gif) |
Figure 1:
ISAAC L-band spectra of low-mass embedded sources. The narrow HI lines at 3.3, 3.74 and 4.05 |
| Open with DEXTER | |
3.2 Spitzer spectra
Out of the sample of 53 sources, 50 do not show any PAH features. A selection of Spitzer spectra with PAH non-detections is presented in Fig. 2. Silicate, water and CO2 absorption are the predominant features in these spectra. These have been analyzed by Boogert et al. (2008) and Pontoppidan et al. (2008).
![\begin{figure}
\par\includegraphics[width=8cm]{1001fg02.ps}
\end{figure}](/articles/aa/full_html/2009/09/aa11001-08/img25.gif) |
Figure 2:
Spitzer IRS spectra of a sample of low-mass embedded sources without PAH detections. For clarity, the spectra are normalized to their flux at 17 |
| Open with DEXTER | |
For one Spitzer source, Oph GY 23, the optimal extraction method produces an
SH spectrum with the observed 11.2 ![]() m PAH features, shown in Fig. 3.
A small size is derived for this source, suggesting that the PAH emission is directly associated with the star. The classification of this source remains uncertain. Based on Spitzer IRS, IRAC and MIPS fluxes, Oph GY 23, previously classified as class I, shows a declining SED suggestive of a class II source. However, Oph GY 23 is surrounded by reflection nebulosity and deep hot CO gas absorption features have been observed towards this source (Pontoppidan, priv. comm.), hinting at the presence of remnant envelope material.
m PAH features, shown in Fig. 3.
A small size is derived for this source, suggesting that the PAH emission is directly associated with the star. The classification of this source remains uncertain. Based on Spitzer IRS, IRAC and MIPS fluxes, Oph GY 23, previously classified as class I, shows a declining SED suggestive of a class II source. However, Oph GY 23 is surrounded by reflection nebulosity and deep hot CO gas absorption features have been observed towards this source (Pontoppidan, priv. comm.), hinting at the presence of remnant envelope material.
For two sources, VSSG 1 and IRS 14 in Ophiuchus, PAH features are detected from the extended background emission, which is assumed not to be directly associated with a central object.
Overall, no PAHs are detected toward any of the 53 confirmed embedded sources. PAHs are detected towards one of the 17 confirmed disk sources, IRS 48, and one out of the 10 sources with an uncertain classification, Oph GY 23.
![\begin{figure}
\par\includegraphics[width=8cm]{1001fg03.ps}
\end{figure}](/articles/aa/full_html/2009/09/aa11001-08/img26.gif) |
Figure 3: Spitzer IRS spectra of Oph GY 23, a low-mass borderline embedded source with a PAH detection. |
| Open with DEXTER | |
4 Radiative transfer model
Here we address the question of where the PAH emission can arise in a disk + envelope system through radiative transfer modeling and what the non-detections imply quantitatively about the PAH abundance.
4.1 Physical structure
We use the two-dimensional axisymmetric radiative transfer code RADMC (Dullemond & Dominik 2004) to calculate the temperature structure and scattering source function for an embedded YSO using a Monte Carlo technique. This code requires stellar parameters, a stellar radiation field, a density structure and a set of dust opacities. Scattering is assumed to be isotropic. A module to treat the emission from quantum-heated PAH molecules and Very Small Grains, previously described in Geers et al. (2006), has been included. To generate images and spectra, ray-tracing is performed using RADICAL (Dullemond & Turolla 2000). All spectra and SEDs presented here are scaled to a distance to the observer of 150 pc.
The density structure adopted here follows Crapsi et al. (2008) and is comprised of three components: the disk, the envelope and the outflow cone. The adopted density structure for the disk has a power-law dependence along the radial coordinate and a Gaussian dependence in height, and can be expressed as
![\begin{displaymath}\rho_{{\rm disk}}(r,\theta) = \frac{\Sigma_{0} (r/R_{0})^{-1}...
...{1}{2} \left [\frac{r \cos \theta}{H(r)}\right ]^{2}\right \},
\end{displaymath}](/articles/aa/full_html/2009/09/aa11001-08/img27.gif)
where
Table 1: Parameters of the template model.
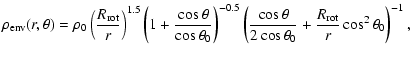
The envelope density follows the theoretical structure for a rotating and collapsing spheroid as derived by Ulrich (1976), defined by
 |
where
For the radiation field, a blackbody spectrum is taken with
![]() K and a luminosity of 1
K and a luminosity of 1 ![]() for the template model. In addition, given the strong dependence of PAHs on UV excitation and observations indicating the presence of UV excess around actively accreting young low-mass PMS stars (Hartmann & Kenyon 1990; Basri & Bertout 1989), the radiation field for
for the template model. In addition, given the strong dependence of PAHs on UV excitation and observations indicating the presence of UV excess around actively accreting young low-mass PMS stars (Hartmann & Kenyon 1990; Basri & Bertout 1989), the radiation field for
![]()
![]() m is substituted by a modified Draine field (van Dishoeck & Black 1982), scaled up to ensure continuous overlap at
m is substituted by a modified Draine field (van Dishoeck & Black 1982), scaled up to ensure continuous overlap at
![]()
![]() m. The resulting spectrum is normalized to a luminosity of 1
m. The resulting spectrum is normalized to a luminosity of 1 ![]() .
For comparison, a separate model is run without the modified radiation field. Any radiation field produced by a higher mass (A-type) star would be in between these two extremes. The excess Draine UV field corresponds to an intensity relative to the mean interstellar radiation field, G0, of
.
For comparison, a separate model is run without the modified radiation field. Any radiation field produced by a higher mass (A-type) star would be in between these two extremes. The excess Draine UV field corresponds to an intensity relative to the mean interstellar radiation field, G0, of
![]() at a radius of 100 AU at the surface of the disk.
at a radius of 100 AU at the surface of the disk.
4.2 Treatment of dust and PAHs
For the optical properties of the dust grain population, we adopt the set of dust mixtures and opacities used in Crapsi et al. (2008): a mixture of 71% silicates with a size distribution similar to that of Weingartner & Draine (2001) with the
![]() -parameter equal to -2 and turnover point for radii larger than 0.3
-parameter equal to -2 and turnover point for radii larger than 0.3 ![]() m covered by a mantle of ices with a water ice abundance of
m covered by a mantle of ices with a water ice abundance of
![]() relative to H2, together with 29% carbonaceous grains with a size distribution similar to that of Weingartner & Draine (2001), characterized by a turnover point at radius of 4.5
relative to H2, together with 29% carbonaceous grains with a size distribution similar to that of Weingartner & Draine (2001), characterized by a turnover point at radius of 4.5 ![]() m, an
m, an
![]() -parameter of -2 and a water ice abundance of
-parameter of -2 and a water ice abundance of
![]() relative to H2. A second dust population is added without the ice layer, for regions where the temperature is higher than 90 K, when ices will have evaporated. These are included by running the
Monte Carlo code once with ices in the whole grid to calculate the temperature structure, and then using this information to replace the dust opacities where the temperature is higher than 90 K. The ice features include H2O, CO2 and CO, but not more complex species which could be responsible for (part of) the observed 6.0 and
6.8
relative to H2. A second dust population is added without the ice layer, for regions where the temperature is higher than 90 K, when ices will have evaporated. These are included by running the
Monte Carlo code once with ices in the whole grid to calculate the temperature structure, and then using this information to replace the dust opacities where the temperature is higher than 90 K. The ice features include H2O, CO2 and CO, but not more complex species which could be responsible for (part of) the observed 6.0 and
6.8 ![]() m ice features (Boogert et al. 2008).
m ice features (Boogert et al. 2008).
PAHs are added as a dust species to the disk and the envelope. The PAH emission is calculated for an equal mix of neutral and singly ionized C100H24 molecules, adopting the
Draine & Li (2001) PAH emission model, using the ``thermal continuous''
approximation. Multi-photon events are included for the PAH
excitation, following the method outlined by
Siebenmorgen et al. (1992).
We include the opacities from Mattioda et al. (2005) for near-infrared wavelengths. Model calculations by Visser et al. (2007) show that PAHs with
![]() have longer lifetimes than the lifetime of the disk, and we can therefore safely discard the possibility of PAH destruction and keep the PAHs at constant abundance throughout the entire disk.
have longer lifetimes than the lifetime of the disk, and we can therefore safely discard the possibility of PAH destruction and keep the PAHs at constant abundance throughout the entire disk.
In our template model, the total PAH abundance is the same as used in Geers et al. (2006), as a mass fraction of the dust of 0.061, which corresponds to a carbon abundance of
![]() with respect to hydrogen and a
with respect to hydrogen and a
![]() PAH abundance of
PAH abundance of
![]() with respect to hydrogen. This PAH abundance is divided into 50% ionized and 50% neutral PAHs, the same as in our previous disk-only models (Geers et al. 2006,2007b).
with respect to hydrogen. This PAH abundance is divided into 50% ionized and 50% neutral PAHs, the same as in our previous disk-only models (Geers et al. 2006,2007b).
A spectrum of the template model, with and without PAHs, is shown in
Fig. 4. The main features in the spectrum are the PAH features at 3.3, 6.2, 7.7, 8.6, 11.2 and 12.7 ![]() m, as well as water, CO, silicate and CO2 ice absorption features at 3.08, 4.67, 9.7 and 15.2
m, as well as water, CO, silicate and CO2 ice absorption features at 3.08, 4.67, 9.7 and 15.2 ![]() m respectively. The wavelength coverage of the ISAAC L-band and Spitzer IRS spectroscopy is indicated.
m respectively. The wavelength coverage of the ISAAC L-band and Spitzer IRS spectroscopy is indicated.
![\begin{figure}
\par\includegraphics[width=8cm,clip]{1001fg04.ps}
\end{figure}](/articles/aa/full_html/2009/09/aa11001-08/img57.gif) |
Figure 4:
Model spectra at
|
| Open with DEXTER | |
4.3 Modeling results
The apparent absence of PAH features toward the majority of low-mass embedded class I sources could have a number of explanations.First, PAH molecules are primarily excited by UV photons. The precise shape and strength of the radiation field inside an embedded object is not well-known but in the class I sources the central source has already formed and is the main energy source inside the envelope. The presence or absence of excess UV will influence the PAH emission features. In particular, the high opacity of the envelope at UV and optical wavelengths, which provide the main excitation of PAHs, will constrain the region where PAHs can be excited to a small radius.
Second, even if the infrared PAH features are produced in the disk or inner envelope close to the star, the dust in the surrounding envelope may provide too high extinction in the optical and mid-infrared for the (PAH) emission to escape, especially if the envelope mass is (still) relatively high compared to the disk. If an outflow cavity is present, the inclination at which the object is observed will affect the extinction by the envelope.
Third, the abundance of small PAH molecules in the gas phase may be significantly lower due to freeze-out due to the low temperatures and high densities in the interior of the molecular core.
In practice, a combination of the above three causes will apply simultaneously. To estimate their effects, models are run, varying several parameters including radiation field, PAH abundance and the mass of the envelope.
4.3.1 Luminosity of the central source and presence of UV excess
Models with total stellar luminosity L* varying between 1, 3 and 6 ![]() are shown in Fig. 5. In addition, a model without the Draine field for UV excess is shown for L* = 6
are shown in Fig. 5. In addition, a model without the Draine field for UV excess is shown for L* = 6 ![]() .
.
![\begin{figure}
\par\includegraphics[width=8cm]{1001fg05.ps}
\includegraphics[width=8cm]{1001fg06.ps}
\end{figure}](/articles/aa/full_html/2009/09/aa11001-08/img58.gif) |
Figure 5:
Model SEDs ( top) and blow-up of spectra ( bottom) at
|
| Open with DEXTER | |
4.3.2 Mass of the envelope
![\begin{figure}
\par\includegraphics[width=7.8cm]{1001fg07.ps}
\includegraphics[width=7.8cm]{1001fg08.ps}
\end{figure}](/articles/aa/full_html/2009/09/aa11001-08/img59.gif) |
Figure 6:
Model SEDs ( top) and blow-up of spectra ( bottom) with
|
| Open with DEXTER | |
![\begin{figure}
\par\includegraphics[width=8.8cm]{1001fg09.ps}
\includegraphics[width=8.8cm]{1001fg10.ps}
\end{figure}](/articles/aa/full_html/2009/09/aa11001-08/img60.gif) |
Figure 7:
Model SEDs ( top) and blow-up of spectra ( bottom) with PAHs in both envelope and disk (black), only in the disk (red) and only in the envelope (blue), at i = 45 |
| Open with DEXTER | |
4.3.3 Outflow cavity and inclination
![\begin{figure}
\par\includegraphics[width=8.3cm]{1001fg11.ps}
\includegraphics[width=8.3cm]{1001fg12.ps}
\end{figure}](/articles/aa/full_html/2009/09/aa11001-08/img61.gif) |
Figure 8:
Model SEDs ( top) and blow-up of spectra ( bottom) for i = 5, 25, 45, 65 and 85 |
| Open with DEXTER | |
A template model with the template PAH abundance and an envelope mass of
1.0 ![]() seen at varying inclination angles between 5 and 85
seen at varying inclination angles between 5 and 85![]() is shown in Fig. 8.
At an inclination of i=5
is shown in Fig. 8.
At an inclination of i=5![]() the stellar radiation field (blackbody + scaled Draine field) is directly visible and no absorption features are present. Between inclinations of 5
the stellar radiation field (blackbody + scaled Draine field) is directly visible and no absorption features are present. Between inclinations of 5![]() and 25
and 25![]() ,
i.e., down the cavity and through the envelope, the appearance of the SED and the PAH features changes rapidly (e.g., Crapsi et al. 2008; Whitney et al. 2003). The emission of the central star becomes obscured and the strength of the PAH features decreases by about a factor of 2. At increasing inclination the PAH features become weaker, but still dominate the spectrum. Ice absorption features can be seen at 3, 4.2, 6 and 15
,
i.e., down the cavity and through the envelope, the appearance of the SED and the PAH features changes rapidly (e.g., Crapsi et al. 2008; Whitney et al. 2003). The emission of the central star becomes obscured and the strength of the PAH features decreases by about a factor of 2. At increasing inclination the PAH features become weaker, but still dominate the spectrum. Ice absorption features can be seen at 3, 4.2, 6 and 15 ![]() m.
At 85
m.
At 85![]() ,
the disk is observed almost edge-on and the PAH emitting regions are largely masked by the disk itself. The remaining features in the spectrum extracted for an infinitely large aperture are due to scattered emission, originating from higher up in the disk atmosphere. Observed PAH feature strengths will depend on the pointing and orientation of the limited aperture slit on the embedded source.
,
the disk is observed almost edge-on and the PAH emitting regions are largely masked by the disk itself. The remaining features in the spectrum extracted for an infinitely large aperture are due to scattered emission, originating from higher up in the disk atmosphere. Observed PAH feature strengths will depend on the pointing and orientation of the limited aperture slit on the embedded source.
4.3.4 PAH abundance
![\begin{figure}
\par\includegraphics[width=8.3cm]{1001fg13.ps}
\includegraphics[width=8.3cm]{1001fg14.ps}
\end{figure}](/articles/aa/full_html/2009/09/aa11001-08/img62.gif) |
Figure 9:
Model SEDs ( top) and blow-up of spectra ( bottom) with template PAH abundance (black), and factors of 10 (red), 20 (purple) and 100 lower (blue) at i = 45 |
| Open with DEXTER | |
4.4 Summary and caveats
We find in all models that the 7.7 ![]() m feature is noticeably the strongest PAH feature, with the highest feature to continuum ratio. This is in sharp contrast with observational and modeling results for non-embedded class II stars with disks, where the silicate emission feature largely obscures the contribution of the 7.7 and 8.6
m feature is noticeably the strongest PAH feature, with the highest feature to continuum ratio. This is in sharp contrast with observational and modeling results for non-embedded class II stars with disks, where the silicate emission feature largely obscures the contribution of the 7.7 and 8.6 ![]() m features. There is no readily visible 7.7
m features. There is no readily visible 7.7 ![]() m PAH feature in our observations. Increasing the envelope mass and decreasing PAH abundance, luminosity or UV excess all lead to weaker PAH features. The inclination has the largest influence on the PAH feature strength in the range of inclinations where the line-of-sight passes from through the envelope to through the outflow cavity. Strong PAH features are predicted to occur when observing down the outflow cavity. This situation can be recognized by a strong UV and optical part of the SED, as well as a lack of absorption features. For typical values for the luminosity, UV excess, inclination and envelope mass, derived from observational studies of embedded protostars, and assuming an ISM abundance, the PAH features should be detectable. The low detection rate of PAHs toward these sources thus suggests that the abundance of PAHs is at least 20-50x lower than in the ISM. Decreasing luminosity, UV excess or envelope mass compared with the template model changes this conclusion to a typical factor of 10-20, compared with the ISM abundance.
m PAH feature in our observations. Increasing the envelope mass and decreasing PAH abundance, luminosity or UV excess all lead to weaker PAH features. The inclination has the largest influence on the PAH feature strength in the range of inclinations where the line-of-sight passes from through the envelope to through the outflow cavity. Strong PAH features are predicted to occur when observing down the outflow cavity. This situation can be recognized by a strong UV and optical part of the SED, as well as a lack of absorption features. For typical values for the luminosity, UV excess, inclination and envelope mass, derived from observational studies of embedded protostars, and assuming an ISM abundance, the PAH features should be detectable. The low detection rate of PAHs toward these sources thus suggests that the abundance of PAHs is at least 20-50x lower than in the ISM. Decreasing luminosity, UV excess or envelope mass compared with the template model changes this conclusion to a typical factor of 10-20, compared with the ISM abundance.
One caveat remains with respect to the effect of scattering. The radiative transfer code used here assumes all scattering to be isotropic. This does not allow us to treat the effect of preferentially forward scattering of UV radiation through the outflow cavity. In the current implementation, our models could overestimate the amount of radiation received by the disk as well as overestimate the strength of the PAH features. Thus, our inferred abundance limits are on the low side. As a second caveat, an external interstellar radiation field is not included in these models. Interstellar UV radiation from outside the embedded object may become a significant source of excitation for PAHs in the envelope at large radii and would increase the predicted PAH feature strength and thus constrain the PAH abundance upper limits to smaller values, going in opposite directions.
4.5 PAH evolution from clouds to disks
In both class I and II low-mass objects that we have studied, we find very low detection rates for PAHs.
Comparison with model predictions suggest that for typical conditions in class I protostars, the absence of exciting radiation and attenuation by foreground material can be excluded as reason for the absence of the PAH features. In addition, the predicted feature/continuum ratio is well within the achieved sensitivity of the observations. This thus implies an absence of carrier as the reason the for absence of features, and the PAH abundance in the embedded protostar phase is estimated here to be at least a factor of 10-20 times lower than for typical (number of carbon atoms
![]() )
PAHs in the ISM. This lower abundance is in the same range as those inferred toward T Tauri stars in Geers et al. (2006). Thus, even though the detection rate in the Class I objects is even lower than that found toward disks, the inferred abundances are comparable. Note that the few Class II disks in which we detect PAHs are mostly G-stars. The disk sample in Geers et al. (2006) is more biased toward higher mass stars.
)
PAHs in the ISM. This lower abundance is in the same range as those inferred toward T Tauri stars in Geers et al. (2006). Thus, even though the detection rate in the Class I objects is even lower than that found toward disks, the inferred abundances are comparable. Note that the few Class II disks in which we detect PAHs are mostly G-stars. The disk sample in Geers et al. (2006) is more biased toward higher mass stars.
What would cause this lower abundance in the embedded phase, and is this mechanism the same in the class II phase? In a cold dense environment, two possibilities for lowering the abundance of a species are recognized: coagulation or dust growth and freeze-out onto larger grains.
The freeze-out of PAHs onto grains could explain the lower PAH abundance in these objects. PAH features in absorption have been observed in the ISM, and laboratory spectra of PAHs condensed into H2O rich ices suggest that PAH absorption features should also be observable in astrophysical ices, such as in dense clouds (Bernstein et al. 2007, and references therein). During this phase, if exposed to
UV radiation, PAHs in water ice can become significantly ionized, thus promoting ion-mediated reactions in these ices with implications for astrochemistry (Gudipati & Allamandola 2006; Ehrenfreund et al. 2006). In the class II phase, the direct irradiation of the disk by the central star can increase the temperature in the surface layers of the disk, evaporating the ice and depositing the enclosed PAHs back into the gas, thereby increasing the abundance of the PAHs again. Recent observations of edge-on disks show evidence for the continued presence of a reservoir of ice in the interior of disks (Pontoppidan et al. 2005; Terada et al. 2007) which can be brought to the surface by vertical mixing. If the PAHs in the ices react to form larger carbonaceous materials, then only a fraction of PAHs might come back off the grain when the ice layer evaporates. This could be a possible explanation for the low PAH abundance inferred for the majority of T Tauri disk surface layers.
In a study of the ice features of the same c2d sample of embedded sources, Boogert et al. (2008) show spectra over the 5-10 ![]() m range where absorptions due to PAHs in ices occur. No obvious features are detected, but the laboratory spectroscopy is not well known and some PAH bands could be hidden in the 6
m range where absorptions due to PAHs in ices occur. No obvious features are detected, but the laboratory spectroscopy is not well known and some PAH bands could be hidden in the 6 ![]() m complex, especially on the long wavelength side of the C2 component in Boogert et al. (2008). Assuming a typical (but uncertain) oscillator strength for PAHs, up to 10% of the carbon could be locked up in PAHs in the ices (Boogert, priv. comm.). These limits are consistent with the amount of freeze-out found in this work.
m complex, especially on the long wavelength side of the C2 component in Boogert et al. (2008). Assuming a typical (but uncertain) oscillator strength for PAHs, up to 10% of the carbon could be locked up in PAHs in the ices (Boogert, priv. comm.). These limits are consistent with the amount of freeze-out found in this work.
PAHs growing and/or agglomerating to typically 100x larger particles could be an alternative explanation for the lower PAH abundance. This process could take place in the high density regions of the disk and envelope, in both the class I and II phase, and does not exclude freeze-out as an option. Observationally, the presence of broad emission plateaus between 6-9, 11-13 and 15-20 ![]() m has been attributed to large 200-2000 carbon atom PAHs and PAH clusters (Van Kerckhoven et al. 2000; Allamandola et al. 1989), which will lose their characteristic PAH emission features, thus additionally lowering the feature/continuum of these features. The detection of individual features toward T Tauri disks shows that this process is not necessarily dominant, and that either small PAHs are still released from the ice in this phase and/or that small PAHs are still being created from, e.g., the destruction of larger grains or agglomerates through collisions.
m has been attributed to large 200-2000 carbon atom PAHs and PAH clusters (Van Kerckhoven et al. 2000; Allamandola et al. 1989), which will lose their characteristic PAH emission features, thus additionally lowering the feature/continuum of these features. The detection of individual features toward T Tauri disks shows that this process is not necessarily dominant, and that either small PAHs are still released from the ice in this phase and/or that small PAHs are still being created from, e.g., the destruction of larger grains or agglomerates through collisions.
5 Conclusions
No PAHs are detected toward any of the 53 confirmed embedded sources in either our Spitzer or ISAAC surveys. PAHs are detected at 3.3 ![]() m towards 1 of the
17 confirmed disk sources, IRS 48, and at 11.2
m towards 1 of the
17 confirmed disk sources, IRS 48, and at 11.2 ![]() m for 1 of the
10 sources with an uncertain or borderline embedded classification, Oph GY 23.
For all 12 sources with ISAAC and Spitzer spectra, no PAH features are detected in either. In total, PAH features are detected toward at most 1 out of 63 (candidate) embedded protostars (1.6%), even lower than observed for class II T Tauri stars with disks (11-14%).
m for 1 of the
10 sources with an uncertain or borderline embedded classification, Oph GY 23.
For all 12 sources with ISAAC and Spitzer spectra, no PAH features are detected in either. In total, PAH features are detected toward at most 1 out of 63 (candidate) embedded protostars (1.6%), even lower than observed for class II T Tauri stars with disks (11-14%).
The low PAH detection rate is compared with radiative transfer model calculations. It is shown that the effects of envelope mass on the absorption of PAH features is not enough to obscure PAH features. The 7.7 ![]() m feature is predicted by models as the best tracer of PAH emission, while the 3.3
m feature is predicted by models as the best tracer of PAH emission, while the 3.3 ![]() m feature is relatively weak.
m feature is relatively weak.
Assuming typical class I stellar and envelope parameters, the absence of PAH emission is most likely explained by the absence of emitting carriers through a much lower PAH abundance in the gas, e.g., due to freeze-out of PAHs on icy layers on dust grains or agglomeration. Our inferred low abundances are similar to those found for disks around T Tauri stars. Thus PAHs are expected to be removed from the gas at earlier stages of star- and planet formation and enter the disks frozen out on grains. Further searches for PAH absorption features are needed to constrain the presence of PAHs in icy grains.
Acknowledgements
The authors thank R. Visser for his models and comments. Support for this work, part of the Spitzer Legacy Science Program, was provided by NASA through contracts 1224608, 1230779 and 1256316 issued by the Jet Propulsion Laboratory, California Institute of Technology, under NASA contract 1407. A.C. was supported by a fellowship from the European Research Training Network ``The Origin of Planetary Systems'' (PLANETS, contract number HPRN-CT-2002-00308) at Leiden Observatory and by a Marie Curie Intra-European Fellowship from the European Community (contract number FP6-024227) at Observatorio Astronómico Nacional. Astrochemistry in Leiden is supported by a NWO Spinoza grant and a NOVA grant.
Appendix A: Table: summary of observations
Table A.1: Summary of observations. Line flux in W m-2.
References
- Acke, B., & van den Ancker, M. E. 2004, A&A, 426, 151 [NASA ADS] [CrossRef] [EDP Sciences] (In the text)
- Allamandola, L. J., Tielens, G. G. M., & Barker, J. R. 1989, ApJS, 71, 733 [NASA ADS] [CrossRef]
- Arce, H. G., & Sargent, A. I. 2006, ApJ, 646, 1070 [NASA ADS] [CrossRef]
- Basri, G., & Bertout, C. 1989, ApJ, 341, 340 [NASA ADS] [CrossRef]
- Bernstein, M. P., Sandford, S. A., Allamandola, L. J., et al. 1999, Science, 283, 1135 [NASA ADS] [CrossRef]
- Bernstein, M. P., Sandford, S. A., Mattioda, A. L., & Allamandola, L. J. 2007, ApJ, 664, 1264 [NASA ADS] [CrossRef] (In the text)
- Boogert, A. C. A., Pontoppidan, K. M., Knez, C., et al. 2008, ApJ, 678, 985 [NASA ADS] [CrossRef] (In the text)
- Calvet, N., & Gullbring, E. 1998, ApJ, 509, 802 [NASA ADS] [CrossRef] (In the text)
- Chiang, E. I., & Goldreich, P. 1997, ApJ, 490, 368 [NASA ADS] [CrossRef] (In the text)
- Crapsi, A., van Dishoeck, E. F., Hogerheijde, M. R., Pontoppidan, K. M., & Dullemond, C. P. 2008, A&A, 486, 245 [NASA ADS] [CrossRef] [EDP Sciences] (In the text)
- Draine, B. T., & Li, A. 2001, ApJ, 551, 807 [NASA ADS] [CrossRef] (In the text)
- Dullemond, C. P., & Dominik, C. 2004, A&A, 417, 159 [NASA ADS] [CrossRef] [EDP Sciences] (In the text)
- Dullemond, C. P., & Turolla, R. 2000, A&A, 360, 1187 [NASA ADS] (In the text)
- Ehrenfreund, P., Rasmussen, S., Cleaves, J., & Chen, L. 2006, Astrobiology, 6, 490 [NASA ADS] [CrossRef]
- Enoch, M. L., Evans, II, N. J., Sargent, A. I., et al. 2008, ApJ, accepted, [arXiv/0805.1075]
- Evans, II, N. J., Allen, L. E., Blake, G. A., et al. 2003, PASP, 115, 965 [NASA ADS] [CrossRef] (In the text)
- Evans, II, N. J., Dunham, M. M., Jørgensen, J. K., et al. 2008, ApJ in press [arXiv:0811.1059] (In the text)
- Geers, V. C. 2007, Ph.D. in Astronomy, Leiden Observatory - Leiden University, PO Box 9513, 2300 (RA Leiden, The Netherlands) (In the text)
- Geers, V. C., Augereau, J.-C., Pontoppidan, K. M., et al. 2006, A&A, 459, 545 [NASA ADS] [CrossRef] [EDP Sciences] (In the text)
- Geers, V. C., Pontoppidan, K. M., van Dishoeck, E. F., et al. 2007a, A&A, 469, L35 [NASA ADS] [CrossRef] [EDP Sciences]
- Geers, V. C., van Dishoeck, E. F., Visser, R., et al. 2007b, A&A, 476, 279 [NASA ADS] [CrossRef] [EDP Sciences]
- Gudipati, M. S., & Allamandola, L. J. 2006, ApJ, 638, 286 [NASA ADS] [CrossRef]
- Habart, E., Natta, A., & Krügel, E. 2004, A&A, 427, 179 [NASA ADS] [CrossRef] [EDP Sciences] (In the text)
- Habart, E., Natta, A., Testi, L., & Carbillet, M. 2006, A&A, 449, 1067 [NASA ADS] [CrossRef] [EDP Sciences]
- Hartmann, L. W., & Kenyon, S. J. 1990, ApJ, 349, 190 [NASA ADS] [CrossRef]
- Helling, C., Jorgensen, U. G., Plez, B., & Johnson, H. R. 1996, A&A, 315, 194 [NASA ADS] (In the text)
- Hogerheijde, M. R., van Dishoeck, E. F., Blake, G. A., & van Langevelde, H. J. 1998, ApJ, 502, 315 [NASA ADS] [CrossRef]
- Jonkheid, B., Kamp, I., Augereau, J.-C., & van Dishoeck, E. F. 2006, A&A, 453, 163 [NASA ADS] [CrossRef] [EDP Sciences] (In the text)
- Jørgensen, J. K., Johnstone, D., Kirk, H., et al. 2008, ApJ, 683, 822 [NASA ADS] [CrossRef]
- Kraus, S., Hofmann, K.-H., Benisty, M., et al. 2008, A&A, 489, 1157 [NASA ADS] [CrossRef] [EDP Sciences] (In the text)
- Lahuis, F., Kessler-Silacci, J. E., Evans, II, N. J., et al. 2006, c2d Spectroscopy Explanatory Supplement (Pasadena: Spitzer Science Center) (In the text)
- Lahuis, F., van Dishoeck, E. F., Blake, G. A., et al. 2007, ApJ, 665, 492 [NASA ADS] [CrossRef] (In the text)
- Luhman, K. L. 2007, ApJS, 173, 104 [NASA ADS] [CrossRef]
- Manske, V., & Henning, T. 1999, A&A, 349, 907 (In the text)
- Mattioda, A. L., Hudgins, D. M., & Allamandola, L. J. 2005, ApJ, 629, 1188 [NASA ADS] [CrossRef] (In the text)
- Oliveira, I., Merín, B., Pontoppidan, K. M., et al. 2008, ApJ, in press [arXiv:0810.0829]
- Peeters, E., Hony, S., Van Kerckhoven, C., et al. 2002, A&A, 390, 1089 [NASA ADS] [CrossRef] [EDP Sciences]
- Pontoppidan, K. M., Fraser, H. J., Dartois, E., et al. 2003, A&A, 408, 981 [NASA ADS] [CrossRef] [EDP Sciences] (In the text)
- Pontoppidan, K. M., Dullemond, C. P., van Dishoeck, E. F., et al. 2005, ApJ, 622, 463 [NASA ADS] [CrossRef]
- Pontoppidan, K. M., Boogert, A. C. A., Fraser, H. J., et al. 2008, ApJ, 678, 1005 [NASA ADS] [CrossRef] (In the text)
- Ressler, M. E., & Barsony, M. 2003, ApJ, 584, 832 [NASA ADS] [CrossRef]
- Siebenmorgen, R., Kruegel, E., & Mathis, J. S. 1992, A&A, 266, 501 [NASA ADS] (In the text)
- Terada, H., Tokunaga, A. T., Kobayashi, N., et al. 2007, ApJ, 667, 303 [NASA ADS] [CrossRef]
- Thi, W.-F., van Dishoeck, E. F., Dartois, E., et al. 2006, A&A, 449, 251 [NASA ADS] [CrossRef] [EDP Sciences] (In the text)
- Ulrich, R. K. 1976, ApJ, 210, 377 [NASA ADS] [CrossRef] (In the text)
- van Dishoeck, E. F., & Black, J. H. 1982, ApJ, 258, 533 [NASA ADS] [CrossRef] (In the text)
- van Dishoeck, E. F., & van der Tak, F. F. S. 2000, From Molecular Clouds to Planetary Systems, ed. Y. C. Minh, & E. F. van Dishoeck (San Francisco: ASP), IAU Symp., 197, 97 (In the text)
- van Dishoeck, E. F., Dartois, E., Pontoppidan, K. M., et al. 2003, The Messenger, 113, 49 [NASA ADS] (In the text)
- van Kempen, T. A. 2008, Ph.D. in Astronomy, Leiden Observatory - Leiden University, PO Box 9513, 2300 RA Leiden, The Netherlands
- van Kempen, T. A., van Dishoeck, E. F., Salter, D. M., et al. 2008, A&A, submitted
- Van Kerckhoven, C., Hony, S., Peeters, E., et al. 2000, A&A, 357, 1013 [NASA ADS]
- Verstraete, L., Puget, J. L., Falgarone, E., et al. 1996, A&A, 315, L337 [NASA ADS] (In the text)
- Visser, R., Geers, V. C., Dullemond, C. P., et al. 2007, A&A, 466, 229 [NASA ADS] [CrossRef] [EDP Sciences] (In the text)
- Weingartner, J. C., & Draine, B. T. 2001, ApJ, 548, 296 [NASA ADS] [CrossRef] (In the text)
- Whitney, B. A., Wood, K., Bjorkman, J. E., & Wolff, M. J. 2003, ApJ, 591, 1049 [NASA ADS] [CrossRef]
Footnotes
- ... objects
- Based on observations obtained at the European Southern Observatory, Paranal, Chile, within the observing program 164.I-0605 (VLT-ISAAC).
All Tables
Table 1: Parameters of the template model.
Table A.1: Summary of observations. Line flux in W m-2.
All Figures
| |
Figure 1:
ISAAC L-band spectra of low-mass embedded sources. The narrow HI lines at 3.3, 3.74 and 4.05 |
| Open with DEXTER | |
| In the text | |
| |
Figure 2:
Spitzer IRS spectra of a sample of low-mass embedded sources without PAH detections. For clarity, the spectra are normalized to their flux at 17 |
| Open with DEXTER | |
| In the text | |
| |
Figure 3: Spitzer IRS spectra of Oph GY 23, a low-mass borderline embedded source with a PAH detection. |
| Open with DEXTER | |
| In the text | |
| |
Figure 4:
Model spectra at
|
| Open with DEXTER | |
| In the text | |
| |
Figure 5:
Model SEDs ( top) and blow-up of spectra ( bottom) at
|
| Open with DEXTER | |
| In the text | |
| |
Figure 6:
Model SEDs ( top) and blow-up of spectra ( bottom) with
|
| Open with DEXTER | |
| In the text | |
| |
Figure 7:
Model SEDs ( top) and blow-up of spectra ( bottom) with PAHs in both envelope and disk (black), only in the disk (red) and only in the envelope (blue), at i = 45 |
| Open with DEXTER | |
| In the text | |
| |
Figure 8:
Model SEDs ( top) and blow-up of spectra ( bottom) for i = 5, 25, 45, 65 and 85 |
| Open with DEXTER | |
| In the text | |
| |
Figure 9:
Model SEDs ( top) and blow-up of spectra ( bottom) with template PAH abundance (black), and factors of 10 (red), 20 (purple) and 100 lower (blue) at i = 45 |
| Open with DEXTER | |
| In the text | |
Copyright ESO 2009
Current usage metrics show cumulative count of Article Views (full-text article views including HTML views, PDF and ePub downloads, according to the available data) and Abstracts Views on Vision4Press platform.
Data correspond to usage on the plateform after 2015. The current usage metrics is available 48-96 hours after online publication and is updated daily on week days.
Initial download of the metrics may take a while.