


| Issue |
A&A
Volume 710, June 2026
|
|
|---|---|---|
| Article Number | A290 | |
| Number of page(s) | 14 | |
| Section | Cosmology (including clusters of galaxies) | |
| DOI | https://doi.org/10.1051/0004-6361/202659436 | |
| Published online | 23 June 2026 | |
All the massive galaxy overdensities during reionisation
JWST rest-frame optical selection reveals young, chemically evolved galaxies embedded in dense, neutral gas at z > 5
1
Cosmic Dawn Center (DAWN), Denmark
2
Niels Bohr Institute, University of Copenhagen, Jagtvej 128, 2200 Copenhagen N, Denmark
3
DTU Space, Technical University of Denmark, Elektrovej 327, DK2800 Kgs. Lyngby, Denmark
4
Institute of Science and Technology Austria (ISTA), Am Campus 1, 3400 Klosterneuburg, Austria
5
MIT Kavli Institute for Astrophysics and Space Research, 70 Vassar Street, Cambridge, MA 02139, USA
6
Department of Astronomy, University of Geneva, Chemin Pegasi 51, 1290 Versoix, Switzerland
7
National Astronomical Observatory of Japan, 2-21-1 Osawa, Mitaka, Tokyo 181-8588, Japan
★ Corresponding author: This email address is being protected from spambots. You need JavaScript enabled to view it.
Received:
13
February
2026
Accepted:
6
May
2026
Abstract
The high-redshift progenitors of present-day galaxy clusters are believed to substantially contribute to the global star formation rate density and drive the large-scale reionisation of the Universe. Here we present a blind and unbiased search for and characterisation of galaxy overdensities during the reionisation epoch at redshifts z ∼ 5.5 − 7 based on rest-frame optical JWST/NIRCam grism spectroscopy of the Abell 2744 lensing field as part of the JWST All the Little Things (ALT) survey. Using a physically motivated, cosmological inference friends-of-friends (FoF) algorithm, we identified six galaxy overdensities, including five robust systems at z = 5.66–6.77. They are all characterised by total halo masses of Mhalo ≳ 1011 M⊙, inferred from a range of proxies. We find that the galaxy members in these overdense environments are on average less massive though equally metal-rich, and generally comprised of younger stellar populations, as indicated by their bluer spectral slopes and less prominent Balmer breaks compared to field galaxies at similar redshifts. Further, we use this novel rest-frame optical selection of galaxy proto-clusters to infer the fraction and 3D distribution of strong Lyman-α emitters (LAEs) and damped Lyman-α absorbers (DLAs) in the overdensity environments. We find that two out of the six galaxy overdensities have excess H I absorption compared to the field average, while the other four are consistent within their large scatter in density. These results present the first direct observational constraints on the tomography of the dense, neutral gas reservoirs in large-scale galaxy overdensities at z > 5 and highlight the limitations of pre-JWST searches for reionisation-era galaxy overdensities relying on the detection of strong LAEs alone.
Key words: galaxies: clusters: general / galaxies: high-redshift / large-scale structure of Universe
© The Authors 2026
 Open Access article, published by EDP Sciences, under the terms of the Creative Commons Attribution License (https://creativecommons.org/licenses/by/4.0), which permits unrestricted use, distribution, and reproduction in any medium, provided the original work is properly cited.
This article is published in open access under the Subscribe to Open model. This email address is being protected from spambots. You need JavaScript enabled to view it. to support open access publication.
1. Introduction
Galaxy clusters are the titans of cosmic structure, comprising immense, gravitationally bound systems that act as key drivers of galaxy evolution and large-scale structure formation, and they can serve as powerful probes of dark matter distribution in the Universe. Their progenitors, high-redshift ‘proto-clusters’, are particularly important for understanding how galaxies assembled in the early Universe (Overzier 2016). In these dense environments, galaxies are expected to undergo accelerated growth, fuelled by cold gas inflows and mergers, and to contribute significantly to the reionisation of the intergalactic medium (IGM) through their enhanced production of ionizing photons (Chiang et al. 2017; Daddi et al. 2022). Studying such systems therefore provides critical insights into how galaxies and the large-scale structure co-evolved in the first billion years after the Big Bang.
A central aspect of this picture is the role of neutral atomic hydrogen (H I) gas. As the primary fuel for star formation, cold gas accretion onto proto-galactic dark matter haloes plays a central role in regulating galaxy growth, particularly in protocluster environments, where accretion rates are expected to be high (e.g. Kereš et al. 2005; Dekel et al. 2009; Schaye et al. 2010). Cold gas streams feeding the densest nodes of the cosmic web suggest that substantial reservoirs of H I may be present in and around forming clusters, simultaneously driving star formation and tracing the build-up of the circumcluster medium (CCM). Beyond their influence on galaxy growth, these reservoirs also shape the ionisation state of the surrounding IGM. At z ∼ 6, the Universe approaches the end of the reionisation epoch – though some studies have favoured a later end to reionisation (e.g. Keating et al. 2019; Bosman et al. 2022). In this regime, overdense regions may host locally enhanced reservoirs of neutral gas, where the neutral hydrogen fraction remains elevated due to a combination of delayed ionisation, self-shielding, and continuous replenishment by cold inflows. Observational evidence already points to significant neutral gas in these environments, with column densities reaching NHI ≳ 1022 cm−2 (Terp et al. 2024; Witten et al. 2026a; Heintz et al. 2026). In addition, early dust enrichment in overdense regions may further suppress the escape of ionizing photons, thereby helping to maintain a high neutral fraction (e.g. Hashimoto et al. 2023).
Within the Lambda Cold Dark Matter (ΛCDM) framework, these systems naturally arise from the inhomogeneous dark matter distribution: small-scale dark matter haloes collapse to form the first galaxies, while larger-scale (∼0.1–1 pMpc) overdensities grow into more loosely bound galaxy associations that later virialise into clusters. When these haloes reach a transitional mass of log10(Mhalo/M⊙)∼11.8 (Dekel & Birnboim 2006), infalling gas becomes shock-heated, creating a hot circumgalactic medium (CGM) that suppresses star formation. This transition corresponds to the halo virial temperature exceeding the regime of efficient radiative cooling, allowing stable virial shocks to form and preventing rapid gas accretion. At higher redshifts, however, cold streams can still penetrate this hot phase (Katz et al. 2003; Kereš et al. 2005; Mandelker et al. 2016; Bennett & Sijacki 2020), leading to the expectation that proto-clusters should host compact, intensely star-forming galaxies that in total dominate the cosmic star formation rate density (Behroozi et al. 2013; Chiang et al. 2017; Morokuma-Matsui et al. 2025).
However, emerging observations have revealed a more complex reality. While some proto-cluster galaxies appear extremely evolved – with high metallicities, older stellar populations, or strong Lyman-α damping wings, so-called damped Lyman-α absorbers (DLAs; Wolfe et al. 2005), from dense H I reservoirs (NH I > 1022 cm−2; Morishita et al. 2025a; Li et al. 2025; Witten et al. 2026b; Wang et al. 2026) – others show much younger, more typical high-z properties, with no clear signs of accelerated evolution (Laporte et al. 2022; Li et al. 2025; Helton et al. 2024a). This diversity suggests that environmental effects vary substantially across proto-clusters, likely reflecting differences in assembly histories, accretion rates, halo masses, and ionisation environments (see e.g. Witten et al. 2026b). To understand what drives these variations, a larger and more diverse sample of well-characterised overdensities is required.
The advent of the James Webb Space Telescope (JWST) has made obtaining such a sample possible. Its sensitivity and near-infrared spectroscopic capabilities allow for direct detection of strong Lyman-α absorption in galaxies, revealing galaxy DLAs with NH I ≥ 1022 cm−2 at z > 8 (Heintz et al. 2024), and its rest-frame optical selection mitigates biases inherent to earlier Lyα- or UV-based cluster searches (e.g. Castellano et al. 2018; Leonova et al. 2022). JWST enables the detection of both massive and low-mass protocluster members (Helton et al. 2024a,b; Fudamoto et al. 2025), providing a direct census of cold gas across entire structures during the epoch of reionisation (EoR).
Here, we present a blind rest-frame optical search for galaxy overdensities in the EoR at z ≳ 5 using the slitless JWST/NIRCam grism spectroscopic observations of the Abell 2744 lensing field obtained as part of the All the Little Things (ALT) survey (prog. ID: 3516, PIs: Matthee & Naidu; Naidu et al. 2024). The main goal is to characterise the stellar populations and chemical enrichment of the cluster members and determine the H I gas tomography of these massive, large-scale overdensities. We have structured the paper as follows. In Sect. 2, we detail the JWST-ALT and archival observations of the targeted field. In Sect. 3.1, we present our search for massive galaxy overdensities at z > 5 and characterise their general properties. In Sect. 4, we outline the characterisation of the physical properties of each cluster member and make comparisons to typical field galaxies, and in Sect. 5 we construct the H I absorption tomography and derive the fractions of strong LAEs and DLAs in each identified proto-cluster. Finally in Sect. 6, we offer a discussion and our conclusions based on our work. Throughout the paper, we assume the concordance flat ΛCDM cosmology, with H0 = 67.7 km s−1 Mpc−1, Ωm = 0.310, and ΩΛ = 0.689 (Planck Collaboration VI 2020).
2. Observations
2.1. ALT JWST/NIRCam grism spectroscopy
In this work, we utilised NIRCam imaging data from the ALT survey, conducted as a part of JWST Cycle 2 (Prog. ID 3516, PIs: Matthee & Naidu). Briefly, ALT is designed to investigate the physical properties and environments of galaxies during the EoR, combining deep imaging and wide-field slitless spectroscopy in the well-studied Abell 2744 lensing field (Naidu et al. 2024). The survey delivers ultra-deep imaging in the F070W and F090W filters, reaching observed depths of ∼30 mag (5σ) over a 30 arcmin2 field, enabling the selection of extremely faint high-redshift sources at z > 6.
In addition to imaging, ALT provides deep NIRCam wide-field slitless spectroscopy in the F356W filter optimized to capture the [O III] λλ4960, 5008 doublet and the Hβ emission lines at z ≃ 6 − 7 based on earlier methodology successfully employed by the EIGER survey (Kashino et al. 2023; Matthee et al. 2023). At higher redshifts (z ≳ 7), these lines redshift out of the F356W bandpass, and galaxies are instead identified primarily through Hγ emission and, where available, additional rest-frame optical features (see Naidu et al. 2024). The survey uses a dual–roll angle ‘butterfly’ mosaic to minimise contamination, yielding deep spectra and secure redshifts for hundreds of galaxies at the target redshifts. In this work, we only consider sources with robust spectroscopic line redshifts and identifications, requiring a signal-to-noise (S/N) of > 5 for [O III] λ5007. Source photometry and spectral energy distribution (SED) fitting, described in detail in Naidu et al. (2024), provide estimates of the stellar mass, star formation rate (SFR), rest-frame UV slopes (βUV), and other physical parameters for each identified galaxy. These data products lay the foundation for the rest-frame optical identification and characterisation of high-redshift galaxy overdensities and for subsequent analysis of their neutral gas content presented in this work.
2.2. Auxiliary JWST/NIRSpec spectra and NIRCam imaging
To complement the ALT dataset, we also queried the DAWN JWST Archive (DJA)1, a homogeneously processed compilation of all publicly available JWST data (see e.g. Heintz et al. 2025; de Graaff et al. 2025; Pollock et al. 2026, for the technical details) for existing JWST/NIRSpec Prism spectroscopy (ℛ ∼ 100, λ = 0.6 − 5.5 μm) of the identified targets. These were obtained primarily as part of the UNCOVER survey (Labbé & Bezanson, JWST-GO#2561 Bezanson et al. 2024). We discuss these axillary spectra and their derived properties in Sect. 5.
To complement the JWST/NIRCam imaging in the F070W and F090W filters delivered by ALT, we also included photometric data from the MegaScience survey (Suess et al. 2024), providing images in all the NIRCam medium-bands of the Abell 2744 lensing field, and additional data from the NIRCam parallel programs #2756, PI: Chen (e.g. Chen et al. 2022) and #3990, PI: Morishita. Across the ALT footprint, imaging is thus available for in all the 20 NIRCam medium bands and broad bands as described in Naidu et al. (2024).
3. Analysis and results
3.1. Identification of galaxy overdensities at z > 5
Galaxy overdensities are typically identified using statistical techniques that analyse the spatial distribution of galaxies to detect significant peaks in density above the cosmic average (e.g. Calvi et al. 2021). A wide range of clustering algorithms exist, each with subtle methodological differences (see e.g. Overzier 2016). One key distinction lies in the scale of association they consider – either galaxy-to-galaxy or halo-to-galaxy links. Here, we employ a galaxy-to-galaxy approach using a friends-of-friends (FoF) algorithm, as halo-based linking has been shown to be less effective at identifying low-mass groups (Robotham et al. 2011). The standard FoF algorithm identifies galaxy groups by linking galaxies that are within a predefined separation, defined as the linking length. This approach assumes that galaxies within the same overdense structure are more closely spaced than those in the surrounding field. Its lack of symmetry assumptions makes it well-suited for identifying irregular, filamentary, and evolving structures, as expected for galaxy overdensities and proto-clusters in the early Universe. The linking length is commonly defined as
 (1)
(1)
where n is the galaxy number density and b is a dimensionless scaling factor controlling the strictness of group associations. Larger b values link more loosely associated galaxies, while smaller values favor the identification of compact, tightly bound structures. Although a canonical value of b = 0.2 is commonly used for virialized systems (More et al. 2011), this is not appropriate at high redshift, where overdensities are expected to be dynamically young and unvirialized. We therefore adopt a larger linking length, b = 1, which is better suited for identifying extended proto-cluster structures.
To ensure that the linking length reflects the underlying galaxy distribution in the ALT catalog, a physically motivated, redshift-dependent value is computed. This is calculated from the comoving volume per unit solid angle within a redshift interval:
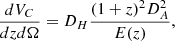 (2)
(2)
where DH = c/H0 is the Hubble distance, DA is the angular diameter distance, and E(z) = H(z)/H0 is the dimensionless Hubble parameter. Integrating over a redshift interval [zmin, zmax] yields the total comoving volume,
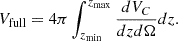 (3)
(3)
The effective volume covered by the survey is then
 (4)
(4)
where fsky is the fractional sky coverage of the ALT survey. The galaxy number density is then simply given by n = Ngalaxies/V, where Ngalaxies is the number of sources within the survey volume in the specified redshift range.
The FoF algorithm is applied to then group galaxies based on their 3D spatial positions in the source plane (using the lensing model from Furtak et al. 2023) and redshift proximity. This is done in six redshift intervals (to reduce computing time), representing the largest overdensities of sources identified visually; z = [5.50, 5.69], [5.69, 5.80], [6.18, 6.30], [6.30, 6.50], and [6.50, 7.00]. For each interval, a redshift-dependent linking length is computed using Eq. (1), based on the corresponding number density. The grouping is performed using SciPy’s cKDTree for efficient neighbor searches, linking galaxies that lie within the linking length of each other.
The resulting physically-motivated linking lengths, number densities, and survey volumes for each redshift interval are summarized in Table 1. In contrast to previous JWST studies that adopt a fixed comoving linking length (e.g. Helton et al. 2024a,b), we allowed the linking length to vary with redshift according to the evolving galaxy number density. This approach leads to the identification of fewer, but systematically richer, overdensities.
Computed physically motivated linking lengths (l), number densities (n), and effective survey volumes (V) for each redshift range.
For comparison, applying a fixed linking length of 500 pkpc (corresponding to ∼3.5 cMpc at z ∼ 6) results in a similar number of groups, but with lower typical membership. Using the physically motivated, redshift-dependent linking lengths instead yields overdensities with higher average galaxy membership, consistent with the identification of more extended or filamentary structures compared to those selected using a fixed linking length. The overall population of prominent overdensities, however, remains qualitatively similar between the two approaches.
We select robust high-redshift galaxy overdensities from the groups identified by the FoF algorithm by imposing a minimum membership criterion of Ngal ≥ 5. Applying this threshold yields 11 overdensities out of 84 FoF-identified groups, with galaxy membership counts of Ngal = 8 − 59. These structures are found to be largely robust to variations in the linking parameter b, with similar groupings recovered even when b is varied by factors of a few. The subsequent analysis focuses on the five largest overdensities, located at z∼ 5.66, 5.77, 6.24, 6.34, and 6.77 as shown in Figure 1. We also identify an overdensity at z = 7.88, obtained by computing the linking length within the redshift interval 7.00 < z < 8.00. This structure has been previously studied in several works (see e.g. Ishigaki et al. 2016; Hashimoto et al. 2023; Morishita et al. 2025b; Witten et al. 2026b). However, we exclude this overdensity from parts of the analysis in Sect. 4 because, at z > 7, only Hγ and O II are accessible, whereas the 5 < z < 7 sample is characterised using O III and Hβ (Naidu et al. 2024). This leads to non-uniform selection and prevents a direct comparison.
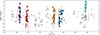 |
Fig. 1. Spatial and redshift distribution of galaxies in the ALT catalog with overdensities marked. Spatial and redshift distribution of galaxies from the ALT catalog in the range 5.5 < z < 7. The horizontal axis shows the grism redshift (zgrism, ALT), while the vertical axis indicates the comoving offset in declination (ΔDec; [cMpc]). Marker size reflects the comoving offset in right ascension (ΔRA; [cMpc]), ranging from −6.5 to 5.3 cMpc, with larger symbols corresponding to larger offsets. Galaxies belonging to the five most significant overdensities identified by the FoF algorithm are shown in colour, while all field galaxies are displayed in gray. |
The significance of each overdensity is quantified using the galaxy overdensity parameter,  , where ngroup is the number density of galaxies within the group, and
  is the mean number density of galaxies in the corresponding redshift range. The group density is estimated by dividing the number of member galaxies by the volume of the convex hull enclosing their spatial distribution. To prevent artificially large overdensities arising from very small group volumes, a minimum volume threshold of Vmin = 161.3 cMpc3 is imposed (calculated from the whole survey), defined as a fraction of the mean volume per galaxy in the survey. The mean density
  is computed from the full galaxy sample within each redshift bin using the total survey volume.
This overdensity metric captures the relative enhancement in galaxy density compared to the cosmic mean at a given redshift. Uncertainties on δgal are estimated by propagating Poisson errors on galaxy counts in both the group and the redshift bin. While this provides a first-order estimate of the statistical uncertainty, it does not account for systematic effects such as redshift uncertainties (which are small in this case due to the robust spectroscopic redshifts) or cosmic variance. In particular, if the survey field samples a region that is intrinsically over- or underdense, the resulting δgal values may be biased. The overdensity values for each structure are listed in Table 2.
Properties of each identified overdensity analysed in this work, including their respective redshifts, number of members (Ngal), δgal, and estimated dark matter halo masses given as log10(Mhalo/M⊙).
3.2. SED modelling and physical parameters
A detailed description of the SED modelling for all galaxies in the ALT survey is provided in Naidu et al. (2024). In this work, we adopt the physical parameters and model galaxy spectra derived there, using the PROSPECTOR SED-fitting framework (Leja et al. 2017; Johnson et al. 2021), following the methodology described in Naidu et al. (2022b,a), Tacchella et al. (2022). It combines all available photometry with the accurate redshifts from the ALT grism measurements, and includes flexible, non-parametric star formation histories, dust attenuation, and nebular emission.
From the resulting best-fit SEDs, we adopt UV absolute magnitudes MUV, and UV continuum slopes βUV, along with other derived stellar population and interstellar medium (ISM) properties. The strength of the Balmer break is quantified as the ratio of flux densities measured in wavelength windows on either side of the break.
3.3. Inferring total halo masses
To characterise the total mass scale of the identified overdensities, it is essential to estimate the masses of their associated dark matter haloes which are expected to dominate their matter content. These estimates offer critical insight into the gravitational potentials of the structures, their likely evolutionary pathways into present-day galaxy clusters, and their role within the context of cosmic large-scale structure formation. We used three different methods for inferring the total halo masses, (1) a kinematic approach, (2) the empirical MUV − Mhalo relation from Mason et al. (2023) for the sum of the individual MUV magnitudes, and (3) a standard scaling from total stellar mass of the group members assuming a constant halo-to-stellar mass ratio.
3.3.1. Kinematic
For each galaxy member in the overdensities, we calculated the line-of-sight (LOS) velocity as vLOS = c(z − zcluster)/(1 + zcluster), where c is the speed of light, z is the galaxy redshift, and zcluster is the cluster redshift. We defined the latter as the mean redshift of the identified member galaxies, which serves as the reference frame for calculating the motion of individual galaxies relative to the group center (e.g. Lee et al. 2019). The velocities of each galaxy member w.r.t. the cluster redshift can be seen for each overdensity in Figure 2.
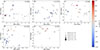 |
Fig. 2. Projected spatial distribution of galaxies in the five largest overdensities identified in the ALT survey, plotted in comoving coordinates (RA vs. Dec). Each panel corresponds to a different overdensity, labeled by its mean redshift: (a) z = 5.66, (b) z = 5.77, (c) z = 6.24, (d) z = 6.34, and (e) z = 6.77. Individual galaxies are colour-coded by their line-of-sight velocity in kilometers per second relative to the group’s mean redshift and scaled based on their stellar mass. |
To robustly estimate the velocity dispersion of the group, we employ the biweight midvariance as a statistical estimator, chosen for its resilience to outliers and observational uncertainties. The resulting LOS velocity dispersion, σLOS, is subsequently used to infer the total halo mass. The adopted relation is given by:
![Mathematical equation: $$ \begin{aligned} {M}_{\rm halo}&= 1.2 \times 10^{15} \left( \frac{\sigma _{\rm LOS}}{1000 \, \mathrm{km} \,\mathrm{s}^{-1}} \right)^{3} \left[ \frac{1}{\sqrt{ \Omega _{\Lambda } + \Omega _{m}(1+{z}_{\rm cluster})^{3} }} \right] \nonumber \\&\quad \times \left( \frac{{H}_{0}}{100 \, \mathrm{km} \,\mathrm{s}^{-1} \,\mathrm{Mpc}^{-1}} \right) \,{M}_{\odot }, \end{aligned} $$](/articles/aa/full_html/2026/06/aa59436-26/aa59436-26-eq14.gif) (5)
(5)
where H0 is the Hubble constant, and ΩΛ and Ωm are the cosmological density parameters (see e.g. also Lee et al. 2019). We infer total halo masses in the range Mh ∼ 1011.5 − 1012.5 M⊙ from this method. Although this assumes that the overdensities are approximately virialized, it provides a useful, luminosity-independent estimate of the total halo mass. In practice, however, many of these structures may still be in the process of gravitational collapse, with internal kinematics dominated by infall, mergers, or other non-equilibrium processes. Consequently, the measured velocity dispersions may be systematically biased high, potentially leading to overestimated halo masses. In addition the measured line-of-sight velocities are subject to systematic uncertainties in the spectroscopic redshifts, typically of the order ∼60 km s−1 (Bordoloi et al. 2024). These uncertainties artificially broaden the observed velocity distribution and are not explicitly accounted for in our analysis. As a result, the inferred velocity dispersions, and hence halo masses, may be mildly overestimated, particularly for systems with intrinsically low velocity dispersion.
The associated uncertainty on the halo mass is derived via bootstrap resampling of the LOS velocities to estimate the error on σLOS, which is then propagated through the scaling relation assuming Mhalo ∝ σLOS3.
3.3.2. MUV − Mhalo relation
A second approach to estimating the dark matter halo mass of each overdensity relies on empirical relations between a galaxy’s ultraviolet (UV) luminosity and the mass of its host halo. These relations are typically established via abundance matching techniques, which link the observed galaxy UV luminosity function to the theoretically predicted halo mass function from cosmological simulations. For this study, we adopt the relations from Mason et al. (2023), calibrated at z ≈ 6, 7, and 8, which connects MUV to the host halo mass via:
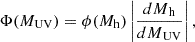 (6)
(6)
where the derivative is given by dMh/dMUV = ln10 Mh/2.5. We adopt the UV luminosities, LUV, derived by Naidu et al. (2024) for individual ALT galaxies and sum them to obtain the total UV luminosity of each overdensity, which is then converted into an effective UV magnitude for the halo matching. Using the adopted MUV − Mhalo relations from Mason et al. (2023), we infer total halo masses of the order Mh ∼ 1011.6 − 1012.6 M⊙ (see Table 2). The associated uncertainty is primarily driven by the intrinsic scatter in the empirical relation, which is estimated to be on the order of ∼1.5 magnitudes in MUV.
3.3.3. Constant halo-to-stellar mass ratio
The third method estimates the dark matter halo mass of each overdensity based on the total stellar mass of its constituent galaxies. This approach assumes a fixed scaling relation between stellar and halo mass, motivated by empirical constraints and simulation-based studies (Behroozi et al. 2013). Specifically, a constant halo-to-stellar mass ratio of 100 is adopted, reflecting the average scaling observed in abundance matching and halo occupation models. This yields total halo masses in the range Mh ∼ 1011.2 − 1012.1 M⊙ using this method. While this linear approximation captures the general trend, it does not account for variations in the halo-to-stellar mass ratio that may arise due to halo mass, redshift, or baryonic feedback processes, and it is therefore used here only as an order-of-magnitude consistency check rather than a precise determination of halo mass. The dark matter halo masses derived using the different methods are shown in Fig. 3 and summarized in Table 2, and are found to largely agree across all approaches.
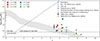 |
Fig. 3. Dark matter halo mass versus redshift. Each overdensity is colour-coded following the notation of Fig. 1, with distinct symbols indicating the mass estimation method. Open colour-coded circles at z = 0 indicate the median descendant halo masses inferred from the UV-based halo masses, with error bars showing the standard deviation derived from tracing haloes in the IllustrisTNG simulations following the method described in Witten et al. (2026a). The gray shaded region shows the expected evolution of a Coma-like cluster (Chiang et al. 2013) assuming constant evolution beyond z ∼ 7. The horizontal dashed black line marks the shock stability threshold separating cold accretion from hot ICM formation (Dekel & Birnboim 2006), while the diagonal dashed line indicates the limit for penetrating cold flows. For comparison, overdensities from Helton et al. (2024a), Fudamoto et al. (2025), and Witten et al. (2026a) are shown with black, gray, and light green markers, respectively. |
To place the inferred halo masses in a broader evolutionary context, we utilise our estimates of the halo masses of our sample of overdensities to identify similar haloes in the TNG300 (Pillepich et al. 2018; Nelson et al. 2018; Naiman et al. 2018; Marinacci et al. 2018; Springel et al. 2018) and TNG-Cluster (Nelson et al. 2024). Following the method described in Sect. 5.1 of Witten et al. (2026a), we trace comparable high-redshift haloes in these simulations down to z = 0 to establish the distribution of descendant halo masses. We take the median and standard deviation of this distribution to establish the likely current-day halo mass and its associated uncertainty of each of our overdensities.
The resulting z = 0 halo mass estimates provide an indication of the present-day descendants of the identified overdensities range between log10(Mhalo/M⊙)∼13.35 − 14.91 and are shown in Fig. 3. Given that galaxy clusters at z = 0 are typically defined as systems with Mhalo > 1014 M⊙, these results suggest that most of the identified overdensities are likely to evolve into present-day galaxy clusters, and it can therefore be considered strong protocluster candidates.
3.4. Modelling the Lyα absorption
To assess the presence of DLAs within each of the identified galaxies in the six most massive overdensities, we adopt the rest-frame UV spectral slopes (βUV) derived by Naidu et al. (2024) as a baseline description of the intrinsic rest-frame UV continua. However, since the ALT SEDs do not include a treatment of the Lyα region, they are unsuitable for directly constraining the neutral gas content of the galaxies. For this reason, we construct a complementary “simple” SED for each galaxy that explicitly models the continuum and absorption around Lyα, while retaining the ALT SED redward of the line instead of interpolating a pure power-law continuum (see Fig. 4 for examples). In this framework, the continuum redward of λLyα(1 + zspec) + 500 Å is described by a power law anchored to the ALT SED, Fλ ∝ λβUV. The offset is chosen to avoid contamination from Lyα and surrounding absorption features while remaining within the well-constrained photometric range. A Gaussian Lyα emission line is included at the systemic redshift, with its flux tied to the observed Hβ emission assuming case-B recombination (RLyα/Hβ = 32.7 Osterbrock & Ferland 2006), such that any attenuation of Lyα is attributed to absorption rather than an explicit escape fraction (i.e. assuming fesc, Lyα = 1). A caveat of this approach is the redshift dependence to constrain NHI from photometry, since the apparent strength and wavelength of the DLA depend on redshift and filter coverage. In our analysis, however, the combination of medium- and broad-band HST and JWST photometry provides dense coverage of the rest-frame UV, and the availability of precise spectroscopic redshifts removes any major degeneracy. As a result, the redshift-dependent uncertainties are not expected to significantly affect our conclusions, certainly for the internal cluster variations.
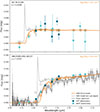 |
Fig. 4. Example SED fits and photometric data for two galaxies in two of the overdense environments at z = 5.64 (top) and z = 7.88 (bottom). Filled squares with error bars show the HST (dark blue) and JWST/NIRCam (light blue) photometry. The dark gray step curve displays the NIRSpec/prism spectrum. The orange solid line shows the best-fitting SED model including a DLA (SED+DLA), while the semi-transparent grey curve indicates the corresponding intrinsic SED model without the Lyα region from Naidu et al. (2024). Open orange squares represent the model-predicted photometry obtained from the SED+DLA model, and open grey squares show the photometry predicted by the intrinsic SED. The inferred NH I values are indicated in the upper right of each panel. |
For clarity, the different components contributing to the modeled Lyα absorption were treated as follows:
-
The intrinsic UV continuum, anchored to the ALT SED and parameterized by βUV;
-
Intrinsic Lyα emission at the systemic redshift, scaled from Hβ;
-
Absorption by neutral hydrogen associated with the galaxy, modeled with a Voigt profile and parameterized by NHI;
-
Additional absorption from the surrounding intergalactic medium, included via a standard damping-wing prescription.
The Lyα absorption from neutral hydrogen in ISM or the immediate surroundings of each galaxy is then modelled using a Voigt–Hjerting profile, following the analytical approximation of Tepper-García (2006):
 (7)
(7)
where C is the absorption constant, a is the damping parameter, NHI the neutral hydrogen column density, and H(a, x) the Voigt-Hjerting function (see e.g. Heintz et al. 2024). We also account for the absorption expected from the surrounding IGM. As a baseline, we adopted the Gunn-Peterson optical depth, with the extended damping wing modeled following the formalism of Miralda-Escude et al. (2000) and Totani et al. (2006):
![Mathematical equation: $$ \begin{aligned} \tau _{\text{IGM}}(\lambda _{\rm obs}, z)&= \frac{x_{\rm HI} R_{\alpha } \tau _{\rm GP}(z_{\rm gal})}{\pi } \left( \frac{1+z_{\rm abs}}{1+z_{\rm gal}} \right)^{3/2} \nonumber \\&\quad \times \Bigg [ I\left( \frac{1+z_{\rm IGM,u}}{1+z_{\rm abs}} \right) - I\left( \frac{1+z_{\rm IGM,l}}{1+z_{\rm abs}} \right) \Bigg ], \end{aligned} $$](/articles/aa/full_html/2026/06/aa59436-26/aa59436-26-eq17.gif) (8)
(8)
where xHI is the average neutral-to-total hydrogen fraction of the IGM, set artificially small in order to ensure that the absorption effectively traces the total H I column density at each galaxy, zgal is the galaxy’s systemic redshift, and Rα = ΛαλLyα/(4πc) = 2.02 × 10⁻⁸ is a dimensionless factor depending on the Lyα damping constant Λα and rest wavelength λLyα. The function I(x) is the analytic integral of the Lyα damping-wing opacity, which accounts for the cumulative absorption by neutral hydrogen along the line of sight given as:
 (9)
(9)
which is mostly a good approximation assuming (zabs − zIGM, u)≫Rα(1 + zabs) (see Totani et al. 2006). For each galaxy we set the upper bound at the galaxy redshift (zIGM, u = zgal) and the lower bound to zIGM, l = 5.0. The Gunn-Peterson optical depth is given by
 (10)
(10)
where h = H0/(100 km s−1 Mpc−1) is the present-day dimensionless Hubble parameter, and ΩDM, 0 and Ωm, 0 are the current dark matter and matter density parameters (Fan et al. 2006; Heintz et al. 2024). For this analysis, we assume that the DLA arises from gas in close proximity to the galaxy itself and therefore fix the absorber redshift to the galaxy redshift (zabs = zgal). We caution that we are in most cases unable to constrain absorption redshifts (as done by e.g. Heintz et al. 2026; Terp et al. 2024), since we are relying on photometric data alone in the rest-frame UV part of the spectrum. We will evaluate this method further in Sect. 5.
4. Galaxy properties in overdense environments
The overdensities identified in Sect. 3.1 provide a unique opportunity to investigate how galaxy properties are shaped by their large-scale environments during the EoR. In this section, we compare the stellar population and ISM properties of galaxies residing in the six FoF–selected overdensities to those of field galaxies drawn from the ALT survey at a similar redshift. The statistical significance (p-value) of any difference between the overdensity and field galaxies is quantified using a Kolmogorov-Smirnov (KS) test. To investigate whether the physical properties of galaxies residing in overdense environments differ from those of the field population, we focus on comparing the following main characteristics; UV magnitudes, stellar masses, UV continuum slopes, metallicities, and star formation rates for each overdensity to the full ALT field-selected galaxy benchmark sample.
We consider the full redshift-space that covers Hβ and [O III] at z ≈ 5.5 − 7 to ensure the statistical power needed to characterise the underlying field population, since the number of field galaxies within the narrow redshift ranges spanned by individual overdensities is too small to establish reliable reference distributions. This approach allowed us to identify potential environmental trends while avoiding noise driven by low-number statistics.
4.1. Stellar masses
We first compare the stellar masses of galaxies in each overdensity to those of the full ALT field population in Fig. 5. Across all five structures, the overdensity members span a broad range of log10(M★/M⊙) = 6.5 − 9.5. We observed clear evidence of their distributions being shifted towards lower masses compared to the general field population, with p-values p < 0.01. The stellar mass distribution of the field galaxies exhibits a peak around log10(M★/M⊙)∼8 − 9 and extends to ≳1010.5 M⊙. None of the identified overdensity galaxies exhibit such high stellar masses.
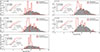 |
Fig. 5. Normalised distributions of stellar masses (log10(M★/M⊙)) for overdensity galaxies (red) and field galaxies (gray) in each of the five largest overdensities. Insets show the corresponding empirical cumulative distribution function (ECDFs) along with the KS statistic and p-value. |
At first glance, this result may appear counter-intuitive, as galaxies residing in massive dark matter overdensities are expected to experience earlier collapse and enhanced gas accretion, leading to potentially rapid stellar mass growth. First, while the inferred halo masses of the overdensities are already substantial, the overdensities likely correspond to an early evolutionary phase in which baryonic assembly is still ongoing. In such environments, efficient gas accretion does not necessarily translate immediately into high stellar masses, particularly if star formation is ‘bursty’ or temporarily suppressed. In addition, selection effects may also play a role. The ALT sample is fundamentally emission-line selected, relying on the detection of rest-frame optical lines such as [O III] and Hβ. This imposes an effective SFR threshold, such that massive galaxies with low (or declining) star formation activity may fall below the detection limits and therefore remain absent from the sample. As a result, the observed stellar mass distributions likely trace the actively star-forming subset of galaxies within the overdensities, rather than the full underlying population.
4.2. Rest-frame UV continuum slopes, UV luminosities, and star formation rates
The rest-frame UV properties, βUV and MUV, together with the Balmer breaks DB and SFRs derived from Hβ, probe the star formation activity on different timescales and provide insights into the typical ages of the stellar populations of the overdensity members. We find no statistically significant difference (p > 0.1) in terms of the UV brightness (probing SFRs on ∼100 Myr timescales) or their more instantaneous SFR (∼10 Myr) derived from Hβ when comparing the cluster-members to field-selected galaxies at similar redshifts (see Fig. A.1). In contrast, we find significant evidence of the rest-frame UV continuum slopes of the galaxy overdensity members being, on average, bluer than those of the field population (see Fig. B.1). The mean (and median) spectral slopes for the cluster-members are βUV, mean = −2.12 (βUV, med = −2.21), where the field-selected galaxies are significantly redder with βUV, mean = −1.67 (βUV, med = −1.93), with p < 0.01 for the five clusters at z = 5.66 − 6.77.
This interpretation is further supported by the distribution of Balmer break strengths, DB, as shown in Fig. 6. The overdensity galaxies exhibit weaker Balmer breaks than the field population at fixed redshift, indicating younger luminosity-weighted stellar ages and a reduced contribution from older stellar populations. Taken together, the bluer continua and weaker Balmer breaks suggest that galaxies in overdense environments are dominated by relatively young stellar populations, despite having comparable UV luminosities to field galaxies. Combined with their systematically lower stellar masses, this implies that star formation in these particular galaxies do not seem to accelerate their stellar evolution, as also noted for another galaxy overdensity at z = 7.66 (Witten et al. 2026a).
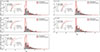 |
Fig. 6. Normalised distributions of Balmer break strength (DB) for the overdensity and field galaxies. The colours of the two distributions and the insets follow the same notation as in Fig. 5. |
4.3. Gas-phase metallicities
For lower-mass galaxies with, on average, younger stellar populations as inferred for the majority of the overdensity systems, we expect the metal abundance to be equally lower. In Figure 7, we compare the metallicity distributions of the five clusters to the field-galaxy benchmark sample, using the [O III] λ5007/Hβ (O3) ratio as a proxy for the gas-phase metallicity Z, interpreted through the recent JWST-based calibrations from Sanders et al. (2024). The fluxes of the [O III] and Hβ emission lines are derived via standard Gaussian profile fitting to the observed line profiles. These sets of calibrations have been validated to be applicable to grism-selected galaxy samples as well (Kotiwale et al. 2026). In this framework, higher O3 values correspond to lower metallicities, while lower O3 values indicate more metal-rich gas.
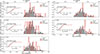 |
Fig. 7. Normalised distributions of the gas-phase metallicity proxy log10([O, III]/Hβ) for overdensity galaxies and field galaxies. The colours of the two distributions and the insets follow the same notation as in Fig. 5. The upper axes indicate the corresponding oxygen abundances, 12 + log(O/H) derived from the strong-line ratio from Sanders et al. (2024), for reference. |
Contrary to the expectations, we find that the metallicities are systematically higher for the overdensity members of the three systems at z > 6, though not at high significance (p = 0.01 − 0.2). The three lower-redshift systems do not show any evidence of enhanced metallicities compared to the field-average. This does still imply, however, in combination with the systematically lower stellar masses across all five systems, that the chemical enrichment of the overdensity-members are generally higher at a given stellar mass. This could indicate a potential enhanced star formation efficiency during an earlier time in the star formation history of the galaxies (Ellison et al. 2008), or potentially a higher fraction of high-mass stars yielding a higher chemical yield, as also supported by the, on average, bluer spectral slopes.
5. Neutral gas abundances in reionisation-era galaxy overdensities
The blind rest-frame optical selection delivered by the ALT survey strategy allowed us to obtain an unbiased census of the fraction of strong Lyman-α emitters (LAEs) and galaxy DLAs in proto-cluster environments in the reionisation era. This is particularly important to probe the overall baryonic matter budget of these systems, and given that past surveys have mainly relied on bright LAEs as signposts of galaxy overdensities, both pre- (e.g. Castellano et al. 2018; Leonova et al. 2022) and post-JWST (e.g. Witstok et al. 2025; Chen et al. 2026). The neutral gas content of galaxies in the overdensities derived from the Voigt-profile modelling of Lyα absorption as described in Sect. 3.4 further allowed us to model the tomography of H I in these overdense regions. This has previously only been done in the outskirts of a similar-mass proto-cluster at z > 5 (Heintz et al. 2026), likely tracing the filamentary, accreting cold gas stream and not the central components.
As a first validation check for the robustness of photometric DLA modelling, we search DJA for JWST/NIRSpec Prism spectra of any of the identified cluster members. We show two examples in Fig. 4, comparing the intrinsic SED model with the best-fit DLA model and for one of the galaxies the observed Prism spectrum. For both galaxies with Prism spectroscopy, the NHI values inferred from the full spectral shape are consistent with those obtained from the photometry alone. The close agreement between the SED+DLA model and the broadband fluxes shows that even in the absence of spectroscopy, the photometric data contain enough information to meaningfully constrain strong Lyα absorption.
The derived column densities span log10(NHI/cm−2) ≈ 8 − 23. Since most models are derived from photometry alone we are not able to identify LAEs reliably, but note that the preferred models with column densities NHI ≲ 1020 cm−2 are likely indiscernible from LAEs. We also do not explicitly account for potential AGN contamination in the modelling, which may introduce additional uncertainty in individual cases. In the following, we thus only consider galaxies with NHI ≥ 1020 cm−2 for the H I tomography. We note that the inferred LAE fraction varies substantially between overdensities, ranging from ∼0 in the z = 7.88 overdensity to ∼0.8. The spatial distributions of NHI for each overdensity are shown in Figure 8. Galaxies with extreme column densities, approaching or exceeding NHI ≳ 1022 cm−2, are found in all of the overdensities. In particular, every single galaxy in the highest-redshift overdensity at z = 7.88 exhibits a high column density as also noted previously (Chen et al. 2024), and consistent with a recent study of a massive galaxy overdensity at z = 7.66 (Witten et al. 2026a).
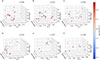 |
Fig. 8. Three-dimensional spatial distribution of galaxies in the five identified groups as well as the overdensity at z = 7.88, shown in comoving coordinates ΔRA, ΔDec, and grism redshift z. Each panel corresponds to one overdensity. Points are coloured by the best-fit neutral hydrogen column density log10(NHI): galaxies with log10(NHI) > 20 use a shared colour scale (right), while galaxies with log10(NHI)≤20 are shown in grey. A common colour bar is used for all high-NHI values to enable direct comparison across groups. In panel (f), the two galaxies observed with the NIRSpec prism and associated with ALT sources are highlighted with diamond symbols and coloured according to their prism-based NHI measurements. Square symbols denote additional galaxies with prism spectra that are not part of the ALT survey also coloured according to their prism-based NHI measurements. |
Across the six overdensities, the distribution of NHI values shows substantial internal variation, with galaxies in the same structure often spanning several orders of magnitude in column density. For example, in the overdensities at z = 5.66, 5.77, and 6.24, systems with log10(NHI/cm−2) > 21.5 are scattered among galaxies with much lower column densities, indicating that the presence of strong Lyα absorption is not confined to a specific spatial subregion of the structure. Instead, high-column systems appear throughout the full range of comoving offsets in RA, Dec, and redshift, suggesting that large neutral gas reservoirs are widespread within these environments rather than associated with a single core or filament.
The overdensities at z = 6.34 and 6.77 display a similar pattern. Although they contain fewer extreme systems, the galaxies with elevated column densities do not cluster spatially. This lack of spatial segregation implies that the mechanisms driving the large neutral columns – whether internal ISM geometry, local ionisation conditions, or the presence of patchy neutral gas in the surrounding medium – operate across the entire overdensity rather than in a single localized region.
Figure 9 places the overdensities in the context of field galaxies at z > 5 by comparison with the median neutral hydrogen column densities inferred from Mason et al. (2026). While the field population exhibits a relatively modest median NHI with substantial intrinsic scatter, several of the ALT overdensities–most notably the highest-redshift structure at z = 7.88 lie systematically above the field relation. This indicates that, at fixed inferred halo mass, galaxies in some overdense environments host larger neutral gas columns than are typically observed in the field. In contrast, other overdensities overlap with, or fall within, the scatter of the field population, suggesting that enhanced neutral gas content is not a universal property of overdense regions at these epochs.
 |
Fig. 9. Mean neutral hydrogen column density of each overdensity as a function of its MUV-inferred halo mass. Each point corresponds to one overdensity and is colour-coded by redshift. Error bars indicate the dispersion in NHI among member galaxies. The dashed line and grey-shaded band represent the median NHI of field galaxies at z > 5 from Mason et al. (2026) and a 0.5 dex scatter. The green hexagon represent the estimated MUV-inferred halo mass of the z = 7.88 overdensity by Morishita et al. (2025b). |
The z = 7.88 overdensity stands out as the most coherent case. All four galaxies exhibit high column densities, and the two sources with NIRSpec Prism spectra that are spatially well matched to the photometric positions (highlighted with diamond symbols in Fig. 8) show some of the strongest and most clearly defined damping wings in the sample. Although this overdensity spans a relatively compact comoving volume, the uniformity of its high NHI values suggests that the entire structure may reside within a particularly dense and highly neutral region of the cosmic web.
A similar diversity in neutral gas properties has also been observed in other high-redshift overdensities. For example, Witten et al. (2026a) report that the z = 7.66 protocluster SMACS-PC-z7p7 hosts galaxies with neutral hydrogen columns comparable to the surrounding field population, suggesting that high NHI is not a universal property of early overdense environments. This supports our finding that only some of the ALT overdensities – most notably the structure at z = 7.88 – show uniformly elevated column densities, while others span several dex in NHI. A tentative pattern can be seen when comparing the average neutral gas content with the inferred halo masses of the overdensities (Fig. 9). Overdensities at higher redshifts tend to exhibit elevated mean NHI values, while systems at lower redshift span a wider range of neutral gas content. A similar level of scatter is seen when comparing NHI with MUV-inferred halo mass: overdensities with comparable inferred masses can host noticeably different column densities, demonstrating that the neutral gas content does not scale monotonically with halo mass inferred from UV luminosity. Such variations are expected, given also that the NHI derived for each galaxy is sightline dependent to that particular system as well (see e.g. Gelli et al. 2025). Even so, the overall distribution hints that the most massive and highest-redshift overdensities may be more likely to host uniformly large neutral gas reservoirs, whereas the remaining structures show a wider diversity in NHI values.
There are, however, clear exceptions. For instance, the z = 5.66 overdensity has a higher mean NHI than the slightly more massive z = 6.24 structure, illustrating that neutral gas content does not increase monotonically with halo mass.
This interpretation is broadly consistent with the findings of Witten et al. (2026a), who report that galaxies in the z = 7.66 SMACS-PC-z7p7 protocluster show no clear environmental signatures and argue that stronger environmental effects may only emerge once overdensities exceed a halo-mass threshold of log10(Mhalo/M⊙)≈11.5. Although our sample is limited, the elevated and spatially coherent neutral gas content in the most massive overdensity, together with the substantial scatter across the others, supports a picture in which both halo mass and evolutionary stage modulate the neutral gas properties of galaxies in early overdense environments, but with considerable variation between individual systems.
6. Conclusions
We have presented a blind, rest-frame optical search for and characterisation of galaxy overdensities during the EoR at z ∼ 5.5 − 7, based on JWST/NIRCam grism spectroscopy from the ALT survey. By applying a physically motivated FoF algorithm to a spectroscopically confirmed sample, we identified five significant overdensities, spanning redshifts z = 5.66–6.77. Independent halo mass estimates based on galaxy kinematics, UV luminosities, and total stellar mass consistently imply total halo masses Mhalo ∼ 1011 − 1014 M⊙, placing these systems among some of the most massive known structures at these epochs.
We compared the physical properties of galaxies residing within the overdensities to a control sample of field galaxies at comparable redshifts drawn from the ALT survey. Across all five robustly identified structures, overdensity members span a broad range of stellar masses, but are, on average, systematically less massive than field galaxies at similar redshifts, while exhibiting comparable UV luminosities and SFRs derived from Hβ. Despite this, the overdensity members show systematically bluer UV continua and weaker Balmer breaks, indicating younger luminosity-weighted stellar populations. Together with their elevated metallicities at fixed stellar mass, this suggests that star formation in these environments does not proceed in a simply accelerated manner, but may instead reflect more efficient or earlier episodes of star formation compared to the field.
We further examined the chemical enrichment of the overdensity galaxies using gas-phase metallicites inferred from rest-frame optical emission line ratios. At z > 6, we find tentative evidence that galaxies in overdense environments are more chemically enriched compared to their field counterparts, while no such trend is observed for the lower-redshift overdensities. Although the statistically significance remains modest, this result suggests that environmental effects may influence early chemical enrichment, potentially through enhanced star formation efficiency or differences in stellar populations at earlier times.
Using detailed modelling of Lyα absorption, we traced the neutral hydrogen content of galaxies within each overdensity. The inferred column densities span log10(NHI)≈18 − 23, with several systems reaching the DLA regime. The spatial distribution of high-NHI systems within the overdensities does not reveal strong evidence of segregation within individual structures. Galaxies with extreme column densities (DLAs) are found throughout the full spatial and redshift extent of the overdensities, suggesting that large neutral gas reservoirs are widespread rather than confined to specific cores or filaments. The highest redshift overdensity at z = 7.88 stands out in this regard, as all member galaxies exhibit high H I column densities, consistent with the structure residing within a particularly dense and neutral region of the cosmic web.
Taken together, our results demonstrate that massive galaxy overdensities during the reionisation era do not necessarily host galaxies that are more massive and evolved than field galaxies. Instead, these systems appear to be characterised by relatively young, low-mass galaxies embedded within large and spatially extended reservoirs of neutral gas. This coexistence of typical stellar masses and metallicities with extreme NHI implies that overdensities at z > 5 remain deeply embedded in gas-rich, partially neutral environments of the cosmic web. These reservoirs may correspond to filaments funneling cold gas into forming protoclusters, supplying fuel for future star formation while simultaneously delaying the local progress of reionisation.
These findings highlight the complex interplay between environment, gas accretion, and star formation in shaping galaxy evolution during the reionisation era. In particular, they suggest that overdense regions at high redshift trace sites of enhanced gas supply rather than uniformly accelerated galaxy growth. Future deep, wide-area JWST surveys and follow-up spectroscopy will be essential to determine how common such gas-rich overdensities are, and to establish how their baryonic content and star formation activity evolve as these early structures mature into present-day galaxy clusters.
Data availability
The specific observations analysed in this work can be accessed via https://doi.org/10.5281/zenodo.13871850
Acknowledgments
We would like to thank the anonymous referee for their positive and constructive report and all the observers world-wide for their substantial effort in securing all the public JWST data that were essential for this work. The Cosmic Dawn Center (DAWN) is funded by the Danish National Research Foundation under grant DNRF140. KEH acknowledges support from the Independent Research Fund Denmark (DFF) under grant 5251-00009B and co-funding by the European Union (ERC, HEAVYMETAL, 101071865). Views and opinions expressed are, however, those of the authors only and do not necessarily reflect those of the European Union or the European Research Council. Neither the European Union nor the granting authority can be held responsible for them. This work is based in part on observations made with the NASA/ESA/CSA James Webb Space Telescope. The data were obtained from the Mikulski Archive for Space Telescopes (MAST) at the Space Telescope Science Institute, which is operated by the Association of Universities for Research in Astronomy, Inc., under NASA contract NAS 5-03127 for JWST. We used the following software for this work: Python, and the scientific Python ecosystem, in particular NumPy (Harris et al. 2020), SciPy (including cKDTree) (Virtanen et al. 2021), Matplotlib (Hunter 2007), and Astropy (Astropy Collaboration 2013, 2018, 2022).
References
- Astropy Collaboration (Robitaille, T. P., et al.) 2013, A&A, 558, A33 [NASA ADS] [CrossRef] [EDP Sciences] [Google Scholar]
- Astropy Collaboration (Price-Whelan, A. M., et al.) 2018, AJ, 156, 123 [Google Scholar]
- Astropy Collaboration (Price-Whelan, A. M., et al.) 2022, ApJ, 935, 167 [NASA ADS] [CrossRef] [Google Scholar]
- Behroozi, P. S., Wechsler, R. H., & Conroy, C. 2013, ApJ, 770, 57 [NASA ADS] [CrossRef] [Google Scholar]
- Bennett, J. S., & Sijacki, D. 2020, MNRAS, 499, 597 [NASA ADS] [CrossRef] [Google Scholar]
- Bezanson, R., Labbe, I., Whitaker, K. E., et al. 2024, ApJ, 974, 92 [NASA ADS] [CrossRef] [Google Scholar]
- Bordoloi, R., Simcoe, R. A., Matthee, J., et al. 2024, ApJ, 963, 28 [NASA ADS] [CrossRef] [Google Scholar]
- Bosman, S. E. I., Davies, F. B., Becker, G. D., et al. 2022, MNRAS, 514, 55 [NASA ADS] [CrossRef] [Google Scholar]
- Calvi, R., Dannerbauer, H., Arrabal Haro, P., et al. 2021, MNRAS, 502, 4558 [NASA ADS] [CrossRef] [Google Scholar]
- Castellano, M., Pentericci, L., Vanzella, E., et al. 2018, ApJ, 863, L3 [CrossRef] [Google Scholar]
- Chen, W., Kelly, P., Castellano, M., et al. 2022, TNSAN, 257, 1 [Google Scholar]
- Chen, Z., Stark, D. P., Mason, C., et al. 2024, MNRAS, 528, 7052 [CrossRef] [Google Scholar]
- Chen, Z., Stark, D. P., Mason, C. A., et al. 2026, ApJ, 1001, 236 [Google Scholar]
- Chiang, Y.-K., Overzier, R., & Gebhardt, K. 2013, ApJ, 779, 127 [Google Scholar]
- Chiang, Y.-K., Overzier, R. A., Gebhardt, K., & Henriques, B. 2017, ApJ, 844, L23 [Google Scholar]
- Daddi, E., Rich, R. M., Valentino, F., et al. 2022, ApJ, 926, L21 [NASA ADS] [CrossRef] [Google Scholar]
- de Graaff, A., Brammer, G., Weibel, A., et al. 2025, A&A, 697, A189 [NASA ADS] [CrossRef] [EDP Sciences] [Google Scholar]
- Dekel, A., & Birnboim, Y. 2006, MNRAS, 368, 2 [NASA ADS] [CrossRef] [Google Scholar]
- Dekel, A., Birnboim, Y., Engel, G., et al. 2009, Nature, 457, 451 [Google Scholar]
- Ellison, S. L., Patton, D. R., Simard, L., & McConnachie, A. W. 2008, ApJ, 672, L107 [NASA ADS] [CrossRef] [Google Scholar]
- Fan, X., Strauss, M. A., Becker, R. H., et al. 2006, AJ, 132, 117 [NASA ADS] [CrossRef] [Google Scholar]
- Fudamoto, Y., Helton, J. M., Lin, X., et al. 2025, SAPPHIRES: A Galaxy Over-Density in the Heart of Cosmic Reionization at z = 8.47 [Google Scholar]
- Furtak, L. J., Zitrin, A., Weaver, J. R., et al. 2023, MNRAS, 523, 4568 [NASA ADS] [CrossRef] [Google Scholar]
- Gelli, V., Mason, C., Pallottini, A., et al. 2025, A&A, submitted [arXiv:2510.01315] [Google Scholar]
- Harris, C. R., Millman, K. J., van der Walt, S. J., et al. 2020, Nature, 585, 357 [NASA ADS] [CrossRef] [Google Scholar]
- Hashimoto, T., Álvarez-Márquez, J., Fudamoto, Y., et al. 2023, ApJ, 955, L2 [NASA ADS] [CrossRef] [Google Scholar]
- Heintz, K. E., Watson, D., Brammer, G., et al. 2024, Science, 384, 890 [NASA ADS] [CrossRef] [Google Scholar]
- Heintz, K. E., Brammer, G. B., Watson, D., et al. 2025, A&A, 693, A60 [Google Scholar]
- Heintz, K. E., Bennett, J. S., Oesch, P. A., et al. 2026, Nat. Astron., 10, 448 [Google Scholar]
- Helton, J. M., Sun, F., Woodrum, C., et al. 2024a, ApJ, 962, 124 [NASA ADS] [CrossRef] [Google Scholar]
- Helton, J. M., Sun, F., Woodrum, C., et al. 2024b, ApJ, 974, 41 [Google Scholar]
- Hunter, J. D. 2007, Comput. Sci. Eng., 9, 90 [NASA ADS] [CrossRef] [Google Scholar]
- Ishigaki, M., Ouchi, M., & Harikane, Y. 2016, ApJ, 822, 5 [NASA ADS] [CrossRef] [Google Scholar]
- Johnson, B. D., Leja, J., Conroy, C., & Speagle, J. S. 2021, ApJS, 254, 22 [NASA ADS] [CrossRef] [Google Scholar]
- Kashino, D., Lilly, S. J., Matthee, J., et al. 2023, ApJ, 950, 66 [CrossRef] [Google Scholar]
- Katz, N., Keres, D., Dave, R., & Weinberg, D. H. 2003, ASSL, 281, 185 [Google Scholar]
- Keating, L. C., Weinberger, L. H., Kulkarni, G., et al. 2019, MNRAS, 491, 1736 [Google Scholar]
- Kereš, D., Katz, N., Weinberg, D. H., & Davé, R. 2005, MNRAS, 363, 2 [Google Scholar]
- Kotiwale, G., Matthee, J., Kashino, D., et al. 2026, A&A, 706, A165 [NASA ADS] [CrossRef] [EDP Sciences] [Google Scholar]
- Laporte, N., Zitrin, A., Dole, H., et al. 2022, A&A, 667, L3 [NASA ADS] [CrossRef] [EDP Sciences] [Google Scholar]
- Lee, M. M., Tanaka, I., Kawabe, R., et al. 2019, ApJ, 883, 92 [NASA ADS] [CrossRef] [Google Scholar]
- Leja, J., Johnson, B. D., Conroy, C., van Dokkum, P. G., & Byler, N. 2017, ApJ, 837, 170 [NASA ADS] [CrossRef] [Google Scholar]
- Leonova, E., Oesch, P. A., Qin, Y., et al. 2022, MNRAS, 515, 5790 [NASA ADS] [CrossRef] [Google Scholar]
- Li, Q., Conselice, C. J., Austin, D., et al. 2025, Reionization in Protocluster Environments at z > 7 with JWST/NIRSpec [Google Scholar]
- Li, Q., Conselice, C. J., Sarron, F., et al. 2025, MNRAS, 539, 1796 [Google Scholar]
- Mandelker, N., Padnos, D., Dekel, A., et al. 2016, MNRAS, 463, 3921 [NASA ADS] [CrossRef] [Google Scholar]
- Marinacci, F., Vogelsberger, M., Pakmor, R., et al. 2018, MNRAS, 480, 5113 [NASA ADS] [Google Scholar]
- Mason, C. A., Trenti, M., & Treu, T. 2023, MNRAS, 521, 497 [NASA ADS] [CrossRef] [Google Scholar]
- Mason, C. A., Chen, Z., Stark, D. P., et al. 2026, A&A, 705, A114 [NASA ADS] [CrossRef] [EDP Sciences] [Google Scholar]
- Matthee, J., Mackenzie, R., Simcoe, R. A., et al. 2023, ApJ, 950, 67 [NASA ADS] [CrossRef] [Google Scholar]
- Miralda-Escude, J., Haehnelt, M., & Rees, M. J. 2000, ApJ, 530, 1 [CrossRef] [Google Scholar]
- More, S., Kravtsov, A. V., Dalal, N., & Gottlöber, S. 2011, ApJS, 195, 4 [NASA ADS] [CrossRef] [Google Scholar]
- Morishita, T., Liu, Z., Stiavelli, M., et al. 2025a, ApJ, 982, 153 [Google Scholar]
- Morishita, T., Stiavelli, M., Vanzella, E., et al. 2025b, ApJ, 985, 83 [Google Scholar]
- Morokuma-Matsui, K., Yajima, H., & Abe, M. 2025, MNRAS, 539, 1834 [Google Scholar]
- Naidu, R. P., Matthee, J., Oesch, P. A., et al. 2022a, MNRAS, 510, 4582 [CrossRef] [Google Scholar]
- Naidu, R. P., Oesch, P. A., van Dokkum, P., et al. 2022b, ApJ, 940, L14 [NASA ADS] [CrossRef] [Google Scholar]
- Naidu, R. P., Matthee, J., Kramarenko, I., et al. 2024, Open J. Astrophys., submitted [arXiv:2410.01874] [Google Scholar]
- Naiman, J. P., Pillepich, A., Springel, V., et al. 2018, MNRAS, 477, 1206 [Google Scholar]
- Nelson, D., Pillepich, A., Springel, V., et al. 2018, MNRAS, 475, 624 [Google Scholar]
- Nelson, D., Pillepich, A., Ayromlou, M., et al. 2024, A&A, 686, A157 [NASA ADS] [CrossRef] [EDP Sciences] [Google Scholar]
- Osterbrock, D. E., & Ferland, G. J. 2006, Astrophysics of Gaseous Nebulae and Active Galactic Nuclei (University Science Books) [Google Scholar]
- Overzier, R. A. 2016, Astron. Astrophys. Rev., 24 [Google Scholar]
- Pillepich, A., Nelson, D., Hernquist, L., et al. 2018, MNRAS, 475, 648 [Google Scholar]
- Planck Collaboration VI. 2020, A&A, 641, A6 [NASA ADS] [CrossRef] [EDP Sciences] [Google Scholar]
- Pollock, C. L., Gottumukkala, R., Heintz, K. E., et al. 2026, A&A, 708, A203 [NASA ADS] [CrossRef] [EDP Sciences] [Google Scholar]
- Robotham, A. S. G., Norberg, P., Driver, S. P., et al. 2011, MNRAS, 416, 2640 [NASA ADS] [CrossRef] [Google Scholar]
- Sanders, R. L., Shapley, A. E., Topping, M. W., Reddy, N. A., & Brammer, G. B. 2024, ApJ, 962, 24 [NASA ADS] [CrossRef] [Google Scholar]
- Schaye, J., Dalla Vecchia, C., Booth, C. M., et al. 2010, MNRAS, 402, 1536 [Google Scholar]
- Springel, V., Pakmor, R., Pillepich, A., et al. 2018, MNRAS, 475, 676 [Google Scholar]
- Suess, K. A., Weaver, J. R., Price, S. H., et al. 2024, ApJ, 976, 101 [Google Scholar]
- Tacchella, S., Finkelstein, S. L., Bagley, M., et al. 2022, ApJ, 927, 170 [NASA ADS] [CrossRef] [Google Scholar]
- Tepper-García, T. 2006, MNRAS, 369, 2025 [CrossRef] [Google Scholar]
- Terp, C., Heintz, K. E., Watson, D., et al. 2024, A&A, 690, A70 [NASA ADS] [CrossRef] [EDP Sciences] [Google Scholar]
- Totani, T., Kawai, N., Kosugi, G., et al. 2006, PASJ, 58, 485 [NASA ADS] [Google Scholar]
- Virtanen, P., Gommers, R., Burovski, E., et al. 2021, https://doi.org/10.5281/zenodo.4718897 [Google Scholar]
- Wang, X., Cantalupo, S., Wang, W., et al. 2026, A&A, 710, A65 [NASA ADS] [CrossRef] [EDP Sciences] [Google Scholar]
- Witstok, J., Maiolino, R., Smit, R., et al. 2025, MNRAS, 536, 27 [Google Scholar]
- Witten, C., Oesch, P. A., Bennett, J. S., et al. 2026a, A&A in press https://doi.org/10.1051/0004-6361/202558135 [Google Scholar]
- Witten, C., Oesch, P. A., McClymont, W., et al. 2026b, A&A, 709, A176 [NASA ADS] [CrossRef] [EDP Sciences] [Google Scholar]
- Wolfe, A. M., Gawiser, E., & Prochaska, J. X. 2005, ARA&A, 43, 861 [NASA ADS] [CrossRef] [Google Scholar]
Appendix A: Star formation rate comparison
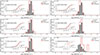 |
Fig. A.1. Normalized distributions of the star formation rate estimated from Hβ for the overdensity and field galaxies. The colours of the two distributions and the insets follow the same notation as in Fig. 5. |
Appendix B: UV slope comparison
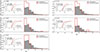 |
Fig. B.1. Normalized distributions of the UV slope, βUV, for the overdensity and field galaxies. The colours of the two distributions and the insets follow the same notation as in Fig. 5. |
All Tables
Computed physically motivated linking lengths (l), number densities (n), and effective survey volumes (V) for each redshift range.
Properties of each identified overdensity analysed in this work, including their respective redshifts, number of members (Ngal), δgal, and estimated dark matter halo masses given as log10(Mhalo/M⊙).
All Figures
|
Fig. 1. Spatial and redshift distribution of galaxies in the ALT catalog with overdensities marked. Spatial and redshift distribution of galaxies from the ALT catalog in the range 5.5 < z < 7. The horizontal axis shows the grism redshift (zgrism, ALT), while the vertical axis indicates the comoving offset in declination (ΔDec; [cMpc]). Marker size reflects the comoving offset in right ascension (ΔRA; [cMpc]), ranging from −6.5 to 5.3 cMpc, with larger symbols corresponding to larger offsets. Galaxies belonging to the five most significant overdensities identified by the FoF algorithm are shown in colour, while all field galaxies are displayed in gray. |
| In the text | |
|
Fig. 2. Projected spatial distribution of galaxies in the five largest overdensities identified in the ALT survey, plotted in comoving coordinates (RA vs. Dec). Each panel corresponds to a different overdensity, labeled by its mean redshift: (a) z = 5.66, (b) z = 5.77, (c) z = 6.24, (d) z = 6.34, and (e) z = 6.77. Individual galaxies are colour-coded by their line-of-sight velocity in kilometers per second relative to the group’s mean redshift and scaled based on their stellar mass. |
| In the text | |
|
Fig. 3. Dark matter halo mass versus redshift. Each overdensity is colour-coded following the notation of Fig. 1, with distinct symbols indicating the mass estimation method. Open colour-coded circles at z = 0 indicate the median descendant halo masses inferred from the UV-based halo masses, with error bars showing the standard deviation derived from tracing haloes in the IllustrisTNG simulations following the method described in Witten et al. (2026a). The gray shaded region shows the expected evolution of a Coma-like cluster (Chiang et al. 2013) assuming constant evolution beyond z ∼ 7. The horizontal dashed black line marks the shock stability threshold separating cold accretion from hot ICM formation (Dekel & Birnboim 2006), while the diagonal dashed line indicates the limit for penetrating cold flows. For comparison, overdensities from Helton et al. (2024a), Fudamoto et al. (2025), and Witten et al. (2026a) are shown with black, gray, and light green markers, respectively. |
| In the text | |
|
Fig. 4. Example SED fits and photometric data for two galaxies in two of the overdense environments at z = 5.64 (top) and z = 7.88 (bottom). Filled squares with error bars show the HST (dark blue) and JWST/NIRCam (light blue) photometry. The dark gray step curve displays the NIRSpec/prism spectrum. The orange solid line shows the best-fitting SED model including a DLA (SED+DLA), while the semi-transparent grey curve indicates the corresponding intrinsic SED model without the Lyα region from Naidu et al. (2024). Open orange squares represent the model-predicted photometry obtained from the SED+DLA model, and open grey squares show the photometry predicted by the intrinsic SED. The inferred NH I values are indicated in the upper right of each panel. |
| In the text | |
|
Fig. 5. Normalised distributions of stellar masses (log10(M★/M⊙)) for overdensity galaxies (red) and field galaxies (gray) in each of the five largest overdensities. Insets show the corresponding empirical cumulative distribution function (ECDFs) along with the KS statistic and p-value. |
| In the text | |
|
Fig. 6. Normalised distributions of Balmer break strength (DB) for the overdensity and field galaxies. The colours of the two distributions and the insets follow the same notation as in Fig. 5. |
| In the text | |
|
Fig. 7. Normalised distributions of the gas-phase metallicity proxy log10([O, III]/Hβ) for overdensity galaxies and field galaxies. The colours of the two distributions and the insets follow the same notation as in Fig. 5. The upper axes indicate the corresponding oxygen abundances, 12 + log(O/H) derived from the strong-line ratio from Sanders et al. (2024), for reference. |
| In the text | |
|
Fig. 8. Three-dimensional spatial distribution of galaxies in the five identified groups as well as the overdensity at z = 7.88, shown in comoving coordinates ΔRA, ΔDec, and grism redshift z. Each panel corresponds to one overdensity. Points are coloured by the best-fit neutral hydrogen column density log10(NHI): galaxies with log10(NHI) > 20 use a shared colour scale (right), while galaxies with log10(NHI)≤20 are shown in grey. A common colour bar is used for all high-NHI values to enable direct comparison across groups. In panel (f), the two galaxies observed with the NIRSpec prism and associated with ALT sources are highlighted with diamond symbols and coloured according to their prism-based NHI measurements. Square symbols denote additional galaxies with prism spectra that are not part of the ALT survey also coloured according to their prism-based NHI measurements. |
| In the text | |
|
Fig. 9. Mean neutral hydrogen column density of each overdensity as a function of its MUV-inferred halo mass. Each point corresponds to one overdensity and is colour-coded by redshift. Error bars indicate the dispersion in NHI among member galaxies. The dashed line and grey-shaded band represent the median NHI of field galaxies at z > 5 from Mason et al. (2026) and a 0.5 dex scatter. The green hexagon represent the estimated MUV-inferred halo mass of the z = 7.88 overdensity by Morishita et al. (2025b). |
| In the text | |
|
Fig. A.1. Normalized distributions of the star formation rate estimated from Hβ for the overdensity and field galaxies. The colours of the two distributions and the insets follow the same notation as in Fig. 5. |
| In the text | |
|
Fig. B.1. Normalized distributions of the UV slope, βUV, for the overdensity and field galaxies. The colours of the two distributions and the insets follow the same notation as in Fig. 5. |
| In the text | |
Current usage metrics show cumulative count of Article Views (full-text article views including HTML views, PDF and ePub downloads, according to the available data) and Abstracts Views on Vision4Press platform.
Data correspond to usage on the plateform after 2015. The current usage metrics is available 48-96 hours after online publication and is updated daily on week days.
Initial download of the metrics may take a while.