


Fig. 8.
Download original image
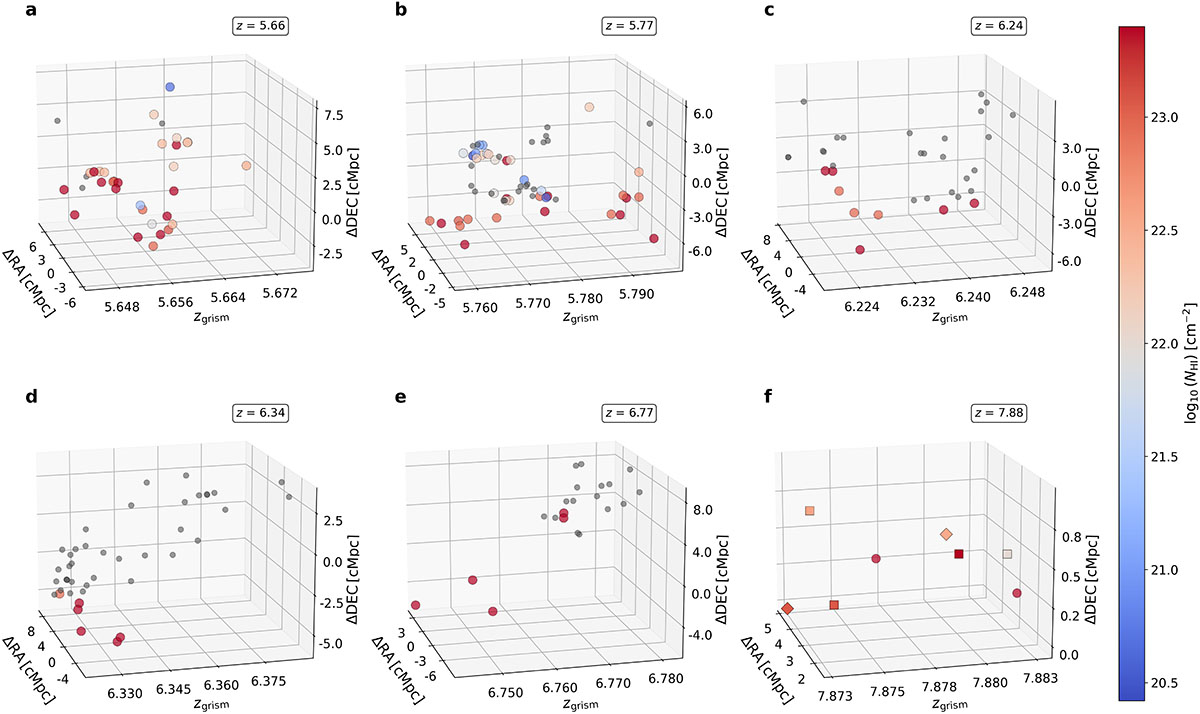
Three-dimensional spatial distribution of galaxies in the five identified groups as well as the overdensity at z = 7.88, shown in comoving coordinates ΔRA, ΔDec, and grism redshift z. Each panel corresponds to one overdensity. Points are coloured by the best-fit neutral hydrogen column density log10(NHI): galaxies with log10(NHI) > 20 use a shared colour scale (right), while galaxies with log10(NHI)≤20 are shown in grey. A common colour bar is used for all high-NHI values to enable direct comparison across groups. In panel (f), the two galaxies observed with the NIRSpec prism and associated with ALT sources are highlighted with diamond symbols and coloured according to their prism-based NHI measurements. Square symbols denote additional galaxies with prism spectra that are not part of the ALT survey also coloured according to their prism-based NHI measurements.
Current usage metrics show cumulative count of Article Views (full-text article views including HTML views, PDF and ePub downloads, according to the available data) and Abstracts Views on Vision4Press platform.
Data correspond to usage on the plateform after 2015. The current usage metrics is available 48-96 hours after online publication and is updated daily on week days.
Initial download of the metrics may take a while.