


Fig. 3.
Download original image
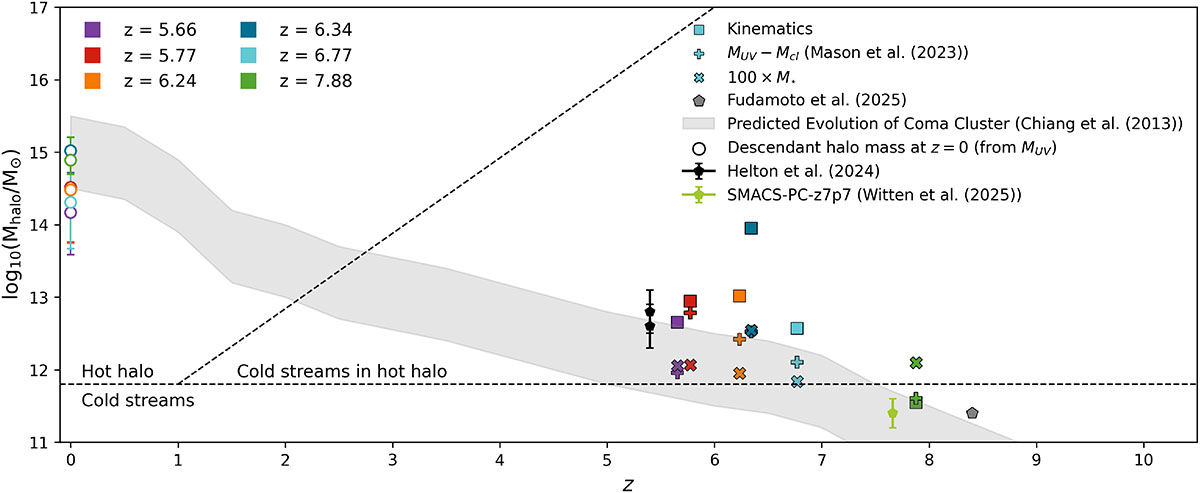
Dark matter halo mass versus redshift. Each overdensity is colour-coded following the notation of Fig. 1, with distinct symbols indicating the mass estimation method. Open colour-coded circles at z = 0 indicate the median descendant halo masses inferred from the UV-based halo masses, with error bars showing the standard deviation derived from tracing haloes in the IllustrisTNG simulations following the method described in Witten et al. (2026a). The gray shaded region shows the expected evolution of a Coma-like cluster (Chiang et al. 2013) assuming constant evolution beyond z ∼ 7. The horizontal dashed black line marks the shock stability threshold separating cold accretion from hot ICM formation (Dekel & Birnboim 2006), while the diagonal dashed line indicates the limit for penetrating cold flows. For comparison, overdensities from Helton et al. (2024a), Fudamoto et al. (2025), and Witten et al. (2026a) are shown with black, gray, and light green markers, respectively.
Current usage metrics show cumulative count of Article Views (full-text article views including HTML views, PDF and ePub downloads, according to the available data) and Abstracts Views on Vision4Press platform.
Data correspond to usage on the plateform after 2015. The current usage metrics is available 48-96 hours after online publication and is updated daily on week days.
Initial download of the metrics may take a while.