| Issue |
A&A
Volume 709, May 2026
|
|
|---|---|---|
| Article Number | A189 | |
| Number of page(s) | 10 | |
| Section | The Sun and the Heliosphere | |
| DOI | https://doi.org/10.1051/0004-6361/202659246 | |
| Published online | 13 May 2026 | |
Multiple magnetic flux ropes within reconnection exhausts close to the centers of heliospheric current sheets near the Sun
1
Department of Astronomy and Space Science, Chungbuk National University, Chungbuk 28644, Korea
2
Space Sciences Laboratory, University of California, Berkeley, CA, USA
3
ISR-1: Space Science and Applications, Los Alamos National Laboratory; New Mexico Consortium, Los Alamos, NM, USA
★ Corresponding author: This email address is being protected from spambots. You need JavaScript enabled to view it.
Received:
31
January
2026
Accepted:
28
March
2026
Abstract
Context. Magnetic flux ropes are frequently observed in association with magnetic reconnection in space plasmas, yet their formation, evolution, and observational visibility are not fully understood, particularly with respect to the near-Sun heliosphere.
Aims. We investigate the properties and origin of magnetic flux ropes embedded within reconnection exhausts during heliospheric current sheet (HCS) crossings close to the Sun. We assess the conditions under which such structures are most readily identifiable in in situ measurements.
Methods. We analyzed high-resolution magnetic field and plasma observations from Parker Solar Probe (PSP) during two consecutive HCS crossings, separated by ∼10.5 hours, at a heliocentric distance of ∼12 R⊙. Flux ropes were identified, with particular attention paid to intervals when PSP traversed the HCS central regions.
Results. For each crossing, we identified a series of flux ropes embedded within reconnection exhausts. Their passage durations are below 20 seconds, corresponding to spatial scales of a few thousands kilometers. This result is still greater by three orders of magnitude than the ion inertial length. This identification was possible particularly during intervals when PSP was closest to the central region of HCS. These flux ropes can be distinguished from the background exhausts by enhancements in magnetic field strength, which are shown to be particularly significant in the guide field component. In addition, they travel at speeds that diverge slightly (typically by < 10 km/s) from the speeds of the surrounding outflows, along with the possibility of increased density and reduced temperatures.
Conclusions. We attributed the origin of magnetic flux ropes to a secondary reconnection within the exhausts and subsequent merging of smaller flux ropes into larger structures, consistent with predictions by various simulations. We stress that such flux ropes are most readily identifiable at the HCS center, where the background magnetic field is weakest, so that the relative enhancement in flux rope field becomes most prominent. This observational advantage is particularly notable closer to the Sun, where the high ambient magnetic field strength can otherwise obscure such structures, unless the spacecraft trajectory remains within the HCS central region for a sufficient duration.
Key words: Sun: heliosphere / Sun: magnetic fields / solar wind / interplanetary medium
© The Authors 2026
 Open Access article, published by EDP Sciences, under the terms of the Creative Commons Attribution License (https://creativecommons.org/licenses/by/4.0), which permits unrestricted use, distribution, and reproduction in any medium, provided the original work is properly cited.
This article is published in open access under the Subscribe to Open model. This email address is being protected from spambots. You need JavaScript enabled to view it. to support open access publication.
1. Introduction
Magnetic flux ropes of various sizes are widely recognized as important structures in space and astrophysical plasmas, with significant implications for energy transport, particle acceleration, and magnetic topology. Their origin and evolution are of particular interest across diverse environments, including planetary magnetospheres, the solar corona, and the heliosphere. The launch of Parker Solar Probe (PSP) has enabled unprecedented access to the near-Sun solar wind, enabling the identification of flux ropes closer to the Sun than ever before. Recent studies using PSP data have reported flux ropes with durations ranging from several minutes to multiple days at heliocentric distances of ∼0.1–0.3 AU (e.g., Drake et al. 2021; Zhao et al. 2020, 2021; Chen et al. 2020, 2021; Chen & Hu 2022; Chen et al. 2023).
In the present study, we focus on small-scale magnetic flux ropes (SMFRs), which are a common component of the interplanetary solar wind, as documented in numerous previous studies. Although they share many of the basic magnetic and plasma properties of larger-scale flux ropes, such as magnetic clouds, SMFRs are distinguished by their much smaller scales, with typical durations from tens of seconds to less than about one hour and spatial sizes from a few hundred kilometers to ∼10−3 AU (e.g., Chen & Hu 2022). Of particular relevance here is their possible relationship to the heliospheric current sheet (HCS). A number of studies have suggested that at least some SMFRs might form in association with (or in close proximity to) the HCS (Moldwin et al. 2000; Feng et al. 2015; Sanchez-Diaz et al. 2019; Lavraud et al. 2020; Réville et al. 2020).
In addition, we pay particular attention to the relationship between small-scale flux ropes and magnetic reconnection, which is a fundamental plasma process of broad relevance in both space and astrophysical contexts. Reconnection is widely regarded as a viable mechanism for the generation of small-scale magnetic flux ropes both in the solar corona (Drake et al. 2021; Lavraud et al. 2020; Réville et al. 2020, 2022) and in the solar wind, particularly in the vicinity of the HCS (Moldwin et al. 2000; Cartwright & Moldwin 2008; Higginson & Lynch 2018; Sanchez-Diaz et al. 2019; Lavraud et al. 2020).
For instance, simulations have demonstrated the formation and evolution of flux ropes produced by reconnection at the top of the helmet streamer belt within 30 R⊙ (e.g., Higginson & Lynch 2018). Several PSP observations have shown density blobs and flux ropes released from the tips of helmet streamers close to the Sun (Lavraud et al. 2020; Choi et al. 2024; Liewer et al. 2024), all attributed to reconnections.
Indeed, reconnection exhausts during a crossing of HCSs have long been reported at 1 AU (Gosling et al. 2005; Lavraud et al. 2009) and more recent studies have revealed that such signatures are far more frequent closer to the Sun (Phan et al. 2020, 2021, 2024). These reconnection exhausts are often identified by such characteristics as plasma flow jets in association with electron strahl and a bifurcated magnetic field structure (e.g., Gosling & Szabo 2008). Notably, even ion scale bifurcated current sheets (ranging in thickness of ∼20–2000 ion inertial length) with flow jets have been identified within the HCS exhaust close to the Sun, implying secondary reconnections within the exhaust of the primary reconnection (Phan et al. 2024). Secondary reconnection has been widely considered a major mechanism for generating flux ropes of a small scale, which subsequently undergo a merger with each another (Matthaeus & Lamkin 1986; Drake et al. 2006; Servidio et al. 2009; Lapenta et al. 2015; Comisso et al. 2016; Dong et al. 2018; Arró et al. 2020; Arnold et al. 2021; Eriksson et al. 2022; Desai et al. 2025).
In the present study, we report on two consecutive HCS crossings, each revealing a series of small-scale (but still much larger than ion inertial length) magnetic flux ropes identified within reconnection exhausts, particularly during intervals when PSP was closest to the center of the HCS. These observations were made over a limited time window when PSP was retrograding in the Sun’s rotating frame near the Sun at a heliocentric distance of ∼12 R⊙, near the perihelion of encounter #17. This period coincided with solar maximum conditions, during which the HCS was highly warped, observed as two closely spaced HCS crossings by PSP.
The paper is organized as follows. Section 2 provides an overview of the two consecutive HCS crossing events. Section 3 presents detailed observations of a series of flux ropes embedded within the reconnection exhausts near the HCS center. Discussion and conclusions are provided in Section 4.
2. Overview of two consecutive HCS crossings
Figures 1a and b present the suprathermal electron flux and radial component of the magnetic field in the radial-tangential-normal (RTN) coordinate system. These observations clearly indicate that PSP encountered two HCSs on 2023 September 27 and 28, at heliocentric distances of ∼11.6 R⊙ and ∼12.1 R⊙, respectively. These crossings were separated by ∼10.5 hours, one occurring several hours before perihelion and the other several hours after. The potential field source surface (PFSS) model map from the Wilcox Solar Observatory (Hoeksema et al. 1983) in Fig. 1c shows that the two HCS planes encountered by PSP were highly inclined relative to the heliographic equator, consistent with the complex magnetic topology expected during solar maximum. In addition, the PFSS solution indicates that the two HCS structures encountered by PSP were separated by ∼40° in Carrington longitude.
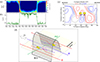 |
Fig. 1. Two consecutive crossings of a highly warped HCS and associated magnetic reconnection. (a, b) Pitch-angle distribution of 433 eV suprathermal electrons and radial magnetic field component BR observed by PSP during an interval surrounding perihelion (r ≈ 11.4 R⊙) on September 27-28, 2023. (c) PFSS model map of the coronal magnetic field at r = 2.5 R⊙, showing the projected PSP locations at the times of the two HCS crossings. (d) Schematic illustration of the two consecutive crossings of the warped HCS by PSP on September 27 and 28, along with associated magnetic reconnection sites. |
Figure 1d schematically illustrates the geometry of these crossings through a highly warped current sheet, guided by the PFSS solution. During the first crossing event on September 27, PSP’s motion was primarily in the tangential (T) direction with a speed of VT = 173 km/s, and slightly sunward at VR = −24 km/s. At the second crossing event on September 28, PSP’s motion was similar, with VT = 164 km/s and slightly anti-sunward component of VR = 43 km/s. During both crossings, PSP at these speeds was retrograding in the Carrington rotation frame (as evident from the PFSS map). Reconnection occurring at both HCSs is also illustrated schematically in Fig. 1d.
In the following section, we describe in detail the occurrence of magnetic reconnection at both HCS crossings, with particular emphasis on the series of magnetic flux ropes embedded within the reconnection exhausts. For the analysis, we use in situ observations from the PSP FIELDS instrument suite (Bale et al. 2016), which provides DC magnetic field measurements from fluxgate magnetometers (MAG). The PSP SWEAP instrument suite (Kasper et al. 2016) provides the proton density, velocity, and temperature from the SPAN-ion instrument (Livi et al. 2022) and the pitch angle distribution of suprathermal electrons from the Solar Probe Analyzer Electron (SPAN-E) instrument (Whittlesey et al. 2020).
3. Series of flux ropes embedded within reconnection exhausts
3.1. Case of 2023 September 27
The data relevant to the HCS crossing on this date are presented in Fig. 2, where we have identified the full HCS crossing interval over ∼8 mins (two dashed vertical lines). This interval is characterized by well-known features including (i) the reversal of electron strahl direction from 180° before this interval to 0° after it (Fig. 2a); (ii) the overall notable decrease of the magnetic field magnitude despite intermittent recoveries to near pre-crossing levels (Fig. 2b); and (iii) the complete polarity reversal in the asymptotic values of the radial component of the magnetic field, BR, shifting from ∼−650 nT to ∼+650 nT, before and after this interval, respectively (Fig. 2c), which is consistent with the strahl direction change.
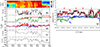 |
Fig. 2. Observations of the HCS crossing on September 27, 2023. (a) Pitch-angle distribution of 433 eV suprathermal electrons. (b) Magnetic field magnitude |B|, with red arrows marking four enhancement events. (c) Radial magnetic field component BR, with the horizontal double-sided red arrow indicating the interval of main interest. (d) Tangential (BT, blue) and normal (BN, red) magnetic field components. (e) Radial component of the solar wind velocity VR. (f) Proton number density Np. (g) Expanded view of the magnetic field data during the ∼2.2-minute interval marked in panel c, showing the four enhancement events in detail. |
Evidence for magnetic reconnection at this HCS can be drawn as follows. First, during the identified HCS crossing interval, the radial flow VR in Fig. 2e exhibits an overall reduction, occurring intermittently and most prominently when PSP was passing close to the HCS center. In addition, Fig. 2a indicates the existence of overall counter-streaming electron strahl throughout the full crossing time (despite the simultaneous existence of increased electron fluxes at all pitch angles). The drop in VR in the Sun’s frame in combination with the bi-directional strahl is a well-established signature of a reconnection outflow jet when PSP traverses the sunward side of a reconnection X-line (Gosling et al. 2006; Phan et al. 2020, 2021).
To address the HCS and reconnection properties effectively (and flux ropes below), we defined a local current sheet coordinate system (X, Y, Z). Specifically, we determined the local XYZ coordinates using the hybrid method as used in Fargette et al. (2021) and Eriksson et al. (2022). The current-sheet normal was first defined by the cross product of the magnetic fields on the two sides of the sheet,  , where B1 and B2 denote average upstream and downstream magnetic fields. The maximum-variance direction, xm, was then obtained from minimum variance analysis (MVA), and the orthogonal axes are constructed as
  , and
, and  . This yields a right-handed XYZ frame in which X approximates the reconnecting-field direction, Y the out-of-plane (guide field) direction, and Z the current sheet normal.
Based on this current-sheet coordinate system, we identify several basic features. First, the HCS normal vector is given by [−0.02, 0.65, −0.76] in the RTN coordinates, representing the orientation and tilt of the current sheet relative to the RTN axes. Second, the estimated guide field magnitude of the HCS is ∼25 nT, and the magnetic shear angle across the HCS is ∼176°, indicating the HCS is nearly antiparallel. Third, using the relative PSP crossing speed along the current-sheet normal of  km/s, together with the exhaust duration of ∼480 s, we estimate a local exhaust width, W, of ∼5.8 × 10⁴ km or ∼0.084 R⊙. Assuming a quasi-steady wedge-shaped reconnection exhaust with W ∼ 2RLx and adopting a nominal reconnection rate of R ∼ 0.1, the inferred PSP distance from the X-line is Lx ∼ 2.96 × 10⁵ km (or ∼0.42 R⊙). Lastly, the Walén relation test (Paschmann et al. 1986) at the exhaust boundaries reveals that the exit boundary exhibits a reasonably Alfvénic response in the reconnecting X direction, with ΔVx/ΔVA, x ≈ 0.77, whereas the entry boundary is much less Walén-like (ΔVx/ΔVA, x ≈ −0.34).
We stress that the magnetic field intensity (Fig. 2b) is weakest for an interval of several minutes, starting from ∼19:52 UT, which is also when the magnitude of BR is the smallest (Fig. 2c), implying the closest approach of PSP to the HCS center. At other times, PSP’s position varied relative to the HCS center and it was often located much away from the HCS center.
We have drawn particular attention to four instances of enhanced magnetic field strength (marked by red vertical arrows in Fig. 2b), occurring within a ∼2.2-minute interval (marked by the horizontal double-sided red arrow in Fig. 2c). These events are notably characterized by distinct increases in the normal component of the magnetic field, BN (see the red line in Fig. 2d). This feature is more clearly illustrated in Fig. 2g, which zooms in on the 2.2 min interval and highlights the four B enhancement events (red vertical arrows) despite the presence of large-amplitude compressive oscillations observed in all three magnetic field components at a low frequency of ∼0.2 Hz, much lower than the local proton gyrofrequency for B = 250 nT (∼3.8 Hz). The B enhancements range from ∼40% to ∼50% relative to the neighboring field magnitude.
Now, we focus on and examine the detailed features during the ∼2.2 min interval within which the four instances of enhanced B have been identified. The relevant data are shown in Fig. 3, where the four events are highlighted based on their B enhancements. Each event lasts ∼12–18 seconds corresponding to spatial scales of several thousand kilometers (∼10−5 AU ≈ 10−3 R⊙), which are significantly larger (by three orders of magnitude) than the local proton inertial length of ∼2.6 km. The four events are separated by a few to < 20 seconds from one another.
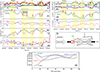 |
Fig. 3. Detailed observations for the ∼2.2-minute interval highlighted in Fig. 2. (a) Magnetic field components in RTN coordinates. (b) Magnetic field components in the local current sheet coordinate system (X, Y, Z). (c) Magnitude of the solar wind bulk velocity |V| and its radial component VR in RTN coordinates. (d) VX in the current sheet coordinates. (e) Tangential and normal velocity components, VT and VN, in RTN. (f) VY and VZ in the current sheet coordinates. (g) Proton number density. (h) Parallel and perpendicular components of the proton temperature (T∥ and T⊥). (i) Schematic illustration of magnetic reconnection at the HCS, showing magnetic flux ropes (FRs) embedded within the reconnection exhaust region, the local current sheet coordinate system (X, Y, Z), and PSP passage (green). (j) Average suprathermal electron flux (433 eV) vs. pitch angle during each of the four events (highlighted in yellow). |
Several important features are evident. First, the B enhancements are dominated by increases in BN (red in Fig. 3a). Following the method of Eriksson et al. (2022), we transformed the plasma flow and magnetic field observations from the RTN coordinate system into a local current sheet coordinate system (X, Y, and Z), as demonstrated above and depicted in Fig. 3i. In this current sheet coordinate system, BX corresponds to the component of the magnetic field that reconnects across the HCS (aligned with the reconnection exhaust direction), BY corresponds to the guide field component, and BZ is the component normal to the current sheet. Figure 3b displays the magnetic field in this transformed coordinate system, indicating that the B enhancements are caused significantly by the magnitude increases of the guide field component, BY (red), rising from the surrounding values of ∼60–100 nT to peak values of ∼160–240 nT, and by similar increases of BZ magnitude (blue) together. In contrast, |BX| (olive) remains comparatively small throughout most of the interval. These observations suggest the enhanced magnetic field vectors are inclined by ∼45° primarily relative to the current sheet plane (X − Y plane). Second, each of the four events is associated with a further decrease in |V| (vertical magenta arrows in Figs. 3c and 3d), which is largely governed by VR (or, equivalently, VX in the current sheet coordinate system). The magnitude of this subscale velocity drop is slightly over 10 km/s for event 4 and several km/s for the other three events. Lastly, each magnetic enhancement is accompanied by an increase in plasma density (Fig. 3g) and a decrease in temperature (Fig. 3h), as indicated by vertical arrows in the corresponding panels. The temperature decrease manifests mostly in both components of the temperature tensor, although it is overall less pronounced than the associated density increases.
These features have led us to interpret the four events as distinct “flux ropes” embedded within the reconnection exhaust. They move sunward (in the ambient solar wind frame) at speeds that are slightly greater than those of the surrounding sunward outflows of the exhaust. Their differing propagation speeds might cause some velocity shear between the flux ropes and the surrounding outflows.
The geometrical features of these flux ropes can be inferred as follows. First, the suprathermal electron data provides information on the solar connectivity of the flux ropes (e.g., Choi et al. 2021). Figure 3j indicates the existence of counter-streaming strahl for three events (except for event 1), implying the possibility of closed field line topology for the three events. Second, the rotational nature of the magnetic field associated with these flux ropes is revealed in hodogram plots constructed from the maximum and intermediate variance components, Bmax and Bint, obtained through MVA. As shown in Fig. 4, clear rotational patterns are evident in all four events. This supports their interpretation as flux-rope-like structures. Notably, event 1 appears to consist of two distinct rotations, indicated by the red arrows, suggesting the presence of two closely spaced or partially overlapping flux ropes. A clear bipolar signature (i.e., a full sign reversal of a magnetic field component) is not observed in these hodograms. However, it does not preclude a flux-rope interpretation; instead, it likely reflects either the stronger ambient magnetic field than the flux rope field masking the intrinsic rotation feature or a grazing spacecraft trajectory that intercepted only part of the flux-rope cross section.
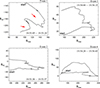 |
Fig. 4. Hodograms of Bmax and Bint determined from minimum variance analysis for the four events identified in Fig. 3. Prior to performing the minimum variance analysis, the magnetic field data were smoothed using a Savitzky–Golay filter to reduce high-frequency fluctuations that could otherwise bias the determination of the variance directions. |
Lastly, we assessed the degree of Alfvénic nature and fluctuation energy partition during the identified flux rope intervals. This was done by estimating the normalized cross helicity (σc) and normalized residual energy (σr), which quantify the correlation between velocity and magnetic-field fluctuations and the relative dominance of kinetic versus magnetic fluctuation energy, respectively (Zhao et al. 2021). Alfvénic fluctuations are characterized by |σc|→1 and σr ≈ 0, whereas coherent magnetic structures such as a flux rope are expected to exhibit weak Alfvénicity and magnetic-energy dominance, |σc|→0 and σr < < 0. For each flux rope event that we identified in Fig. 3, we computed time-dependent normalized cross helicity and residual energy within the shaded intervals in Fig. 3. The results are summarized in Fig. 5 (the corresponding values for the flux rope events during the September 28 HCS crossing are also included to highlight the statistical consistency of the essentially same trend; a detailed description of the September 28 events will be described in the next section). In Fig. 5 all events cluster in the magnetically dominated regime (σr < 0) with |σc|≪1, indicating weak Alfvénicity. This behavior supports the interpretation of these structures as coherent magnetic flux ropes embedded in reconnection exhausts.
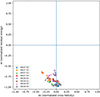 |
Fig. 5. Normalized cross helicity (σc) versus normalized residual energy (σr) for the eight flux rope structures (named E1, E2, etc.) identified on 2023 September 27 (Fig. 3) and 28 (Figure 7). Each symbol corresponds to one flux-rope event, and the multiple points associated with each symbol represent time-dependent σc–σr values computed within the shaded interval of the event (Figs. 3 and 7.) |
3.2. Case on 2023 September 28
The relevant data for the September 28 crossing are shown in Fig. 6 in the same format as Fig. 2. The two black vertical lines mark the full crossing interval of this HCS that we identify. This identification is based on the pronounced changes in the magnetic field magnitude (panel b), BR (panel c), and the plasma radial flow speed, VR, and density (panels e and f). In addition to the sharp changes in BR at the two edges of this interval, there is an additional sharp change at ∼06:36 UT (yellow vertical line). Between each pair of these sharp transitions, BR exhibits a plateau-like behavior suggesting that the current sheet possibly consists of multiple closely spaced current layers (most likely being trifurcated) rather than a single, monolithic sheet.
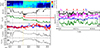 |
Fig. 6. Observations of the HCS crossing on September 28, 2023, in the same format as Fig. 2. Note: panel g shows an expanded view of the magnetic field data over a 3-minute interval, highlighting four B enhancement events and the significance of the normal component. In panel g, −BN (magenta) is shown for easier comparison with the total B (black). |
During the HCS crossing interval, the radial solar wind speed VR (Fig. 6e) is significantly enhanced (up to ∼350 km/s) relative to that of the surrounding plasma (∼200 km/s), strongly suggesting that PSP encountered a reconnection outflow jet on the anti-sunward side of an X-line. The detailed structure of the flow, however, appears to be nonuniform. In particular, a modest decrease in VR is observed after ∼06:36 UT (yellow vertical line). This reduction in VR might simply reflect PSP’s transition into a weaker portion of the same anti-sunward jet, consistent with a velocity profile that varies across the reconnection exhaust. Alternatively, although this possibility is not explicitly verified here, such a decrease in VR could be caused by the presence of an additional reconnection site embedded within the exhaust region, which could generate a jet opposite to the primary jet (Eriksson et al. 2022; Phan et al. 2024).
On the anti-sunward side of an X-line, a dropout of suprathermal electron strahl is generally expected if the newly reconnected field lines are disconnected from the Sun. In the present event, such strahl suppression is indeed observed during the early part of the crossing, from the HCS entry until ∼06:36 UT (yellow vertical line). After this time, however, a weak but identifiable strahl intermittently reappears, primarily at pitch angles near 180°, and occasionally near 0°, along with faint populations over other pitch angles. This evolution suggests that during the latter portion of the interval the spacecraft might have sampled the field lines that remain magnetically connected to the Sun, albeit with a substantially diminished suprathermal electron source.
As in the case of the September 27 HCS crossing event discussed in Section 3.1, we identify several basic features in the current-sheet coordinate system. First, the HCS normal vector is given by [−0.04, 0.81, −0.59] in the RTN coordinates, indicating the orientation of the current sheet relative to the RTN axes. Second, the HCS has an estimated guide field magnitude of ∼41 nT and a magnetic shear angle of ∼173°, indicating it is also nearly antiparallel. Third, using the relative PSP crossing speed along the current-sheet normal of ∼142 km/s together with the exhaust duration of ∼2580 s, we estimate a local exhaust width W of ∼3.17 × 10⁵ km or ∼0.46 R⊙, about five times thicker than the September 27 exhaust. Again assuming a quasi-steady wedge-shaped reconnection exhaust with W ∼ 2RLx and adopting a nominal reconnection rate R ∼ 0.1, the inferred PSP distance from the X-line is Lx ∼ 1.58 × 10⁶ km, or ∼2.28 R⊙. These estimates are subject to uncertainty because the observed flow and strahl structure suggest that the exhaust may be more complex than the simple quasi-steady single-X-line geometry assumed here. Finally, the Walén relation evaluated at the exhaust boundaries (∼06:18:30 and ∼06:58:00) indicates a marked asymmetry: the entry boundary shows a strong Alfvénic response in the reconnecting direction, with ΔVx/ΔVA, x ≈ −0.93, whereas the exit boundary does not show a clear Walén response (ΔVx/ΔVA, x ≈ 0.1).
We focus in particular on a few minute interval (horizontal arrow in Fig. 6c), during which the magnetic field magnitude is at its lowest (Fig. 6b), that of BR is also very small (Fig. 6c) and magnetic field fluctuations are most prominent. Figure 6g shows a zoomed-in view of the magnetic field data for this short interval. Despite the compressive MHD-timescale oscillations of a high amplitude observed across all three magnetic field components, we identified four intervals of enhanced B (red vertical arrows), similar to the case observed during the September 27 event described in the previous section.
In Fig. 7, we provide the relevant data for this short interval in the same format as Fig. 3. These flux ropes are characterized by enhanced B by ∼40% relative to the neighboring field magnitude. Each event lasts for ∼4 to 12 seconds, corresponding to spatial scales of several thousands of kilometers (i.e., far larger than the ion inertial length of ∼2.1 km). The separation between adjacent events ranges from ∼6 to 24 seconds.
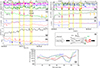 |
Fig. 7. Detailed observations for the 3-minute interval highlighted in Fig. 5 in the same format as Fig. 3. Note: −BN (magenta) is shown in panel a and |V| (black) in panel d for easier comparison with other parameters. In panel b, the enhanced portions in BY magnitude are highlighted by thick red segments and black arrows. |
Key features associated with these flux ropes are similar to those found in the September 27 case, although some are less obvious in this crossing. In particular, two features most clearly distinguish the flux ropes from the surroundings. First, the B enhancements are caused by increases in BN dominanting over the other two components for events 3 and 4 and (to a lesser extent but still noticeably) for events 1 and 2 (magenta for −BN in Fig. 7a). In the current-sheet coordinate system (depicted in Fig. 7i), the normal vector of which is given by [−0.04, 0.81, −0.59] in RTN coordinates, this trend is similarly reflected in enhancements of the guide field component magnitude |BY|, with the enhanced portions in |BY| highlighted by the thick red segments and black arrows seen in Fig. 7b. The average increase in |BY| during each event, relative to the surrounding average |BY| (calculated over a 24-s window around each event) ranges from ∼22.6% (event 2) to ∼53.5% (event 1). Second, each of the four events are associated with a decrease in |V| (vertical red arrows in Fig. 7c) primarily driven by changes in VR. This is equivalently (and more clearly) reflected as the increase in VX in the local current-sheet coordinate system (vertical red arrows in Fig. 7d), although the magnitude of these velocity changes is less than 10 km/s.
On the other hand, the association with density variations is not consistent across all events (Fig. 7g): a density enhancement may be observed for event 4, while clear variations are not apparent for the other three flux ropes. Figure 7h indicates that a decrease in temperature in at least one component of the temperature tensor may be identifiable for events 1 and 2, but not for events 3 and 4.
Additionally, as in the case of the September 27 event, the following geometrical aspects can be inferred. Figure 7j shows that these flux ropes are mostly associated with counter-streaming strahls, implying closed field lines. Figure 8 presents hodograms of the maximum and intermediate variance components, Bmax and Bint, obtained through MVA, indicating magnetic field rotations consistent with flux-rope-like structures.
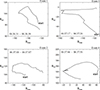 |
Fig. 8. Hodograms of Bmax and Bint determined from minimum variance analysis for the four events on September 28 identified in Fig. 7. |
For the flux rope events during the September 28 HCS crossing, we carried out the same cross-helicity and residual-energy analysis as those applied to the September 27 events. The resulting σc–σr distributions are shown in Fig. 5. As in the September 27 case, all identified flux-rope events cluster in the magnetically dominated regime (σr < 0) with |σc|≪1, indicating weak Alfvénicity and a clear dominance of magnetic fluctuation energy. The close correspondence between the two HCS crossings demonstrates that the σc–σr characteristics of these small-scale structures are not event-specific; instead, they represent a robust and recurring feature of flux ropes embedded within reconnection exhausts.
Following event 4, we also identified an interval of approximately 50 seconds (indicated by the horizontal double-sided arrows at the top of Figs. 7a and 7b), when a group of closely packed magnetic field enhancements is observed. In contrast to the four main events, the contributions from BN to these enhancements are much less prominent or not clearly discernible. Although a further decrease in |V| is identifiable in at least two instances (vertical dark yellow arrows in Figs. 7c and 7d) within this interval, the association between these multiple magnetic enhancements and plasma parameters is generally less distinct than in the four main events. For this reason, we regard this interval as a minor feature that is noted for completeness, but we did not examine it with the same level of detail as the four main events.
4. Discussion and conclusion
We emphasize that the flux ropes are most clearly identifiable near the HCS center, where the background magnetic field is weakest and the relative enhancement in magnetic field strength within the flux rope becomes most prominent. This effect is particularly notable closer to the Sun, as well as in the cases we cover here, at heliocentric distances of ∼12 R⊙. At these distances, the ambient magnetic field is typically a few hundred nanotesla, making it more difficult for a flux rope to be distinguished from a higher B environment unless the spacecraft passes close enough to the HCS center for a sufficient temporal duration. As these flux ropes are convected outward, they may expand due to the declining background pressure. In such regions where the surrounding magnetic field is even weaker, the likelihood of encountering these structures as distinct entities (potentially even at locations offset from the current-sheet center) increases.
A relevant example that this conjecture can be applied consists of a series of magnetic flux ropes, as reported by Choi et al. (2024). They are characterized by enhanced B and lower density and temperature in a narrow Carrington longitudinal range observed by PSP at r ∼ 35–44 R⊙, which is significantly farther from the Sun than our observation points near ∼12 R⊙. Each of their flux ropes lasted from ∼0.5 to 1.8 hours and they are much larger in scale than those observed in our study, which lasted only seconds to tens of seconds. The authors attributed these observations to successive passage of flux ropes likely resulting from successive magnetic reconnection at one or more sites closer to the Sun than PSP. An important distinction between their observations and ours is that their flux rope locations were not close to the HCS center, detected without a HCS crossing by PSP, and no direct signatures of reconnection exhaust were found. However, we speculate that their flux ropes may have expanded substantially during outward propagation, allowing PSP to encounter them even when positioned some distance away from the HCS center.
While alternative origins cannot be excluded, a likely origin of the flux ropes observed within the reconnection exhaust is secondary reconnection driven by either outflow turbulence or plasmoid instability (Matthaeus & Lamkin 1986; Drake et al. 2006; Servidio et al. 2009; Lapenta et al. 2015; Comisso et al. 2016; Dong et al. 2018; Arró et al. 2020; Arnold et al. 2021; Eriksson et al. 2022; Phan et al. 2024; Desai et al. 2025) occurring within the HCS. For example, full particle simulations by Drake et al. (2006) show that when secondary reconnection develops under a guide field, the secondary islands grow to finite size before merging with the main magnetic island and form strong core fields. During their formation, secondary islands compress the ambient out-of-plane magnetic field and therefore evolve into flux ropes with strongly enhanced core fields. This feature is consistent with our observations, in which the flux ropes exhibit pronounced core field enhancements within the reconnection exhaust. Additionally, in a recent report, Desai et al. (2025) commented on large variations in the normal component of the magnetic field during an HCS crossing at ∼16.25 R⊙, implying the presence of large-scale magnetic islands or flux ropes embedded within the reconnection exhaust; however, no detailed analysis of the observed flux ropes has been provided. This interpretation is also consistent with the structures observed in our two HCS crossing events. Moreover, simulations by Desai et al. (2025) did show that the HCS can develop multiple reconnection sites, resulting in the formation of a large population of flux ropes that merge dynamically during the system’s evolution. In their model, reconnection progresses through the initial formation of many small flux ropes, which subsequently coalesce into larger structures. Notably, the axial (guide) field component is found to increase significantly within the flux ropes relative to the upstream value, due to plasma compression in the reconnecting current layer. The simulation results align well with the key features observed in our events.
Taken together, all these observations and simulations indicate that the small-scale flux ropes identified in the present study are a meaningful manifestation of the multiscale and intermittent nature of reconnection in the near-Sun HCS. Their presence within the HCS exhaust, especially near the field-reversal region, supports a scenario in which the primary reconnection layer does not remain smooth and steady, but instead undergoes internal fragmentation into smaller magnetic islands and flux ropes through secondary reconnection and subsequent nonlinear evolution. Although these structures are probably too small to modify the global HCS dynamics on their own, they provide evidence that the reconnecting HCS can process magnetic flux, plasma, and energy through localized, transient substructures embedded within the larger exhaust. More broadly, we find that this implies the near-Sun HCS could serve as a source region of hierarchically organized flux-rope populations, with some structures potentially growing, interacting, and merging as they propagate outward into the heliosphere.
We note an interesting report on magnetic field increases with current sheets, as observed by PSP (Fargette et al. 2021). These events were referred to as interplanetary field enhancements and interpreted in terms of interlinked flux tubes, similar to those related to flux transfer events at the Earth’s magnetopause (Fargette et al. 2020, and references therein). These events in Fargette et al. (2021) are characterized by increases in magnetic field magnitude by over 30% with a central current sheet, with some events occurring near HCSs. These authors further argued that the observations are broadly consistent with a double-flux-tube configuration produced by the interaction of initially distinct flux tubes during solar-wind propagation. However, we note that those nearby-HCS events are much longer-lived with durations mostly from minutes to nearly two hours, have a low-plasma β condition, and were found at r ∼ 61 − 116 R⊙. By contrast, the flux ropes we identified in the present study are much more transient with durations < 20 s, have a high-plasma β condition and were found very close to the HCS centers at r ∼ 12 R⊙. Thus, despite a superficial similarity in involving magnetic enhancements and central current sheets, the structures studied here are unlikely to consist of the same phenomenon as the finding that “magnetic field increases with central current sheets” reported by Fargette et al. (2021). Instead, they seem to represent a much smaller scale, high-β, HCS-core population found a lot closer to the Sun.
Although force-free fitting (e.g. Moldwin et al. 2000; Chen et al. 2021; Choi et al. 2022, 2024) and Grad-Shafranov (GS) reconstruction (Chen et al. 2021; Chen & Hu 2022) have been widely used for more coherent and quasi-static magnetic flux ropes, we did not apply those methods to the present flux rope events because their basic assumptions are not well satisfied. The observed flux ropes are embedded in high-plasma β, reconnecting HCS exhausts, and they show accompanying plasma variations, implying that plasma pressure and flow effects are non-negligible and that a force-free approximation is not appropriate. In addition, GS reconstruction requires an approximately 2D, magnetohydrostatic, and time-stationary structure; whereas these flux rope events occur in a highly fluctuating environment near the HCS center and are most likely to be dynamically evolving structures associated with secondary reconnection and possible merging and/or coalescence. Therefore, such equilibrium-based modeling would likely provide an overly idealized representation of the present flux ropes. A realistic understanding of their geometry, formation, and evolution will likely require fully dynamical simulations.
Acknowledgments
This work was conducted during the research year of Chungbuk National University in 2026. This work was supported by the National Research Foundation of Korea(NRF) grant funded by the Korea government(MSIT)(RS-2024-00454886). We acknowledge the NASA Parker Solar Probe Mission and SWEAP team led by Justin Kasper for use of the data. The FIELDS experiment on the Parker Solar Probe spacecraft was designed and developed under NASA contract NNN06AA01SJN was supported by NASA contract no. NNG14PJ13I.
References
- Arnold, H., Drake, J. F., Swisdak, M., et al. 2021, Phys. Rev. Lett., 126, 135101 [NASA ADS] [CrossRef] [Google Scholar]
- Arró, G., Califano, F., & Lapenta, G. 2020, A&A, 642, A45 [NASA ADS] [CrossRef] [EDP Sciences] [Google Scholar]
- Bale, S. D., Goetz, K., Harvey, P. R., et al. 2016, Space Sci. Rev., 204, 49 [Google Scholar]
- Cartwright, M. L., & Moldwin, M. B. 2008, J. Geophys. Res. (Space Phys.), 113, A09105 [Google Scholar]
- Chen, Y., & Hu, Q. 2022, ApJ, 924, 43 [NASA ADS] [CrossRef] [Google Scholar]
- Chen, Y., Hu, Q., Zhao, L., et al. 2020, ApJ, 903, 76 [Google Scholar]
- Chen, Y., Hu, Q., Zhao, L., Kasper, J. C., & Huang, J. 2021, ApJ, 914, 108 [NASA ADS] [CrossRef] [Google Scholar]
- Chen, Y., Hu, Q., Allen, R. C., & Jian, L. K. 2023, ApJ, 943, 33 [Google Scholar]
- Choi, K.-E., Lee, D.-Y., Wang, H.-E., et al. 2021, Sol. Phys., 296, 148 [Google Scholar]
- Choi, K.-E., Lee, D.-Y., Marubashi, K., & Lee, S. 2022, ApJ, 931, 98 [Google Scholar]
- Choi, K.-E., Lee, D.-Y., Noh, S.-J., & Agapitov, O. 2024, ApJ, 961, 3 [Google Scholar]
- Comisso, L., Lingam, M., Huang, Y.-M., & Bhattacharjee, A. 2016, Phys. Plasmas, 23, 100702 [Google Scholar]
- Desai, M. I., Drake, J. F., Phan, T., et al. 2025, ApJ, 985, L38 [Google Scholar]
- Dong, C., Wang, L., Huang, Y.-M., Comisso, L., & Bhattacharjee, A. 2018, Phys. Rev. Lett., 121, 165101 [Google Scholar]
- Drake, J. F., Swisdak, M., Schoeffler, K. M., Rogers, B. N., & Kobayashi, S. 2006, Geophys. Res. Lett., 33, L13105 [Google Scholar]
- Drake, J. F., Agapitov, O., Swisdak, M., et al. 2021, A&A, 650, A2 [EDP Sciences] [Google Scholar]
- Eriksson, S., Swisdak, M., Weygand, J. M., et al. 2022, ApJ, 933, 181 [NASA ADS] [CrossRef] [Google Scholar]
- Fargette, N., Lavraud, B., Øieroset, M., et al. 2020, Geophys. Res. Lett., 47, e86726 [Google Scholar]
- Fargette, N., Lavraud, B., Rouillard, A., et al. 2021, A&A, 650, A11 [EDP Sciences] [Google Scholar]
- Feng, H. Q., Zhao, G. Q., & Wang, J. M. 2015, J. Geophys. Res. (Space Phys.), 120, 10,175 [Google Scholar]
- Gosling, J. T., & Szabo, A. 2008, J. Geophys. Res. (Space Phys.), 113, A10103 [NASA ADS] [CrossRef] [Google Scholar]
- Gosling, J. T., Skoug, R. M., McComas, D. J., & Smith, C. W. 2005, Geophys. Res. Lett., 32, L05105 [Google Scholar]
- Gosling, J. T., McComas, D. J., Skoug, R. M., & Smith, C. W. 2006, Geophys. Res. Lett., 33, L17102 [Google Scholar]
- Higginson, A. K., & Lynch, B. J. 2018, ApJ, 859, 6 [Google Scholar]
- Hoeksema, J. T., Wilcox, J. M., & Scherrer, P. H. 1983, J. Geophys. Res., 88, 9910 [CrossRef] [Google Scholar]
- Kasper, J. C., Abiad, R., Austin, G., et al. 2016, Space Sci. Rev., 204, 131 [Google Scholar]
- Lapenta, G., Markidis, S., Goldman, M. V., & Newman, D. L. 2015, Nat. Phys., 11, 690 [Google Scholar]
- Lavraud, B., Gosling, J. T., Rouillard, A. P., et al. 2009, Sol. Phys., 256, 379 [Google Scholar]
- Lavraud, B., Fargette, N., Réville, V., et al. 2020, ApJ, 894, L19 [Google Scholar]
- Liewer, P. C., Gallagher, B. M., Stenborg, G., et al. 2024, ApJ, 970, 79 [Google Scholar]
- Livi, R., Larson, D. E., Kasper, J. C., et al. 2022, ApJ, 938, 138 [NASA ADS] [CrossRef] [Google Scholar]
- Matthaeus, W. H., & Lamkin, S. L. 1986, Phys. Fluids, 29, 2513 [Google Scholar]
- Moldwin, M. B., Ford, S., Lepping, R., Slavin, J., & Szabo, A. 2000, Geophys. Res. Lett., 27, 57 [NASA ADS] [CrossRef] [Google Scholar]
- Paschmann, G., Papamastorakis, I., Baumjohann, W., et al. 1986, J. Geophys. Res., 91, 11099 [Google Scholar]
- Phan, T. D., Bale, S. D., Eastwood, J. P., et al. 2020, ApJS, 246, 34 [Google Scholar]
- Phan, T. D., Lavraud, B., Halekas, J. S., et al. 2021, A&A, 650, A13 [NASA ADS] [CrossRef] [EDP Sciences] [Google Scholar]
- Phan, T. D., Drake, J. F., Larson, D., et al. 2024, ApJ, 971, L42 [Google Scholar]
- Réville, V., Velli, M., Rouillard, A. P., et al. 2020, ApJ, 895, L20 [Google Scholar]
- Réville, V., Fargette, N., Rouillard, A. P., et al. 2022, A&A, 659, A110 [CrossRef] [EDP Sciences] [Google Scholar]
- Sanchez-Diaz, E., Rouillard, A. P., Lavraud, B., Kilpua, E., & Davies, J. A. 2019, ApJ, 882, 51 [Google Scholar]
- Servidio, S., Matthaeus, W. H., Shay, M. A., Cassak, P. A., & Dmitruk, P. 2009, Phys. Rev. Lett., 102, 115003 [Google Scholar]
- Whittlesey, P. L., Larson, D. E., Kasper, J. C., et al. 2020, ApJS, 246, 74 [Google Scholar]
- Zhao, L.-L., Zank, G. P., Adhikari, L., et al. 2020, ApJS, 246, 26 [Google Scholar]
- Zhao, L.-L., Zank, G. P., Hu, Q., et al. 2021, A&A, 650, A12 [NASA ADS] [CrossRef] [EDP Sciences] [Google Scholar]
All Figures
|
Fig. 1. Two consecutive crossings of a highly warped HCS and associated magnetic reconnection. (a, b) Pitch-angle distribution of 433 eV suprathermal electrons and radial magnetic field component BR observed by PSP during an interval surrounding perihelion (r ≈ 11.4 R⊙) on September 27-28, 2023. (c) PFSS model map of the coronal magnetic field at r = 2.5 R⊙, showing the projected PSP locations at the times of the two HCS crossings. (d) Schematic illustration of the two consecutive crossings of the warped HCS by PSP on September 27 and 28, along with associated magnetic reconnection sites. |
| In the text | |
|
Fig. 2. Observations of the HCS crossing on September 27, 2023. (a) Pitch-angle distribution of 433 eV suprathermal electrons. (b) Magnetic field magnitude |B|, with red arrows marking four enhancement events. (c) Radial magnetic field component BR, with the horizontal double-sided red arrow indicating the interval of main interest. (d) Tangential (BT, blue) and normal (BN, red) magnetic field components. (e) Radial component of the solar wind velocity VR. (f) Proton number density Np. (g) Expanded view of the magnetic field data during the ∼2.2-minute interval marked in panel c, showing the four enhancement events in detail. |
| In the text | |
|
Fig. 3. Detailed observations for the ∼2.2-minute interval highlighted in Fig. 2. (a) Magnetic field components in RTN coordinates. (b) Magnetic field components in the local current sheet coordinate system (X, Y, Z). (c) Magnitude of the solar wind bulk velocity |V| and its radial component VR in RTN coordinates. (d) VX in the current sheet coordinates. (e) Tangential and normal velocity components, VT and VN, in RTN. (f) VY and VZ in the current sheet coordinates. (g) Proton number density. (h) Parallel and perpendicular components of the proton temperature (T∥ and T⊥). (i) Schematic illustration of magnetic reconnection at the HCS, showing magnetic flux ropes (FRs) embedded within the reconnection exhaust region, the local current sheet coordinate system (X, Y, Z), and PSP passage (green). (j) Average suprathermal electron flux (433 eV) vs. pitch angle during each of the four events (highlighted in yellow). |
| In the text | |
|
Fig. 4. Hodograms of Bmax and Bint determined from minimum variance analysis for the four events identified in Fig. 3. Prior to performing the minimum variance analysis, the magnetic field data were smoothed using a Savitzky–Golay filter to reduce high-frequency fluctuations that could otherwise bias the determination of the variance directions. |
| In the text | |
|
Fig. 5. Normalized cross helicity (σc) versus normalized residual energy (σr) for the eight flux rope structures (named E1, E2, etc.) identified on 2023 September 27 (Fig. 3) and 28 (Figure 7). Each symbol corresponds to one flux-rope event, and the multiple points associated with each symbol represent time-dependent σc–σr values computed within the shaded interval of the event (Figs. 3 and 7.) |
| In the text | |
|
Fig. 6. Observations of the HCS crossing on September 28, 2023, in the same format as Fig. 2. Note: panel g shows an expanded view of the magnetic field data over a 3-minute interval, highlighting four B enhancement events and the significance of the normal component. In panel g, −BN (magenta) is shown for easier comparison with the total B (black). |
| In the text | |
|
Fig. 7. Detailed observations for the 3-minute interval highlighted in Fig. 5 in the same format as Fig. 3. Note: −BN (magenta) is shown in panel a and |V| (black) in panel d for easier comparison with other parameters. In panel b, the enhanced portions in BY magnitude are highlighted by thick red segments and black arrows. |
| In the text | |
|
Fig. 8. Hodograms of Bmax and Bint determined from minimum variance analysis for the four events on September 28 identified in Fig. 7. |
| In the text | |
Current usage metrics show cumulative count of Article Views (full-text article views including HTML views, PDF and ePub downloads, according to the available data) and Abstracts Views on Vision4Press platform.
Data correspond to usage on the plateform after 2015. The current usage metrics is available 48-96 hours after online publication and is updated daily on week days.
Initial download of the metrics may take a while.