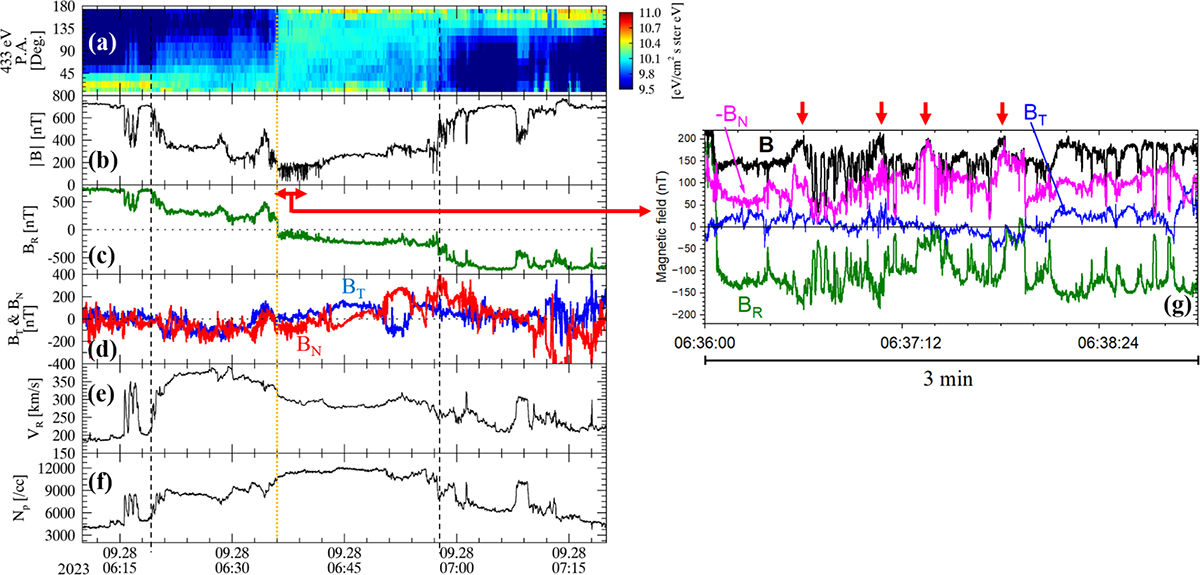
Fig. 6.
Download original image
Observations of the HCS crossing on September 28, 2023, in the same format as Fig. 2. Note: panel g shows an expanded view of the magnetic field data over a 3-minute interval, highlighting four B enhancement events and the significance of the normal component. In panel g, −BN (magenta) is shown for easier comparison with the total B (black).
Current usage metrics show cumulative count of Article Views (full-text article views including HTML views, PDF and ePub downloads, according to the available data) and Abstracts Views on Vision4Press platform.
Data correspond to usage on the plateform after 2015. The current usage metrics is available 48-96 hours after online publication and is updated daily on week days.
Initial download of the metrics may take a while.