Open Access
Fig. 7.
Download original image
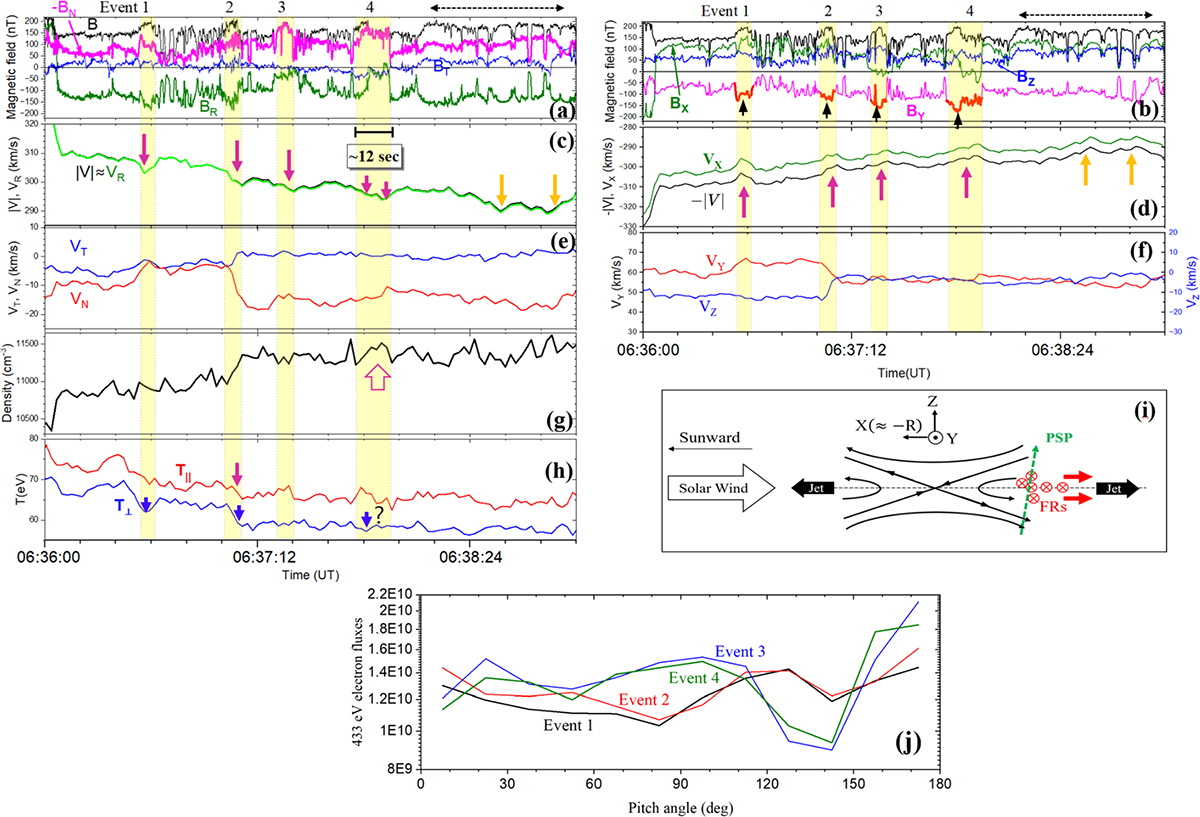
Detailed observations for the 3-minute interval highlighted in Fig. 5 in the same format as Fig. 3. Note: −BN (magenta) is shown in panel a and |V| (black) in panel d for easier comparison with other parameters. In panel b, the enhanced portions in BY magnitude are highlighted by thick red segments and black arrows.
Current usage metrics show cumulative count of Article Views (full-text article views including HTML views, PDF and ePub downloads, according to the available data) and Abstracts Views on Vision4Press platform.
Data correspond to usage on the plateform after 2015. The current usage metrics is available 48-96 hours after online publication and is updated daily on week days.
Initial download of the metrics may take a while.