| Issue |
A&A
Volume 709, May 2026
|
|
|---|---|---|
| Article Number | A187 | |
| Number of page(s) | 9 | |
| Section | Planets, planetary systems, and small bodies | |
| DOI | https://doi.org/10.1051/0004-6361/202557836 | |
| Published online | 19 May 2026 | |
A comparison of boulder morphology in the two geologic units of asteroid (101955) Bennu
1
Luleå University of Technology, Department of Computer Science, Electrical and Space Engineering,
Bengt Hultqvists väg 1,
981 92
Kiruna,
Sweden
2
German Aerospace Center (DLR), Institute of Space Research,
Rutherfordstraße 2,
12489
Berlin,
Germany
★ Corresponding authors: This email address is being protected from spambots. You need JavaScript enabled to view it.
; This email address is being protected from spambots. You need JavaScript enabled to view it.
Received:
26
October
2025
Accepted:
16
March
2026
Abstract
Context. Asteroid (101955) Bennu, a carbonaceous rubble-pile asteroid of about 500 m diameter, was visited by the OSIRIS-REx spacecraft in 2018. Images of Bennu’s surface show a rugged and a smooth surface unit. Although these regions are geologically distinct, it is unclear if the processes forming them also affect the shape of boulders that are abundantly present on Bennu.
Aims. We study the boulder morphology of the two geologic units of asteroid Bennu using common shape factors including solidity, roundness, elongation, and circularity to see if they are geologically distinct from each other.
Methods. We selected a representative number of images taken by the OCAMS camera bundle on board the OSIRIS-REx spacecraft and manually traced boulders in these images to derive the above mentioned morphological shape factors. These were then compared statistically between the two units. A total of 3985 boulders between 0.3 and 9 m were plotted in six different observation areas (five nonoverlapping images were chosen for each observation area, for a total of 30 images).
Results. We find that the Smooth Unit contains more and smaller boulders than the Rugged Unit, but no significant differences in boulder shape factors are evident between the two surface units. This indicates that the properties and processes that influence boulder shapes are homogeneous across the surface of Bennu. The average boulder elongation found in this study matches that of fragments created through hyper-velocity impact experiments, in line with Bennu’s creation after a catastrophic impact of its parent body. Finally, we found that smaller boulders tend to be smoother and more compact than larger boulders in both units. This suggests that weathering effects that smooth boulders are more efficient on small scales than those that roughen them.
Conclusions. We find that the shapes of boulders found on Bennu are independent of the geologic unit they are found in.
Key words: minor planets / asteroids: general / minor planets / asteroids: individual: Bennu
© The Authors 2026
 Open Access article, published by EDP Sciences, under the terms of the Creative Commons Attribution License (https://creativecommons.org/licenses/by/4.0), which permits unrestricted use, distribution, and reproduction in any medium, provided the original work is properly cited.
This article is published in open access under the Subscribe to Open model. This email address is being protected from spambots. You need JavaScript enabled to view it. to support open access publication.
1 Introduction
Asteroids are remnants from the early stages of the Solar System’s formation, providing valuable insights into its origins and the conditions at that time. Rubble-pile asteroids are believed to form from a catastrophic disruption of one or more parent bodies followed by the reassembling of impact fragments due to gravitational forces. This results in low-density bodies with surfaces covered in boulders (Barnouin et al. 2019; Fujiwara et al. 2006; Jourdan et al. 2023; Pajola et al. 2024; Watanabe et al. 2019). Additionally, boulders can be produced as ejecta from less violent impacts (Michikami et al. 2016). Thus, examining these boulders on asteroid surfaces offers insights into their collisional history and geological evolution. Furthermore, they can be used to constrain the mechanical properties of the regolith such as the internal friction angle (Robin et al. 2024; Sharma et al. 2021).
The near-Earth asteroid (101955) Bennu is an example of a rubble-pile asteroid of carbonaceous composition (Lauretta et al. 2017). NASA’s OSIRIS-REx mission, a sample-return mission, arrived at Bennu in December 2018 (Lauretta et al. 2019). OSIRIS-REx took high-resolution images of Bennu’s surface with its camera bundle “OSIRIS-REx Camera Suite” (OCAMS) (Rizk et al. 2018).
Images taken by OCAMS revealed that Bennu has two geological surface units, named the Smooth Unit and the Rugged Unit (Jawin et al. 2022) (Figure 1). These two units are geologically distinct and are believed to have different ages. While the Smooth Unit has not resurfaced in the past 2 Myr, the Rugged Unit experienced mass migration within the past 0.5 Myr (Jawin et al. 2022). The two units were identified using three geomorphologic indicators: the surface texture (the visual roughness of the surface), shape features (such as the equatorial bulge, longitudinal ridges, and troughs between these ridges), and geologic features (boulders bigger than 20 m, craters, mass movement, particle ejection regions, and lineaments) (Jawin et al. 2022).
Some of the boulders on Bennu’s surface also show small craters and fractures, indicating the alteration of boulders through impacts and thermal cycling at the surface (Ballouz et al. 2020; Delbo et al. 2022), features that have also been observed on asteroid Ryugu (Schirner et al. 2024), another carbonaceous rubble-pile asteroid visited by the Hayabusa2 mission (Watanabe et al. 2019). Thus, the boulders of rubble-pile asteroids are subject to a variety of erosive processes.
A study of Bennu’s boulders based on images taken by OSIRIS-REx, conducted by Jawin et al. (2023), revealed different boulder types on the asteroid’s surface. They identified four types: type A boulders, which are rounded, rugged, and clastic; type B boulders, which are subangular with intermediate roughness and polygonal surface fractures; type C boulders, which are angular with distinct fractures and have the lowest roughness; and type D boulders, which are subangular with intermediate roughness and exhibit bright spots (Jawin et al. 2023). Similar boulder types have also been identified on asteroid Ryugu (Sugita et al. 2019; Jaumann et al. 2019). Sugita et al. (2019) found four types: dark and rugged; bright and smooth; bright and mottled; and the uniquely blue boulder Otohime Saxum. In high-resolution descent and in situ images of the Mascot lander (Ho et al. 2021), Jaumann et al. (2019) identified two boulder types: one bright with smooth faces and sharp edges, and one dark with cauliflower-like, crumbly surfaces. However, neither of these studies analyzed whether the different boulder types were found in different geological regions on the asteroid surfaces, which is this work’s aim. This article investigates whether boulder morphology is distinctly different in the two geologic units on Bennu, which may indicate that the processes forming the geologic units also act on, or influence, boulder morphology.
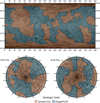 |
Fig. 1 Two geologic surface units of the asteroid Bennu found by Jawin et al. (2022). The brown region represents the Smooth Unit, and the blue region represents the Rugged Unit. The map from Jawin et al. (2022) is licensed under Creative Commons CC-BY-NC-ND (no alteration has been made). |
2 Shape factors
To study boulder morphology, shape factors – also known as morphologic descriptors – are commonly used. These parameters provide valuable insights into a boulder’s roughness and compactness. In this study, we investigated two shape factors that can be used to describe a boulder’s surface roughness by considering the boulder’s perimeter, convex hull, and projected area (circularity C and solidity S), and two factors that can be used to describe how compact and circular a boulder’s shape is, using its major and minor axes and projected area (roundness R and elongation E). The minor and major axes were defined as the shortest and longest side of the minimum bounding box enclosing the boulder (a minimum bounding box is the smallest rectangle that completely encloses a polygon). The parameters necessary to calculate these shape factors are illustrated in Fig. 2. We note that the definition of shape factors varies within the literature, which can be confusing. Our definitions are mainly based on Cambianica et al. (2019), whose descriptions align with those of the image analysis tool ImageJ (Schneider et al. 2012).
– Circularity:
 (1)
(1)
Circularity measures the smoothness of a boulder’s outline, indicating how closely its boundary resembles a circle. This is determined by dividing the boulder’s projected area by the area of a circle whose circumference matches the boulder’s perimeter. Here, A is the boulder area, and P is the boulder perimeter. We note that this parameter can depend on the image resolution if roughness below the resolution limit exists, because at higher resolution more details of the perimeter can be traced, decreasing the value of the circularity.
– Solidity:
 (2)
(2)
Solidity indicates the degree of concavity or convexity of a boulder by dividing the boulder’s area by the area of its convex hull. Here, H is the area of the boulder’s convex hull.
– Roundness:
 (3)
(3)
Roundness describes how closely a boulder’s areal shape approximates that of a circle by dividing the boulder area by the area of the smallest circumscribed circle that encloses it. Here, a denotes the major axis of the boulder and thus the diameter of the smallest circumscribing circle.
– Elongation:
 (4)
(4)
The elongation is independent of the boulder area and measures how elongated a boulder is by dividing its minor axis with its major axis. Here, b is the minor axis of the boulder. The axes are equivalent to sides of a boulder’s bounding box.
We note that the descriptors chosen to describe the roughness of a boulder, including circularity and solidity, are also a measure of their compactness. However, in contrast to the compactness descriptors, such as roundness and elongation, the roughness descriptors also illustrate the properties of a boulder’s perimeter. Thus, we divided the four descriptors into two groups. The shape factors described here relate to 2D shapes, although boulders are in reality 3D objects. Given the unavailability of 3D datasets for most boulders on planetary bodies, it is common practice to derive and compare the projected 2D shape factors (Cambianica et al. 2019; Robin et al. 2024). We followed this approach to make our work comparable.
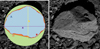 |
Fig. 2 Parameters required for calculating the shape factors considered in this work. Left: boulder area A (blue), boulder perimeter P (red), major axis a (purple), minor axis b (yellow), convex hull area H (orange), and smallest circumscribing circle (green). Right: original boulder. |
3 Mapping
We used the open-source software Quantum Geographic Information System1 (referred to as QGIS in the rest of this paper) (Geospatial Foundation Project 2024) to identify and map boulders in images of asteroid Bennu. Three regions with images of resolutions higher than 0.015 m/pxl were identified in both the Rugged and Smooth Unit. Within these regions, five arbitrary, but not overlapping, images with the best resolution were chosen for further study, leading to a total of 30 images of similar resolution (0.011–0.015 m/pxl) (a list of image IDs is included in the Appendix). The images were retrieved from NASA’s Planetary Data System (Rizk et al. 2019). The placement of the six regions and the five images chosen within each region can be found in Fig. 3.
We then used the polygon editor tool in QGIS to trace each boulder larger than 15 pixels across its smallest axis in the images. The same zoom was maintained on all images, and they were all mapped at the same workstation by the main author in order to maintain consistency. The outline of the mapped boulders were based on the visible edges of the boulders. The edges could be seen both with the help of shadows around the boulder and the texture difference between the boulder and the regolith it lays on. One point in the mapped polygon appeared roughly every three to six pixels. With the help of QGIS’s built in functions, we found all the parameters needed to calculate the shape factors and exported the data to perform plotting and subsequent analyses.
Figure 4 shows an example of one map from the Rugged Unit and one from the Smooth Unit. Before proceeding to our shape analysis, we checked whether the solar incidence and emission angles could influence boulder detection and tracing. We did this by plotting the orientation of the boulders’ major axes against the solar incidence and emission angles, but found no correlation between these parameters. This indicates that no bias was introduced by the solar incidence and emission angles. However, the shadows around the boulders’ contours still influence the perceived outline of the boulders. To mitigate this, boulders for which the contours were deemed too hidden by shadows were excluded from the analysis.
We note that techniques to automatically or semiautomatically identify boulders on planetary surfaces have recently been developed (Robin et al. 2024; Prieur et al. 2023; Shimizu et al. 2025). Here, we chose to map boulders manually, an approach commonly used to analyze morphologic properties of planetary surface features and suitable for the comparatively small number of images chosen for the analysis (Robin et al. 2024; Cambianica et al. 2019). Nonetheless, automated boulder identification techniques may be useful for future broader analyses across multiple planetary bodies.
4 Results
We mapped 1661 boulders in the Rugged Unit with an average size of (0.71 ± 0.48) m, and 2324 boulders in the Smooth Unit with an average size of (0.58 ± 0.35) m. The size was defined as the length (in meters) of the major axis. The cumulative size-frequency distribution can be seen in Fig. 5. The distributions’ slopes are similar, but some offsets in boulder abundance at a given size are evident. The power index, calculated for the Smooth 2 region (the region with the most mapped boulders) with boulders larger than 0.5 m, was found to be –2.5 ± 0.1; see Fig. 6. The power-law index was estimated from the size frequency distribution by means of the maximum-likelihood (ML) method (Clauset et al. 2009).
As evident in Fig. 7, the Smooth Unit generally contains boulders that are smoother and more compact than those in the Rugged Unit, reflected by its higher average shape factor values. However, this difference is not statistically significant, and there is considerable overlap in values between the two regions. Table 1 summarizes the average shape factor values corresponding to Fig. 7. Note that the error bars in Fig. 7 represent the standard deviation of the samples. Using scatter plots, Figure 8 illustrates the distribution of individual boulder shape factors plotted against their sizes.
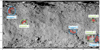 |
Fig. 3 Thirty chosen images (red squares). The image IDs corresponding to the numbered images can be found in the Appendix. The blue outlines represent the rugged regions, and the green outlines represent the smooth regions. |
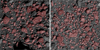 |
Fig. 4 Example of a map from the Rugged Unit (image ID: 20191026T213742S732_pol_iofL2pan; left), and one from the Smooth Unit (image ID: 20191026T223241S428_pol_iofL2pan; right). The red polygons represent the traced boulders, and the numbers refer to the individual boulder IDs assigned for tracking purposes. The images are approximately 15 m across. |
5 Discussion
The fact that the slopes of the cumulative size–frequency distributions in both geologic regions on Bennu are similar opens the possibility that both regions – if composed of similar materials (Kaplan et al. 2021; Hamilton et al. 2019) – experienced similar erosive processes. The heterogeneity of Bennu’s surface in terms of color and albedo has been attributed to the age and morphology of its individual features (Ferrone et al. 2021). Resurfacing, which took place at different times in the two geologic regions (around 2 Ma and 0.5 Ma ago for the Smooth and Rugged Unit, respectively) (Jawin et al. 2022), appears not to have influenced the boulder size-frequency distribution significantly. A similar result can be seen in the plots shown in Burke et al. (2021), which map the potential sample sites of the OSIRIS-REx spacecraft and partly overlap with our mapping areas.
The power index of –2.5 ± 0.1 marginally agrees with the power index of –2.9 ± 0.3, found by DellaGiustina et al. (2019) when studying boulders on Bennu’s surface. It is worth noting that they examined the power index for boulders larger than 8 m, while we examined boulders larger than 0.5 m. This could explain the slight difference between the indices. Furthermore, it is worth noting that our power law is not a good fit for larger boulders.
Figure 8 shows that smaller boulders tend to be smoother and more compact than larger boulders across both surface units. Table 2 shows the average shape factors for small boulders compared to large boulders across all studied regions (“small” boulders are those smaller than the average boulder size in the region, while “large” are those larger). As can be seen, all shape factors are larger for the small boulders, which means that they are smoother and more compact, with the only exception being the elongation in the Rugged 3 unit having approximately the same value. Michikami & Hagermann (2021) also found that for the asteroids Ryugu, Eros, and Itokawa, the shape factor elongation, and thus the compactness, was higher for smaller boulders than for larger ones. This supports our result that smaller boulders are more compact, but we also find that smaller boulders are smoother than larger ones. We find that the older Smooth Unit contains more smaller boulders – and thus more compact and smooth boulders – than the Rugged Unit. However, as mentioned, when comparing the average shape factors, the difference is not statistically significant.
Two of the main processes that alter boulder roughness and compactness at an asteroid’s surface are micrometeorite impacts (Cambianica et al. 2019) and thermal erosion (Delbo et al. 2014). Both processes can either increase or decrease the roughness of boulders, depending on the scale of the impact and the morphology of the boulder. Micrometeorite impacts, for instance, can smooth a boulder by removing sharp corners (Cambianica et al. 2019), or they can roughen a smooth boulder by creating craters or breaking off sections (Ballouz et al. 2020). Similarly, thermal erosion can smooth boulders by chipping away sharp edges through cracking (Delbo et al. 2014), or it can cause the boulder to split into multiple pieces, creating new sharp edges. This concept is illustrated in Fig. 9. It is also possible that the migration process described by Jawin et al. (2022) reduces the boulders’ roughness when rubbing them against each other. As larger boulders are typically rougher and less compact, this indicates that on a larger scale, the above-described weathering processes roughen boulders (e.g., by splitting or cratering), while on smaller scales, they make them smoother (e.g., by removing sharp edges).
Jawin et al. (2022) state that the Smooth Unit is “boulder-poor” compared to the Rugged Unit. However, they did not perform a detailed analysis of boulders smaller than 20 m, which may explain the difference with our results. It is worth noting that the images studied here were approximately 15 m across, which means that no comparison of boulders larger than 20 m could be made, as boulders of that size would be too large to be visible in the images used.
No statistically significant difference was found in the shape factors between the two regions. Assuming homogeneous material properties across Bennu, this implies that processes affecting boulder roughness and compactness, such as micrometeorite impacts and thermal weathering (Otto et al. 2021), are similarly effective in both regions and outperform any morphologic variations introduced by particle migration, which is more pronounced in the Rugged Unit (Jawin et al. 2022; Barnouin et al. 2022). This aligns with the findings of Delbo et al. (2022), who determined that thermal fracturing on Bennu occurs within 104– 105 years, a period much shorter than the age of Bennu’s Rugged and Smooth Units of 0.5 × 10⁶ and 106 years, respectively (Jawin et al. 2022).
Laboratory experiments on impact fragments resulting from catastrophic disruptions of rocks have shown that these fragments typically have an elongation of around 0.7 (Michikami et al. 2016), which aligns well with our findings. This supports the hypothesis that Bennu’s boulders are remnants of a catastrophic collision. Figure 10 compares the distribution of boulder elongation derived in this study with laboratory results from Michikami et al. (2016). They conducted hyper-velocity impact experiments (5 km/s) onto cubes sized 5 × 5 × 5 cm and found an average elongation of 0.74, closely matching our results. Other experiments conducted by Michikami et al. matched even more closely with our distributions; however, this one was chosen for our comparison because it was completely destroyed, as Bennu was. Additionally, the shape of the distributions are similar, with most boulders falling into the 0.7–0.8 bin. The average elongation in our data does not drop below 0.4 within one standard deviation, which is also in agreement with the experiments. We do see a few more boulders with lower elongation, but this could be explained by other weathering processes present on Bennu that are not present in a laboratory environment.
However, our data show a wider range of boulder elongation, with relatively more boulders in the 0.5–0.6 and 0.9–1.0 bins compared to the laboratory results. This could be attributed to additional processes, such as impact and thermal fracturing, that have influenced boulder shapes on Bennu since the original catastrophic collision. The above-mentioned hyper-velocity laboratory studies focus solely on impacts, which may explain the differences in the elongation distributions. They also studied impact on a cube, while the boulders on Bennu have more varied shapes. The higher number of boulders in the 0.9–1.0 bin in our data might also result from Bennu’s boulders becoming more compact (and thus having higher elongation values) through micrometeorite bombardment (Cambioni et al. 2021).
Robin et al. (2024) investigated the shape factors (i.e., circularity, solidity, and elongation) of boulders on Bennu, as well as on asteroids Dimorphos, Itokawa, and Ryugu. Our measurements agree not only with their average values but also with the distribution of possible values around the average (e.g., the extent of the error bars). Figure 11 shows their values in comparison ours (Note that the error bars in Fig. 11 represent the standard deviation of the samples.). The elongation and solidity of boulders are similar across the different asteroids, but the circularity derived in this work is smaller than the values published by Robin et al. (2024). This discrepancy can be explained by the different image resolutions. While we used image resolutions of 1.1–1.5 cm/pix, the analysis performed by Robin et al. (2024) was based on lower-resolution images (<10 cm/pix). Thus, we were able to trace the perimeter of the boulders at higher detail, which results in higher perimeter values while the boulder areas remain the same. Consequently, we derived a smaller value for the circularity. Nevertheless, the similarity of the shape factors across multiple rubble-pile asteroids may indicate that these values are related to their common impact-related formation process (Robin et al. 2024) and that the boulder shape introduced through catastrophic impacts outlasts subsequent erosion through thermal stresses, micrometeorite bombardment, or mass migration.
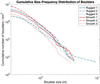 |
Fig. 5 Cumulative size-frequency distribution of boulders in all six regions. The regions from the Rugged Unit are shown in blue, and the regions from the Smooth Unit are shown in red. |
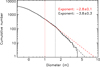 |
Fig. 6 Power index for the Smooth 2 region. |
Average shape factors derived for Bennu’s two units.
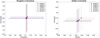 |
Fig. 7 Shape factors in the six regions chosen in our study: three regions in the Smooth Unit and three in the Rugged Unit. Left: graph showing shape factors referring to boulder compactness, elongation, and roundness. Right: graph showing boulder roughness, solidity, and circularity. The blue and red shapes correspond to the Rugged Unit and Smooth Unit, respectively. |
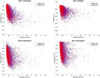 |
Fig. 8 Scatter plots showing the shape factors of individual boulders against their sizes in the Rugged Unit and the Smooth Unit. The blue dots correspond to the Rugged Unit, and the red dots correspond to the Smooth Unit. |
Average shape factors for small vs. large boulders.
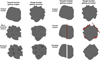 |
Fig. 9 Illustrations showing how micrometeorite impacts (left) and thermal erosion (right) can lead to boulders becoming either rougher or smoother. |
 |
Fig. 10 Histogram of the elongation distributions. Left: distribution for the Rugged Unit (blue). Middle: distribution for the Smooth Unit (red). Right: distribution found in the laboratory experiments performed by Michikami et al. (2016) (green). Note the varying scale on the y-axis. |
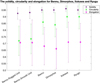 |
Fig. 11 Comparison of the shape factors – elongation, circularity, and solidity – found in this work for the two surface units with the values found for Bennu, Dimorphos, Itokawa, and Ryugu by Robin et al. (202400000). Note that circularity is a resolution-dependent parameter. |
6 Conclusions
We investigated boulder shapes in the Smooth and Rugged geologic units on asteroid Bennu. We considered two sets of shape factors representative of a boulder’s roughness (circularity and solidity) and compactness (roundness and elongation). We make the following observations and conclusions:
There is no significant difference in the morphological shape factors between the two surface units, implying that the related properties are homogeneous across Bennu’s surface;
The elongation of Bennu’s boulders matches that of laboratory experiments of fragmentation caused by catastrophic impacts, reaffirming Bennu’s status as a rubble-pile asteroid;
Smaller boulders are typically more compact and smoother than larger ones, indicating that on small scales (up to decimeter) weathering effects that have a smoothing effect are more efficient than those that have a roughening effect.
Acknowledgements
We’d like to thank an anonymous reviewer for their very helpful comments and suggestions that improved this work. This work has been conducted under the framework of a Master thesis project at Luleå University of Technology in Kiruna, Sweden and the German Aerospace Center’s (DLR) Institute of Planetary Research in Berlin, Germany. The thesis can be found as urn:nbn:se:ltu:diva-107728.
References
- Ballouz, R.-L., Walsh, K., Barnouin, O., et al. 2020, Nature, 587, 205 [Google Scholar]
- Barnouin, O., Daly, M., Palmer, E., et al. 2019, Nat. Geosci., 12, 247 [NASA ADS] [CrossRef] [Google Scholar]
- Barnouin, O., Jawin, E., Daly, R., et al. 2022, PSJ, 3, 75 [Google Scholar]
- Burke, K. N., DellaGiustina, D. N., Bennett, C. A., et al. 2021, Remote Sens., 13, 1315 [Google Scholar]
- Cambianica, P., Cremonese, G., Naletto, G., et al. 2019, A&A, 630, A15 [NASA ADS] [CrossRef] [EDP Sciences] [Google Scholar]
- Cambioni, S., Delbo, M., Poggiali, G., et al. 2021, Nature, 598, 49 [NASA ADS] [CrossRef] [Google Scholar]
- Clauset, A., Shalizi, C. R., & Newman, M. E. 2009, SIREV, 51, 661 [Google Scholar]
- Delbo, M., Libourel, G., Wilkerson, J., et al. 2014, Nature, 508, 233 [Google Scholar]
- Delbo, M., Walsh, K. J., Matonti, C., et al. 2022, Nat. Geosci., 15, 453 [NASA ADS] [CrossRef] [Google Scholar]
- DellaGiustina, D., Emery, J., Golish, D., et al. 2019, Nat. Astron., 3, 341 [CrossRef] [Google Scholar]
- Ferrone, S., Clark, B., Kaplan, H., et al. 2021, Icarus, 368, 114579 [Google Scholar]
- Fujiwara, A., Kawaguchi, J., Yeomans, D., et al. 2006, Science, 312, 1330 [NASA ADS] [CrossRef] [Google Scholar]
- Geospatial Foundation Project. 2024, QGIS Geographic Information System (Open Source) [Google Scholar]
- Hamilton, V., Simon, A., Christensen, P., et al. 2019, Nat. Astron., 3, 332 [CrossRef] [Google Scholar]
- Ho, T.-M., Jaumann, R., Bibring, J.-P., et al. 2021, Planet. Space Sci., 200, 105200 [NASA ADS] [CrossRef] [Google Scholar]
- Jaumann, R., Schmitz, N., Ho, T.-M., et al. 2019, Science, 365, 817 [Google Scholar]
- Jawin, E., McCoy, T., Walsh, K., et al. 2022, Icarus, 381, 114992 [Google Scholar]
- Jawin, E. R., Ballouz, R.-L., Ryan, A. J., et al. 2023, J. Geophys. Res., 128, e2023JE008019 [Google Scholar]
- Jourdan, F., Timms, N. E., Nakamura, T., et al. 2023, PNAS, 120, e2214353120 [Google Scholar]
- Kaplan, H. H., Simon, A. A., Hamilton, V. E., et al. 2021, A&A, 653, L1 [NASA ADS] [CrossRef] [EDP Sciences] [Google Scholar]
- Lauretta, D., Balram-Knutson, S., Beshore, E., et al. 2017, Space Sci. Rev., 212, 925 [CrossRef] [Google Scholar]
- Lauretta, D., DellaGiustina, D., Bennett, C., et al. 2019, Nature, 568, 55 [NASA ADS] [CrossRef] [Google Scholar]
- Michikami, T., & Hagermann, A. 2021, Icarus, 357, 114282 [Google Scholar]
- Michikami, T., Hagermann, A., Kadokawa, T., et al. 2016, Icarus, 264, 316 [Google Scholar]
- Otto, K. A., Matz, K., Schröder, S., et al. 2021, MNRAS, 500, 3178 [Google Scholar]
- Pajola, M., Tusberti, F., Lucchetti, A., et al. 2024, Nat. Commun., 15, 6205 [Google Scholar]
- Prieur, N. C., Amaro, B., Gonzalez, E., et al. 2023, J. Geophys. Res., 128, e2023JE008013 [Google Scholar]
- Rizk, B., Drouet d’Aubigny, C., Golish, D., et al. 2018, Space Sci. Rev., 214, 26 [Google Scholar]
- Rizk, B., Drouet d’Aubigny, C., Golish, D., DellaGiustina, D., & Lauretta, D. 2019, OSIRIS-REx Camera Suite (OCAMS) Bundle, urn:nasa:pds:orex.ocams [Google Scholar]
- Robin, C. Q., Duchene, A., Murdoch, N., et al. 2024, Nat. Commun., 15, 6203 [Google Scholar]
- Schirner, L., Otto, K. A., Delbo, M., et al. 2024, A&A, 684, A5 [NASA ADS] [CrossRef] [EDP Sciences] [Google Scholar]
- Schneider, C. A., Rasband, W. S., & Eliceiri, K. W. 2012, Nat. Methods, 9, 671 [CrossRef] [PubMed] [Google Scholar]
- Sharma, A., Leib-Day, A. R., Thakur, M. M., & Penumadu, D. 2021, Materials, 14, 3023 [Google Scholar]
- Shimizu, Y., Miyamoto, H., & Michel, P. 2025, Sci. Rep., 15, 10284 [Google Scholar]
- Sugita, S., Honda, R., Morota, T., et al. 2019, Science, 364, eaaw0422 [Google Scholar]
- Watanabe, S., Hirabayashi, M., Hirata, N., et al. 2019, Science, 364, 268 [NASA ADS] [Google Scholar]
Appendix A Images used for mapping in this study
Parameters of the images used in this work.
All Tables
All Figures
|
Fig. 1 Two geologic surface units of the asteroid Bennu found by Jawin et al. (2022). The brown region represents the Smooth Unit, and the blue region represents the Rugged Unit. The map from Jawin et al. (2022) is licensed under Creative Commons CC-BY-NC-ND (no alteration has been made). |
| In the text | |
|
Fig. 2 Parameters required for calculating the shape factors considered in this work. Left: boulder area A (blue), boulder perimeter P (red), major axis a (purple), minor axis b (yellow), convex hull area H (orange), and smallest circumscribing circle (green). Right: original boulder. |
| In the text | |
|
Fig. 3 Thirty chosen images (red squares). The image IDs corresponding to the numbered images can be found in the Appendix. The blue outlines represent the rugged regions, and the green outlines represent the smooth regions. |
| In the text | |
|
Fig. 4 Example of a map from the Rugged Unit (image ID: 20191026T213742S732_pol_iofL2pan; left), and one from the Smooth Unit (image ID: 20191026T223241S428_pol_iofL2pan; right). The red polygons represent the traced boulders, and the numbers refer to the individual boulder IDs assigned for tracking purposes. The images are approximately 15 m across. |
| In the text | |
|
Fig. 5 Cumulative size-frequency distribution of boulders in all six regions. The regions from the Rugged Unit are shown in blue, and the regions from the Smooth Unit are shown in red. |
| In the text | |
|
Fig. 6 Power index for the Smooth 2 region. |
| In the text | |
|
Fig. 7 Shape factors in the six regions chosen in our study: three regions in the Smooth Unit and three in the Rugged Unit. Left: graph showing shape factors referring to boulder compactness, elongation, and roundness. Right: graph showing boulder roughness, solidity, and circularity. The blue and red shapes correspond to the Rugged Unit and Smooth Unit, respectively. |
| In the text | |
|
Fig. 8 Scatter plots showing the shape factors of individual boulders against their sizes in the Rugged Unit and the Smooth Unit. The blue dots correspond to the Rugged Unit, and the red dots correspond to the Smooth Unit. |
| In the text | |
|
Fig. 9 Illustrations showing how micrometeorite impacts (left) and thermal erosion (right) can lead to boulders becoming either rougher or smoother. |
| In the text | |
|
Fig. 10 Histogram of the elongation distributions. Left: distribution for the Rugged Unit (blue). Middle: distribution for the Smooth Unit (red). Right: distribution found in the laboratory experiments performed by Michikami et al. (2016) (green). Note the varying scale on the y-axis. |
| In the text | |
|
Fig. 11 Comparison of the shape factors – elongation, circularity, and solidity – found in this work for the two surface units with the values found for Bennu, Dimorphos, Itokawa, and Ryugu by Robin et al. (202400000). Note that circularity is a resolution-dependent parameter. |
| In the text | |
Current usage metrics show cumulative count of Article Views (full-text article views including HTML views, PDF and ePub downloads, according to the available data) and Abstracts Views on Vision4Press platform.
Data correspond to usage on the plateform after 2015. The current usage metrics is available 48-96 hours after online publication and is updated daily on week days.
Initial download of the metrics may take a while.