Open Access
Fig. 10
Download original image
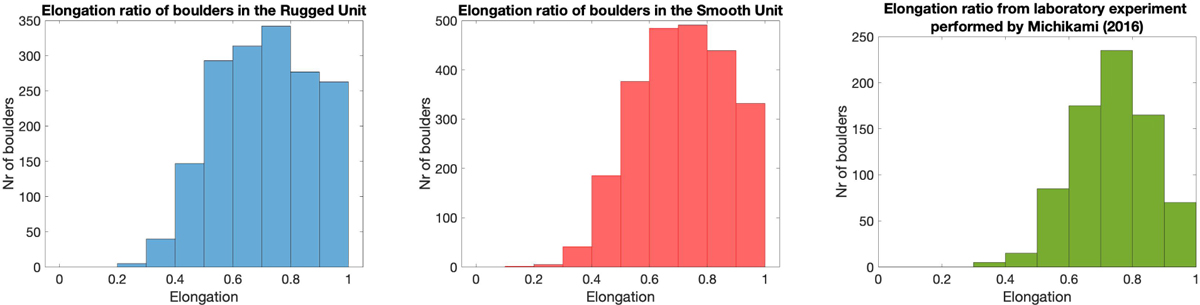
Histogram of the elongation distributions. Left: distribution for the Rugged Unit (blue). Middle: distribution for the Smooth Unit (red). Right: distribution found in the laboratory experiments performed by Michikami et al. (2016) (green). Note the varying scale on the y-axis.
Current usage metrics show cumulative count of Article Views (full-text article views including HTML views, PDF and ePub downloads, according to the available data) and Abstracts Views on Vision4Press platform.
Data correspond to usage on the plateform after 2015. The current usage metrics is available 48-96 hours after online publication and is updated daily on week days.
Initial download of the metrics may take a while.