| Issue |
A&A
Volume 698, June 2025
|
|
|---|---|---|
| Article Number | A82 | |
| Number of page(s) | 9 | |
| Section | Galactic structure, stellar clusters and populations | |
| DOI | https://doi.org/10.1051/0004-6361/202554119 | |
| Published online | 03 June 2025 | |
The Pristine survey
XXVII. The extremely metal-poor stream C-19 stretches over more than 100 degrees
1
School of Astronomy and Space Science, Nanjing University, Nanjing,
Jiangsu
210093,
China
2
Key Laboratory of Modern Astronomy and Astrophysics, Nanjing University, Ministry of Education,
Nanjing
210093,
China
3
Université de Strasbourg, CNRS, Observatoire astronomique de Strasbourg,
UMR 7550,
67000
Strasbourg,
France
4
Astronomisches Rechen-Institut, Zentrum für Astronomie der Universität Heidelberg,
Mönchhofstrasße 12-14,
69120
Heidelberg,
Germany
5
Institute of Astronomy, Russian Academy of Sciences,
Pyatnitskaya 48,
119017
Moscow,
Russia
6
Max-Planck-Institut für Astronomie,
Königstuhl 17,
69117
Heidelberg,
Germany
7
Institute of Astronomy, University of Cambridge,
Madingley Road,
Cambridge
CB3 0HA,
UK
8
Department of Astronomy & Astrophysics, University of Toronto,
Toronto
ON
M5S 3H4,
Canada
9
Instituto de Astrofísica de Canarias,
38205
La Laguna, Tenerife,
Spain
10
Universidad de La Laguna, Departamento de Astrofísica,
38206
La Laguna, Tenerife,
Spain
11
The Observatories of the Carnegie Institution for Science,
813 Santa Barbara Street,
Pasadena,
CA
91101,
USA
12
Université Côte d’Azur, Observatoire de la Côte d’Azur, CNRS,
Laboratoire Lagrange, Nice,
France
13
Kavli Institute for Astronomy and Astrophysics, Peking University,
Beijing
100871,
China
14
DARK, Niels Bohr Institute, University of Copenhagen,
Jagtvej 128,
2200
Copenhagen,
Denmark
15
Dept. of Physics and Astronomy, University of Victoria,
PO Box 3055, STN CSC,
Victoria
BC
V8W 3P6,
Canada
16
Centre for Astrophysics Research, Department of Physics, Astronomy and Mathematics, University of Hertfordshire,
Hatfield,
AL10 9AB,
UK
17
Kapteyn Astronomical Institute, University of Groningen,
Landleven 12,
9747
AD
Groningen,
The Netherlands
18
Núcleo de Astronomía, Facultad de Ingeniería y Ciencias Universidad Diego Portales,
Ejército 441,
Santiago,
Chile
★ Corresponding author; This email address is being protected from spambots. You need JavaScript enabled to view it.
Received:
13
February
2025
Accepted:
11
April
2025
Abstract
The discovery of the most metal-poor stream, C-19, provides us with a fossil record of a stellar structure born very soon after the big bang. In this work, we search for new C-19 members throughout the sky by combining two complementary stream-searching algorithms, STREAMFINDER and StarGO, and utilizing low-metallicity star samples from the Pristine survey, as well as Gaia BP and RP spectrophotometric catalogs. We confirm 13 new members, spread over more than 100°, using velocity and metallicity information from a set of spectroscopic follow-up programs that targeted a quasi-complete sample of our bright candidates (G ≲ 16.0). From the updated set of stream members, we confirm that the stream is wide, with a stream width of ~200 pc, and dynamically hot, with a derived velocity dispersion of 10.9-1.5+2.1 km s−1. The tension remains between these quantities and a purely baryonic scenario in which the relatively low-mass stream (even updated to a few 104 M⊙) stems from a globular cluster progenitor, as suggested by its chemical abundances. Some heating mechanism, such as preheating of the cluster in its own dark matter halo or through interactions with halo substructures, appears necessary to explain the tension. The impact of binaries on the measured dispersion also remains unknown. Detailed elemental abundances of more stream members, as well as multi-epoch radial velocities from spectroscopic observations, are therefore crucial to fully understanding the nature and past history of the most metal-poor stream of the Milky Way.
Key words: Galaxy: abundances / Galaxy: evolution / Galaxy: formation / globular clusters: general / Galaxy: halo / Galaxy: kinematics and dynamics
© The Authors 2025
 Open Access article, published by EDP Sciences, under the terms of the Creative Commons Attribution License (https://creativecommons.org/licenses/by/4.0), which permits unrestricted use, distribution, and reproduction in any medium, provided the original work is properly cited.
This article is published in open access under the Subscribe to Open model. This email address is being protected from spambots. You need JavaScript enabled to view it. to support open access publication.
1 Introduction
Old stellar streams are fossil relics from the very early Universe. We can find them orbiting in the nearby halo, which allows us to measure the motions and chemical abundances of each individual member with great precision. Detailed chemodynamical studies of streams open the window to understanding the formation of the first stellar structures, as an alternative approach to direct observations such as the images and spectra of high redshift galaxies (e.g., GZH2, Zavala et al. 2025) using the James Webb Space Telescope (JWST).
As age is a quantity that is very difficult to directly measure for most stars, the iron abundance of a star, which records the chemical enrichment (or lack thereof) of its birth place, is generally used as a crude proxy for age. Extremely metal-poor (EMP) stars have [Fe/H] < −3.0, which is less than 1/1000th of the solar abundance. These stars were born in a pristine environment at a time when supernova events occurred sparsely and the interstellar medium was not well mixed (e.g., Argast et al. 2000), roughly ~1 Gyr after the big bang (z ~ 5–6). It is not hard to imagine that streams consisting of EMP stars come from stellar structures formed at the same epoch.
In the Gaia era, stellar stream searches (e.g., Ibata et al. 2021) have now revealed a handful of low-metallicity streams (Wan et al. 2020; Martin et al. 2022a), the most metal-poor of which is the C-19 stream (Martin et al. 2022b). Originally identified as an EMP stream from the Pristine photometric metallicity survey, follow-up spectroscopic observations of its brightest stars confirmed the stream stars have [Fe/H] = −3.38, with an unresolved metallicity dispersion of less than 0.18 dex at the 95% confidence level. The latter strongly suggests that the C-19 progenitor was a globular cluster. This is also supported by the relatively large variation in light elements between two members, a distinctive signature of globular clusters (see, e.g., Gratton et al. 2004; Bastian & Lardo 2018, and references within). Previous observations have also highlighted a tension between the dynamical properties and its presumed globular cluster progenitor. C-19 has a large velocity dispersion for a cluster (σv = ![Mathematical equation: $\[6.2_{-1.4}^{+2.0}\]$](/articles/aa/full_html/2025/06/aa54119-25/aa54119-25-eq2.png) km s−1), with an estimated mass of only a few times 104 M⊙, based on precise velocity measurement of ten members brighter than G = 17.6 (Yuan et al. 2022b). This is further consolidated by the measurements of 12 faint subgiant members (G ≈ 20) by X-Shooter on ESO 8.2 m Very Large Telescope (VLT) (Bonifacio et al. 2024). C-19 is the most metal-poor system we have been able to obtain precise chemodynamical measurements for, and current data show that it is a much more complicated structure than expected.
km s−1), with an estimated mass of only a few times 104 M⊙, based on precise velocity measurement of ten members brighter than G = 17.6 (Yuan et al. 2022b). This is further consolidated by the measurements of 12 faint subgiant members (G ≈ 20) by X-Shooter on ESO 8.2 m Very Large Telescope (VLT) (Bonifacio et al. 2024). C-19 is the most metal-poor system we have been able to obtain precise chemodynamical measurements for, and current data show that it is a much more complicated structure than expected.
Previous studies also revealed a new member star separated by 30° from the main body (Yuan et al. 2022b), which opens the promise that there could be more as-yet undiscovered C-19 members along the orbit. From the perspective of the formation of the first stellar structures, finding more bright stars in the stream would enable us to obtain their detailed elemental abundances and characterize the nature of the stream progenitor. In this work, we report a thorough search for bright C-19 members (G ≲ 16.0) throughout the sky. This task is now possible thanks to the new Gaia DR3 and the BP and RP (BP/RP) spectra that have been used to derive metallicities over the full sky, combined with the improved search capabilities from the fusion of STREAMFINDER and StarGO (Yuan et al. 2018; Ibata et al. 2021; Yuan et al. 2022a). Using high-resolution spectra from telescopes in both hemispheres, we are able to confirm their memberships based on both velocity and metallicity.
The identification of candidate members is explained in detail in Sect. 2. The analysis of the metallicities of the observed candidates from combined telescope programs is described in Sect. 3. The updated dynamical properties of C-19, including all the newly confirmed members, are derived in Sect. 4. The study of the chemical signature of a subsample of the stars reported here will be presented in a forthcoming paper (Venn et al., in prep.).
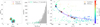 |
Fig. 1 (a) Self-organizing map trained by the STREAMFINDER catalog in the space of (E, Lz, θ, ϕ). The gray color bar represents the differences in the weight vectors between neighboring neurons. Previously confirmed C-19 members are projected onto the SOM and plotted as red crosses. (b) Histogram of the logarithmic distances in the weight vector space between the existing C-19 stars and stars from the STREAMFINDER catalog (ΔC19). Stars below the first percentile are selected as candidate C-19 members and shown in green in the histogram. They are also plotted as small colored circles in the other panels, with the color representing their proper motions in Gaia DR3 along the declination direction, μδ. Candidates brighter than G = 17.5 are further highlighted by yellow circles. (c) On-sky projection of the candidate members, color coded by μδ. Two stream segments are identifiable with similar μδ. The final four candidates for follow-up, selected through other means (see text) are highlighted with black circles. |
2 Member identification
2.1 Before Gaia DR3
We first searched for stars similar to known C-19 stars in dynamical space. This was done by applying StarGO to a STREAMFINDER catalog of stars likely to be in a stream, between 10 and 30 kpc. Contrary to the main Gaia EDR3 STREAMFINDER catalog (Ibata et al. 2021), we considered stars with lower probabilities, using an 8σ instead of the 10σ originally used by Ibata et al. (2021). StarGO uses a self-organizing map (SOM) to visualize the clustering of these stars in the (E, Lz, θ, ϕ) space, where the latter two quantities characterize directions of the angular momentum vector:
![Mathematical equation: $\[\theta=\arccos (L_z / L), \quad \quad \phi=\arctan (L_x / L_y).\]$](/articles/aa/full_html/2025/06/aa54119-25/aa54119-25-eq3.png) (1)
(1)
The 2D neuron map trained by the STREAMFINDER catalog is shown in Fig. 1a, where a neuron is located at each grid point (x, y). Stars that have similar properties in dynamical space will be located close to each other on the SOM. This enabled us to easily select stars close to the known C-19 stars on the trained SOM. Instead of remapping these stars using their real measurements (e.g., their radial velocities from the follow-up observations), we simply found them in the STREAMFINDER catalog, shown as red crosses in Fig. 1a, so they were more directly comparable to the other stars. In this way, we were not biased by offsets that might arise between the actual velocities and the predicted ones from STREAMFINDER. This procedure is similar to the one we successfully applied to the search for Cetus stream members (Yuan et al. 2022a).
To identify new candidate C-19 stars, we first calculated the distance, ΔC19, of each STREAMFINDER star to the ten C-19 members on the 2D map. This is ![Mathematical equation: $\[\Delta_{\mathrm{C} 19}= \sqrt{\left(x_{\text {SOM }}-x_{\text {SOM,C19 }}\right)^{2}+\left(y_{\text {SOM }}-y_{\text {SOM,C19 }}\right)^{2}}\]$](/articles/aa/full_html/2025/06/aa54119-25/aa54119-25-eq4.png) , whose distribution is shown in panel b of Fig. 1. We then selected the 1% of stars that have the smallest ΔC19. These stars are color coded by their proper motion in the δ direction in panels a and c of Fig. 1. Their on-sky projection (panel c of the Figure) immediately shows two potential stream segments (located at δ ~ −10° and δ ~ −45°) that have the same proper motion as that of the stream orbit from Ibata et al. (2023). In total, there are nine stars in these segments brighter than G = 17.5, which we highlight with open yellow circles. After further excluding these candidates with photometric metallicities above [Fe/H] = −2.0 in the SkyMapper DR2 (Huang et al. 2022) and the Pristine catalog (Starkenburg et al. 2017), we are left with four candidates along the C-19 orbit and away from the main body for spectroscopic follow-up. These are highlighted with open black circles in panel c of Fig. 1. We note that two of these stars are so close together, around α = 347°, that they are almost indistinguishable in the Figure. We also tested tuning the threshold on ΔC19 to be more inclusive, but this does not lead to any candidates that are more convincing.
, whose distribution is shown in panel b of Fig. 1. We then selected the 1% of stars that have the smallest ΔC19. These stars are color coded by their proper motion in the δ direction in panels a and c of Fig. 1. Their on-sky projection (panel c of the Figure) immediately shows two potential stream segments (located at δ ~ −10° and δ ~ −45°) that have the same proper motion as that of the stream orbit from Ibata et al. (2023). In total, there are nine stars in these segments brighter than G = 17.5, which we highlight with open yellow circles. After further excluding these candidates with photometric metallicities above [Fe/H] = −2.0 in the SkyMapper DR2 (Huang et al. 2022) and the Pristine catalog (Starkenburg et al. 2017), we are left with four candidates along the C-19 orbit and away from the main body for spectroscopic follow-up. These are highlighted with open black circles in panel c of Fig. 1. We note that two of these stars are so close together, around α = 347°, that they are almost indistinguishable in the Figure. We also tested tuning the threshold on ΔC19 to be more inclusive, but this does not lead to any candidates that are more convincing.
We observed these four most likely candidates using the Magellan telescope on 19 August 2022 (PI: Jiang), with an exposure time of 20–30 minutes for each of the three targets fainter than G = 16.0, and 10 minutes for the most southern one (6559328209695612544) with G = 13.7. We used the standard setup of the Magellan Inamori Kyocera Echelle (MIKE) spectrograph (0.7″ × 5.0″ slit, 2×2 bin, standard grating angle), which reaches a resolving power of R ~ 28 000 and ~35 000 in the red and blue wavelength regions, respectively (Bernstein et al. 2003). The data were reduced with the MIKE Carnegie Python pipeline (Kelson 2003). We derived their radial velocities using iSpec (Blanco-Cuaresma et al. 2014; Blanco-Cuaresma 2019), by comparison with standard star HD 182572 observed during the same night. All of the candidates have velocities consistent with the C-19 orbit, listed as stars1 in Table 1. From experience using MIKE, we note that it is very difficult to calibrate velocities extracted from its spectra at better than ~2 km s−1. We therefore assumed this value as the systematic floor to the MIKE velocity uncertainties, and the statistical uncertainties are denoted as δ(vr) with a star symbol in the upper script in the last column of Table 1. Given the large velocity dispersion of C-19, this choice does impact our inference on the velocity dispersion or the membership. We combined both systematic and statistical uncertainties to derive the velocity dispersion of the stream in Sect. 4. These four stars are plotted as orange circles in Fig. 2. Two of them are located close to the member separated by 30° away from the main body, which was previously confirmed by Yuan et al. (2022b), and the other two are located 30° further south. Their spectra also show that they all have metallicities ≈−3.2, which further confirms their membership (see details in Sect. 3).
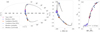 |
Fig. 2 (a) On-sky projection of the updated sample of C-19 stream members. Previously identified members are represented by magenta daggers (Yuan et al. 2022b) and purple crosses (Bonifacio et al. 2024). The solid black line corresponds to the C-19 orbit derived by Ibata et al. (2023), and the small gray dots represent the simulated stream from Errani et al. (2022). Candidates identified from the fusion of StarGO and STREAMFINDER are plotted as orange circles, and the candidates identified using a star-by-star search of photometric metallicity catalogs after Gaia DR3 are plotted as blue circles. All shown members have radial velocities consistent with the orbit, as shown in panel b. Stars that have spectroscopic [Fe/H] < −3.0 are considered as members and are highlighted with solid black circles. The other stars are probable members and highlighted by dotted circles (see text for more details). (c) Color-magnitude diagram of all the C-19 members previously identified or from this study. The gray crosses denote candidate members without radial velocity information (Yuan et al. 2022b). The solid black line here represents the 12-Gyr isochrone with [Fe/H] = −2.2 from the PARSEC model (Bressan et al. 2012; Fu et al. 2018). |
2.2 After Gaia DR3
Gaia DR3 greatly expands the radial velocity sample (RVS) to G = 16, with an average magnitude of G ≈ 14.5 (Katz et al. 2023). Moreover, using the Ca H & K band constructed from the Gaia BP/RP spectra (Carrasco et al. 2021; Andrae et al. 2023; Montegriffo et al. 2023), we are able to estimate photometric metallicities for very metal-poor stars with G ≲ 16.0 (the Pristine-Gaia synthetic catalog; Martin et al. 2024). All this new information makes it possible to conduct a star-by-star search for C-19 members, using our knowledge of the orbit and the metallicity of the stream.
We started with stars that have Gaia RVS radial velocities along with Pristine-Gaia synthetic metallicities [Fe/H] < −2.8 (using their giant photometric metallicity model). Then we selected those stars along the C-19 trajectory in the 6D kinematic space that have differences in both tangential and radial velocities of less than 30 km s−1 with respect to the values predicted for the orbit. This approach gives us five potential members with G < 14.5. Among them, one is an EMP star discovered in SEGUE (Aoki et al. 2013) with consistent radial velocity; therefore, it is immediately confirmed. The other candidates are located along the two stream segments previously found, except for one star that is located at δ ≈ + 75°, on the other side of the Milky Way disk.
We followed up two candidates with Magellan/MIKE in August 2022 (PI: Jiang; the program already mentioned above) and one star with the Isaac Newton Telescope (INT) on 19 July 2022 (PI: Viswanathan). In the INT program, the intermediate dispersion spectrograph (IDS) is equipped with the RED+2 CCD. We used the R1200R grating, a 1.37″ slit width, and the GG495 order-sorting filter. This setting gives a resolving power of R ~ 8000 around the Ca triplet region from 7850 to 9150 Å (Viswanathan et al. 2025). The star above the disk was observed with the Subaru telescope on 20 September 2022 (PI: Yuan). In this program, we used the High Dispersion Spectrograph (HDS) in the setup of StdYd, with a slit width of 0.8″. This provides a wavelength coverage of 4000–5340 and 5450–6800 Å, R = 45 000 (Noguchi et al. 2002). The data were reduced using the IRAF1 script hdsql2. For each target, we took a quick exposure of 10 minutes, irrespective of the telescope. This allowed us to derive their metallicities for further confirmation of their membership, which is described in detail in Sect. 3. These five stars are listed as star2 in Table 1.
Up to now, we are confident that, in addition to the main body of the C-19 stream, there are two additional segments of the stream at lower declination, as revealed in panel c of Fig. 1. The previously mentioned star-by-star search approach is based on the Gaia RVS sample, which typically contains bright stars with G < 14.5. We believe that there should be additional fainter members that are awaiting discovery. Based on the detailed kinematics of the confirmed members in these two stream segments, we were able to do a similar star-by-star search in fainter stars that do not have radial velocity information. To do so, we used both Pristine-Gaia synthetic metallicities from Gaia BP/RP and proprietary Pristine metallicities for fainter stars. As before, we selected stars with [Fe/H] < −2.8 and proper motions compatible with the orbit around the known segments. We find seven candidates with 14.8 < G < 17.4, only one of which (2641204161744171392) has a radial velocity from Gaia RVS. The velocity agrees well with expectations from the C-19 orbit at this location.
We observed these seven stars with an exposure time of 10 minutes each on the nights of 2 and 4 September 2023 (PI: Ibata) using the Very Large Telescope (VLT) with the UV-visual echelle (UVES) spectrograph. The slit width was set to 0.7″, which provided a resolving power R ~ 60 000. The wavelength coverage was 3750–5000, 5700–7500, and 7660–9450 Å (Dekker et al. 2000). The observed spectra were reduced with the ESO pipeline3. We confirm that all of them have radial velocities consistent with those of the C-19 orbit at their respective positions, listed as stars3 in Table 1. We note that there is one star* (2658115921889849472) that has a quite low quality spectrum and has a difference of ~6 km s−1 in radial velocity derived from two bands around 5800–6800 Å and 8400–8750 Å. The membership is still valid despite the velocity discrepancy. But the spectrum does not have sufficient information to determine its accurate velocity as well as its metallicity. In fact, the metallicity derived from its Ca triplet region in Sect. 3 is above [Fe/H]=−3. Therefore, we do not consider this star as a confirmed member and do not take it into account in the analysis of velocity dispersion in Sect. 4.
With all these candidates with confirmed velocities, whose properties are shown in Fig. 2, the C-19 stream is continuously populated from the main body to δ = −10°. The other segment starts from δ = −38° and no members are found in between. Overall, the stream profile is more complete above δ = −10°, due to the boundaries of the Pristine survey footprint. Within the Pristine footprint, the proprietary Pristine data have more accurate Ca H & K photometry and reach fainter stars compared to the Pristine-Gaia synthetic Ca H&K from Gaia BP/RP. We therefore naturally find more fainter new members (G ≳ 16) within its sky coverage. The lack of deeper Ca H&K data in the south possibly explains the gap in the current distribution of C-19. The furthest member in the north is separated from the main body of the stream by the Milky Way disk. It is also located in a region without overlap with the Pristine footprint.
Stellar parameters for the new C-19 member stars.
Metallicities for the new C-19 member stars.
3 Metallicity
For all the 16 stars observed in this work, we estimated the stellar parameters, the distance, and the extinction by fitting the metal-poor (Z = 2 × 10⁻⁵, corresponding to [Fe/H] = −3.2), α-enhanced BASTI-IAC isochrones (Hidalgo et al. 2018; Pietrinferni et al. 2021) to the Gaia and 2MASS photometry (Cutri et al. 2003; Skrutskie et al. 2006), as well as the Gaia parallax of the star. We maximized the likelihood by varying the distance, initial mass, age, and extinction. We used a flat prior between 10 Gyr and 14 Gyr for the age, and the initial mass function by Chabrier (2003) for the mass. We added 0.05 mag error floors in quadrature to the reported uncertainties in photometry, to account for possible systematic offsets between the observations and the isochrone models. The inferred stellar parameters are shown in Table 2.
Combining all the follow-up programs, there are 14 stars that have high-resolution spectra with a resolving power R ≳ 30 000 using Subaru/HDS, Magellan/MIKE, and VLT/UVES. Among them, eight stars have sufficiently high signal-to-noise ratio (S/N) spectra for the analysis of individual Fe lines (see Table 1). The five stars with UVES spectra do not have a high enough S/N for such analysis, but we are still able to infer metallicities from the Ca II triplet (CaT) lines for all of them. In order to check consistency between these two methods, we derived metallicities using the CaT lines for the nine stars with high S/N HR spectra. The two analysis methods are briefly described below.
The first method is based on equivalent widths of individual Fe lines and stellar parameters. We first measured the equivalent widths by fitting a Gaussian profile to each Fe line. We then constructed a model atmosphere by interpolating the grid of MARCS model atmospheres (Gustafsson et al. 2008), using the stellar parameters of the studied star. Since S/N is not sufficient to determine the microturbulent velocity (vt) for most of our targets, an empirical approach was adopted here. We first fitted a linear function to the relation between vt and log g among the extremely metal-poor giants ([Fe/H] < −2.8, Teff < 5500 K, and log g < 3.0) of Li et al. (2022a). The vt values we adopted for the C-19 stars were determined from this linear relation with the estimated log g. Based on these inputs (vt, Teff, log g, and the equivalent widths), we derived the Fe abundance using the radiative transfer code MOOG (Sneden 1973), from 7 to 57 neutral Fe lines. The uncertainties on the derived metallicities are dominated by the uncertainties on Teff and are estimated to be ~0.1 dex.
In the second approach, we first measured the equivalent widths of the CaT lines by fitting a Voigt profile to each component. We then derived the metallicity using the relation between metallicity, total equivalent width, and absolute Ks band magnitude, as calibrated by Carrera et al. (2013). The metallicity uncertainties are dominated by the scatter around the calibrated relation (0.17 dex), yielding a typical uncertainty of ~0.2 dex in metallicity for this method.
The metallicities reported in this work come from these two methods, as well as from spectra with different resolutions. Thus, a consistency check is necessary. We first compared the metallicities of the nine stars with high S/N HR spectra derived using the two methods described above. These stars are color coded by S/N in the top panel of Fig. 3. By taking into account the uncertainties, the [Fe/H] metallicities based on the Fe lines and [Fe/H]CaT, derived from the CaT lines, are close to the one-to-one line. The most discrepant star (2640793013114783872) corresponds to the lowest S/N spectra (S/N1 = 7 in Table 1), for which both methods may still work. Excluding this low S/N star, the overall comparison shows that metallicities derived from these two methods are consistent within ~0.2 dex.
We then compared the metallicities for the same stars that are derived from spectra of different resolutions, as well as from these two methods. There are three stars for which we could do this comparison. In the middle panel of Fig. 3, [Fe/H] represents the measurements from Fe lines using the different HR spectra, while [Fe/H]CaT shows estimates using low-tomedium spectra from INT/IDS with R ~ 8000, covering the CaT region. The different values for these three stars (yellow and magenta symbols) agree well with each other. Here, the two stars with VLT/UVES spectra are existing C-19 members Pristine 355.32+27.59 (2865251577418971392) and Pristine 354.96+28.47 (2866151046649496832), from the C-19 discovery study (Martin et al. 2022b). The other star that has one Subaru/HDS spectrum and one INT/IDS spectrum is a new member confirmed in this study.
To summarize this section, we selected 16 candidate members of the C-19 stream based on their kinematics in Sect. 2 and confirm 13 new members that have spectroscopic metallicities consistent within the systematic uncertainty (0.2 dex) of the C-19 stream (Martin et al. 2022b) when we take into account the uncertainties of our methods. We plot the metallicity distribution (MDF) of [FeI/H] from the C-19 members in Yuan et al. (2022b) as the purple histogram, as well as the MDFs of newly confirmed members, in the bottom panel of Fig. 3, where the blue and orange histograms denote the MDFs of [Fe/H] and [Fe/H]CaT, respectively. The mean of the old members ⟨[FeI/H]⟩ = −3.37, compared to the mean of the new members: ⟨[Fe/H]⟩ = −3.25 and ⟨[Fe/H]CaT⟩ = −3.22. The offset is less than the systematic uncertainty of 0.2 dex reported in Martin et al. (2022b). Assuming the metallicity distribution is Gaussian, and using a likelihood analysis similar to that of Martin et al. (2022b), the inference on the metallicity dispersion comes out as consistent with no dispersion for both sets of metallicities listed in Table 2. However, since the spectra of the majority of stars in this paper have rather low S/N, we postpone a detailed discussion on this topic to an upcoming paper (Venn et al., in prep) that reaches the same conclusion, but based on much higher S/N reobservations of several of the bright members presented here. There are three stars with metallicities beyond the systematic uncertainty of the C-19 stream which are not included in the MDFs. These stars still all have low metallicity values (< − 2.5) and are marked as “probable members” in Table 2 and highlighted by dotted circles in Figs. 2 and 4. One of them (2658115921889849472*) has a discrepancy in velocities derived from two bands due to the low-quality spectrum, as mentioned in Sect. 2. We can see that the probable members are not further away from the orbit than the confirmed ones and that they have a similar confidence in membership shown in kinematic space. This may suggest that there was an additional, slightly more metal-rich population in the C-19 progenitor. Intriguingly, this result is similar to those of Bonifacio et al. (2024) for turnoff stars in the main body of C-19. However, these stars also all have low S/N spectra and we cannot rule out that the low S/N is unduly affecting our results. Higher S/N spectra are required to confirm their metallicities.
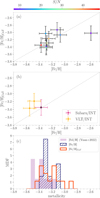 |
Fig. 3 Metallicities of the C-19 members. (a) Comparison of the metallicities derived from the two methods for the same spectra of the nine stars that have high S/N HR spectra. The symbols are color coded by S/N1 (Table 1). (b) Comparison of the metallicities derived from the HR spectra using Fe lines and the low-to-medium spectra using Ca triplet equivalent widths for three C-19 stars. The two existing member stars in Yuan et al. (2022b) with VLT/UVES spectra are plotted with yellow symbols and the new member with a Subaru/HDS spectrum is shown in magenta. (c) MDFs of [Fe/H] (blue) and [Fe/H]CaT (orange) in this work compared to the MDF of [FeI/H] of the existing C-19 members from Yuan et al. (2022b). |
4 Velocity dispersion, width and mass
Based on the full sample of 23 confirmed members with precise radial velocities, 10 stars from Yuan et al. (2022b) and 13 stars in Sect. 3, we were able to reevaluate the dynamical properties of C-19. Here, we first rotated the equatorial coordinates to a set of stream coordinates (ϕ1, ϕ2), following the technique presented in Koposov et al. (2010) and adopting the pole and zero point of the main body of the stream (α0 = 354.356°, αpole = 81.45°, δpole = −6.346°) from Ibata et al. (2023). The resulting projection of the sample is displayed in Fig. 4, along with that of the stream orbit from the same study, which is simultaneously fitted to 29 streams, for an isolated axisymmetric Milky Way potential (Ibata et al. 2023). We then calculated the offsets in velocity (Δv = vr − vr,orbit(ϕ1)) and perpendicular angular distance (Δϕ2 = ϕ2 − ϕ2,orbit (ϕ1)) with respect to the orbit. As in Yuan et al. (2022b), we used the formalism of Martin et al. (2018) to infer the mean and dispersion of both quantities, and in this work we obtain σv = ![Mathematical equation: $\[10.9_{-1.5}^{+2.1}\]$](/articles/aa/full_html/2025/06/aa54119-25/aa54119-25-eq5.png) km s−1, shown in Fig. 5. If we simply used a polynomial fitted orbit to the confirmed members, the dispersion is slightly smaller, σv =
km s−1, shown in Fig. 5. If we simply used a polynomial fitted orbit to the confirmed members, the dispersion is slightly smaller, σv = ![Mathematical equation: $\[8.5_{-1.2}^{+1.5}\]$](/articles/aa/full_html/2025/06/aa54119-25/aa54119-25-eq6.png) km s−1. Among all the members, the star above the disk has the largest offset from the orbit, as shown in the bottom panel of Fig. 4. By excluding this star, the velocity dispersion is only slightly smaller: σv =
km s−1. Among all the members, the star above the disk has the largest offset from the orbit, as shown in the bottom panel of Fig. 4. By excluding this star, the velocity dispersion is only slightly smaller: σv = ![Mathematical equation: $\[8.9_{-1.3}^{+1.6}\]$](/articles/aa/full_html/2025/06/aa54119-25/aa54119-25-eq7.png) km s−1 using the C-19 orbit, σv =
km s−1 using the C-19 orbit, σv = ![Mathematical equation: $\[8.7_{-1.2}^{+1.6}\]$](/articles/aa/full_html/2025/06/aa54119-25/aa54119-25-eq8.png) km s−1 using a polynomial fitted orbit. To estimate the stream width, we used the densest part of the stream, i.e., the main body located close to the apocenter with the distance around 20 kpc. The dispersion in angular distance is σϕ2 =
km s−1 using a polynomial fitted orbit. To estimate the stream width, we used the densest part of the stream, i.e., the main body located close to the apocenter with the distance around 20 kpc. The dispersion in angular distance is σϕ2 = ![Mathematical equation: $\[0.62^{\circ+0.17}_{-0.12}\]$](/articles/aa/full_html/2025/06/aa54119-25/aa54119-25-eq9.png) and the stream width is translated to be ~200 pc. These new results clearly show that, over the 100° traced by the updated sample, the C-19 stream is even hotter than previously found. Previous studies focused on the main body of C-19 and gave a velocity dispersion of
and the stream width is translated to be ~200 pc. These new results clearly show that, over the 100° traced by the updated sample, the C-19 stream is even hotter than previously found. Previous studies focused on the main body of C-19 and gave a velocity dispersion of ![Mathematical equation: $\[6.2_{-1.4}^{+2.0}\]$](/articles/aa/full_html/2025/06/aa54119-25/aa54119-25-eq10.png) km s−1, a stream width of ~159 pc (Yuan et al. 2022b), and a velocity dispersion of
km s−1, a stream width of ~159 pc (Yuan et al. 2022b), and a velocity dispersion of ![Mathematical equation: $\[5.9_{-5.9}^{+3.6}\]$](/articles/aa/full_html/2025/06/aa54119-25/aa54119-25-eq11.png) km s−1 for subgiants (Bonifacio et al. 2024).
km s−1 for subgiants (Bonifacio et al. 2024).
The top panel of Fig. 4 shows that members brighter than G = 16.0 (orange circles) are nearly evenly distributed along the orbit and become just slightly more clustered in the main body, where seven bright stars are located. There are now 14 confirmed bright members (G < 16.0), which has doubled the previous number of known members presented by Yuan et al. (2022b). There is no reason to expect significant parts of the streams to have been missed at this stage, as stream segments with similar significance and similar orbital properties as C-19 should have been found using our search method in dynamical space by combining StarGO and STREAMFINDER. This is particularly true beyond the current extent of the stream, in the Galactic caps (Fig. 2), where it is easier to isolate streams because of their higher contrast with the Milky Way stellar populations. The one place where parts of the stream could still be evading detection is behind the Milky Way disk, north of the main body of C-19. The upcoming Gaia DR4 data release, with deeper BP/RP spectra, along with further extensions of the Pristine footprint in this direction, should help the search for the presence of C-19 in this low-latitude region.
With the current extension of the stream and the star-by-star search in Gaia, described in Sect. 2.2, we have checked all the low-metallicity stars in the Pristine-Gaia synthetic catalog along the stream orbit with compatible proper motions down to G ≈ 16.0 (Martin et al. 2024). Assuming the resulting sample of members is close to complete, we can update the estimated mass of the C-19 stream. This mass will still be a lower limit but should be closer to the true mass of the C-19 progenitor than earlier estimates (>3.5 × 10³ L⊙ or 0.8 × 10⁴ M⊙) based on the main body of the stream (Martin et al. 2022a). By summing the fluxes of all the stars brighter than G = 16.0 along the giant branch, the total luminosity is 1.8 × 10⁴ L⊙ after correction for the unobserved fainter stars using the luminosity function associated with the PARSEC isochrone mentioned above (Bressan et al. 2012; Fu et al. 2018) and using a Kroupa initial mass function (IMF; Kroupa 2001, 2002). Assuming a mass-to-light ratio M/L = 2–3, typical of very old stellar populations (Maraston 2005), the mass of C-19 is ~3.7–5.5 × 10⁴ M⊙, which, unsurprisingly given the much larger number of confirmed bright C-19 members, is significantly larger than the previous estimate. We note that a different IMF would also affect the derived M/L ratio (e.g., Cappellari et al. 2012). There is observational evidence suggesting that top-heavy IMFs are favored in extremely dense star-forming regions, such as the 30 Doradus star-forming region in the Large Magellanic Cloud (Schneider et al. 2018) or star-burst galaxies at redshift ~2–3 (Zhang et al. 2018; Guo et al. 2024). The C-19 progenitor was very likely a globular cluster, which could have been born in a similar environment of dense clouds and intense star formation. Assuming a top-heavy IMF calibrated for very metal-poor globular clusters (Marks et al. 2012), the M/L ratio further increases by a factor of ~1.3, which would result in an even larger progenitor mass of 5–8 × 10⁴ M⊙.
As discussed in Yuan et al. (2022b), the typical velocity dispersion of a GC stream is less than 5 km s−1 (Li et al. 2022b). However, with more spectroscopic data available for streams, more have been found to be dynamically hot. For example, the recent velocity dispersion of GD-1 is ~ 7 − 29 km s−1 (Malhan et al. 2019; Ibata et al. 2023), despite a progenitor mass of ~105 M⊙ (Ibata et al. 2020). It has been suggested that this progenitor was accreted and preprocessed inside a dark matter subhalo (Carlberg 2020; Malhan et al. 2021; Carlberg & Agler 2023). In the case of C-19, the experiment of preprocessing a globular cluster in a dark matter subhalo remains a good explanation for the observed velocity dispersion (Errani et al. 2022). A recent study by Carlberg et al. (2024) shows the tidal heating of a cold globular cluster stream by ΛCDM dark subhalos are able to increase the large velocity dispersion to values similar to the dispersion measured in the main body of C-19 (~6 km s−1). But the heated velocity dispersion values stay short of the velocity dispersion we find from the larger sample presented in this paper (~10 km s−1). Other possible scenarios to explain the high velocity dispersion would include heating by giant molecular clouds (see e.g., Amorisco et al. 2016) or, as recently shown from detailed N-body simulations of globular clusters (Wang 2020; Gieles et al. 2021; Wang et al. 2024), the presence of black holes could enhance the relaxation and disruption of a GC, leading to a larger initial line-of-sight velocity dispersion. Born in a dense and extremely metal-poor region, the C-19 progenitor may also favor a top-heavy IMF, and the strong stellar feedback from overabundant massive stars could cause the cluster to be born dynamically hot in the first place (Wang 2020; Wang et al. 2021). Finally, unresolved binaries could also lead to an artificially large velocity dispersion. From the eight C-19 stars with radial velocity measurements from Gaia, there is no noticeable variation in velocities from our measurements and those from Gaia RVS (Katz et al. 2023). We do not see unexpectedly large uncertainties in each measurement either. We note that each star only has one precise velocity measurement from our follow-up and the mean value from Gaia DR3. Therefore, future multi-epoch spectroscopic observations will be crucial for quantifying the contribution of binaries to the observed properties of C-19.
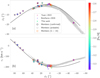 |
Fig. 4 (a) Spatial distribution of the C-19 stream members with radial velocity measurements in the (ϕ1, ϕ2) coordinate. Similar to Fig. 2, the members from previous studies are plotted as transparent red and purple circles (Martin et al. 2022a; Yuan et al. 2022b; Bonifacio et al. 2024), along with the derived orbit (Ibata et al. 2023) and the simulated stream (Errani et al. 2022). All the candidates from this work are color coded by their spectroscopic metallicities. The confirmed members have metallicities below −3, which are highlighted with solid black circles. The rest are probable members denoted by dotted circles. Among all the confirmed members, those brighter than G = 16 are further highlighted with orange circles, which are just slightly clustered in the main body. (b) The C-19 stream in the (ϕ1, vr) space, where the radial velocity measurements are taken from Yuan et al. (2022b), Bonifacio et al. (2024), and this work. |
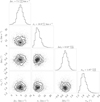 |
Fig. 5 Probability distribution functions (PDFs) of the mean offsets of the 22 confirmed C-19 member stars from the orbit in velocity (Δv) and position (Δϕ2), along with the corresponding dispersions, σv and σϕ2. The bottom left-hand panels shows the two-dimensional PDF, taken directly from the Markov chain Monte Carlo sampling; the histograms display the marginalized one-dimensional PDFs for the three parameters. |
5 Conclusions
In this work, we searched for potential members of C-19 in dynamical space by applying StarGO to the low-significance stream stars from STREAMFINDER. With this technique, we found four new C-19 members, located 30° and 60° south from the main body. After Gaia DR3, we performed star-by-star searches along the C-19 orbit using very low-metallicity star catalogs from the Pristine survey (both based on genuine Pristine data and on Gaia XP spectra; Martin et al. 2024). In total, we confirm 13 new members of the C-19 stream through high-resolution spectroscopy. All new members have velocities compatible with predictions from the orbit based on the main body of the stream (Martin et al. 2022a; Ibata et al. 2023), and their metallicities are, within the uncertainty of measurements, in agreement with the extremely metal-poor mean metallicity of the stream.
Our search for C-19 members in the bright regime (G < 16.0) utilizes the all-sky Gaia data and we therefore expect that the distribution of these bright stars gives a relatively fair representation of the extent of the stream. Its main body, where it was originally detected, is centered around δ ~ +26° (Ibata et al. 2021; Martin et al. 2022b), and remains the densest part; but we now show that it extends continuously down to δ ~ −15° in the south. A separate segment of the stream of four members is located at δ ~ −40°. One single member is found on the other side of the Milky Way disk, at δ = +75°, in the north. Overall, the C-19 stream is now shown to extend over ~100° on the sky. By summing up the fluxes from bright stars along the giant branch (G < 16.0), we revise the lower mass limit of the stream significantly upward to 3.7–5.5 × 10⁴ M⊙. Based on the velocity measurements of all members, accurate at the ~1 km s−1 level, we revise upward both the velocity dispersion of the stream to ![Mathematical equation: $\[10.9_{-1.5}^{+2.1}\]$](/articles/aa/full_html/2025/06/aa54119-25/aa54119-25-eq12.png) km s−1, and its Gaussian width to ~200 pc. The stream is both hotter and more diffuse than previously reported (Martin et al. 2022a; Yuan et al. 2022b).
km s−1, and its Gaussian width to ~200 pc. The stream is both hotter and more diffuse than previously reported (Martin et al. 2022a; Yuan et al. 2022b).
From a dynamical point of view, it remains a puzzle as to how to explain the large velocity dispersion with the relatively small mass of the stream progenitor. Our suggested scenario of a preheating and disruption of the C-19 cluster in its own dark matter halo remains a possibility (Errani et al. 2022). In addition, tidal heating from the interaction of the stream with dark matter subhalos (Carlberg et al. 2024) or giant molecular clouds are also possible. The scenario of a top-heavy IMF would result in an overabundance of massive stars whose stellar feedback could lead to a dynamically hotter initial globular cluster immediately after its birth. Finally, the contribution of binary systems to the observed velocity dispersion remains unknown and could significantly inflate it (Wang et al. 2024). It is crucial and timely to obtain multiple spectroscopic observations of known C-19 members to hunt for spectroscopic binaries if we are to understand the dynamical nature of this exceptional stream.
Data availability
The updated C-19 member list is provided at https://doi.org/10.5281/zenodo.15240247
Acknowledgements
Z.Y., N.F.M., and R.A.I. acknowledge funding from the European Research Council (ERC) under the European Unions Horizon 2020 research and innovation programme (grant agreement No. 834148). A.V. gratefully acknowledges support from the Canadian Institute for Theoretical Astrophysics (CITA) through a CITA National Fellowship. This work has made use of data from the European Space Agency (ESA) mission Gaia (https://www.cosmos.esa.int/gaia), processed by the Gaia Data Processing and Analysis Consortium (DPAC, https://www.cosmos.esa.int/web/gaia/dpac/consortium). Funding for the DPAC has been provided by national institutions, in particular the institutions participating in the Gaia Multilateral Agreement.
References
- Amorisco, N. C., Gómez, F. A., Vegetti, S., & White, S. D. M. 2016, MNRAS, 463, L17 [Google Scholar]
- Andrae, R., Fouesneau, M., Sordo, R., et al. 2023, A&A, 674, A27 [CrossRef] [EDP Sciences] [Google Scholar]
- Aoki, W., Beers, T. C., Lee, Y. S., et al. 2013, AJ, 145, 13 [CrossRef] [Google Scholar]
- Argast, D., Samland, M., Gerhard, O. E., & Thielemann, F. K. 2000, A&A, 356, 873 [Google Scholar]
- Bastian, N., & Lardo, C. 2018, ARA&A, 56, 83 [Google Scholar]
- Bernstein, R., Shectman, S. A., Gunnels, S. M., Mochnacki, S., & Athey, A. E. 2003, SPIE Conf. Ser., 4841, 1694 [NASA ADS] [Google Scholar]
- Blanco-Cuaresma, S. 2019, MNRAS, 486, 2075 [Google Scholar]
- Blanco-Cuaresma, S., Soubiran, C., Heiter, U., & Jofré, P. 2014, A&A, 569, A111 [CrossRef] [EDP Sciences] [Google Scholar]
- Bonifacio, P., Caffau, E., François, P., et al. 2024, arXiv e-prints [arXiv:2412.20776] [Google Scholar]
- Bressan, A., Marigo, P., Girardi, L., et al. 2012, MNRAS, 427, 127 [NASA ADS] [CrossRef] [Google Scholar]
- Cappellari, M., McDermid, R. M., Alatalo, K., et al. 2012, Nature, 484, 485 [Google Scholar]
- Carlberg, R. G. 2020, ApJ, 889, 107 [NASA ADS] [CrossRef] [Google Scholar]
- Carlberg, R. G., & Agler, H. 2023, ApJ, 953, 99 [Google Scholar]
- Carlberg, R. G., Ibata, R., Martin, N. F., et al. 2024, arXiv e-prints [arXiv:2410.22966] [Google Scholar]
- Carrasco, J. M., Weiler, M., Jordi, C., et al. 2021, A&A, 652, A86 [NASA ADS] [CrossRef] [EDP Sciences] [Google Scholar]
- Carrera, R., Pancino, E., Gallart, C., & del Pino, A. 2013, MNRAS, 434, 1681 [NASA ADS] [CrossRef] [Google Scholar]
- Chabrier, G. 2003, PASP, 115, 763 [Google Scholar]
- Cutri, R. M., Skrutskie, M. F., van Dyk, S., et al. 2003, 2MASS All Sky Catalog of point sources [Google Scholar]
- Dekker, H., D’Odorico, S., Kaufer, A., Delabre, B., & Kotzlowski, H. 2000, SPIE Conf. Ser., 4008, 534 [Google Scholar]
- Errani, R., Navarro, J. F., Ibata, R., et al. 2022, MNRAS, 514, 3532 [NASA ADS] [CrossRef] [Google Scholar]
- Fu, X., Bressan, A., Marigo, P., et al. 2018, MNRAS, 476, 496 [NASA ADS] [CrossRef] [Google Scholar]
- Gieles, M., Erkal, D., Antonini, F., Balbinot, E., & Peñarrubia, J. 2021, Nat. Astron., 5, 957 [NASA ADS] [CrossRef] [Google Scholar]
- Gratton, R., Sneden, C., & Carretta, E. 2004, ARA&A, 42, 385 [Google Scholar]
- Guo, Z., Zhang, Z.-Y., Yan, Z., et al. 2024, ApJ, 970, 136 [Google Scholar]
- Gustafsson, B., Edvardsson, B., Eriksson, K., et al. 2008, A&A, 486, 951 [NASA ADS] [CrossRef] [EDP Sciences] [Google Scholar]
- Hidalgo, S. L., Pietrinferni, A., Cassisi, S., et al. 2018, ApJ, 856, 125 [Google Scholar]
- Huang, Y., Beers, T. C., Wolf, C., et al. 2022, ApJ, 925, 164 [NASA ADS] [CrossRef] [Google Scholar]
- Ibata, R., Thomas, G., Famaey, B., et al. 2020, ApJ, 891, 161 [Google Scholar]
- Ibata, R., Malhan, K., Martin, N., et al. 2021, ApJ, 914, 123 [NASA ADS] [CrossRef] [Google Scholar]
- Ibata, R., Malhan, K., Tenachi, W., et al. 2023, arXiv e-prints [arXiv:2311.17202] [Google Scholar]
- Katz, D., Sartoretti, P., Guerrier, A., et al. 2023, A&A, 674, A5 [NASA ADS] [CrossRef] [EDP Sciences] [Google Scholar]
- Kelson, D. D. 2003, PASP, 115, 688 [NASA ADS] [CrossRef] [Google Scholar]
- Koposov, S. E., Rix, H.-W., & Hogg, D. W. 2010, ApJ, 712, 260 [Google Scholar]
- Kroupa, P. 2001, MNRAS, 322, 231 [NASA ADS] [CrossRef] [Google Scholar]
- Kroupa, P. 2002, Science, 295, 82 [Google Scholar]
- Li, H., Aoki, W., Matsuno, T., et al. 2022a, ApJ, 931, 147 [Google Scholar]
- Li, T. S., Ji, A. P., Pace, A. B., et al. 2022b, ApJ, 928, 30 [Google Scholar]
- Malhan, K., Ibata, R. A., Carlberg, R. G., Valluri, M., & Freese, K. 2019, ApJ, 881, 106 [NASA ADS] [CrossRef] [Google Scholar]
- Malhan, K., Valluri, M., & Freese, K. 2021, MNRAS, 501, 179 [Google Scholar]
- Maraston, C. 2005, MNRAS, 362, 799 [NASA ADS] [CrossRef] [Google Scholar]
- Marks, M., Kroupa, P., Dabringhausen, J., & Pawlowski, M. S. 2012, MNRAS, 422, 2246 [NASA ADS] [CrossRef] [Google Scholar]
- Martin, N. F., Collins, M. L. M., Longeard, N., & Tollerud, E. 2018, ApJ, 859, L5 [NASA ADS] [CrossRef] [Google Scholar]
- Martin, N. F., Ibata, R. A., Starkenburg, E., et al. 2022a, MNRAS, 516, 5331 [Google Scholar]
- Martin, N. F., Venn, K. A., Aguado, D. S., & Starkenburg, E. 2022b, Nature, 601, 45 [Google Scholar]
- Martin, N. F., Starkenburg, E., Yuan, Z., et al. 2024, A&A, 692, A115 [NASA ADS] [CrossRef] [EDP Sciences] [Google Scholar]
- Montegriffo, P., De Angeli, F., Andrae, R., et al. 2023, A&A, 674, A3 [NASA ADS] [CrossRef] [EDP Sciences] [Google Scholar]
- Noguchi, K., Aoki, W., Kawanomoto, S., et al. 2002, PASJ, 54, 855 [NASA ADS] [CrossRef] [Google Scholar]
- Pietrinferni, A., Hidalgo, S., Cassisi, S., et al. 2021, ApJ, 908, 102 [NASA ADS] [CrossRef] [Google Scholar]
- Schneider, F. R. N., Sana, H., Evans, C. J., et al. 2018, Science, 359, 69 [NASA ADS] [CrossRef] [Google Scholar]
- Skrutskie, M. F., Cutri, R. M., Stiening, R., & Weinberg, M. D. 2006, AJ, 131, 1163 [NASA ADS] [CrossRef] [Google Scholar]
- Sneden, C. 1973, ApJ, 184, 839 [Google Scholar]
- Starkenburg, E., Martin, N., & Youakim, K. 2017, MNRAS, 471, 2587 [NASA ADS] [CrossRef] [Google Scholar]
- Viswanathan, A., Yuan, Z., Ardern-Arentsen, A., et al. 2025, A&A, 695, A112 [NASA ADS] [CrossRef] [EDP Sciences] [Google Scholar]
- Wan, Z., Lewis, G. F., Li, T. S., et al. 2020, Nature, 583, 768 [Google Scholar]
- Wang, L. 2020, MNRAS, 491, 2413 [NASA ADS] [Google Scholar]
- Wang, L., Fujii, M. S., & Tanikawa, A. 2021, MNRAS, 504, 5778 [NASA ADS] [CrossRef] [Google Scholar]
- Wang, L., Gieles, M., Baumgardt, H., et al. 2024, MNRAS, 527, 7495 [Google Scholar]
- Yuan, Z., Chang, J., Banerjee, P., et al. 2018, ApJ, 863, 26 [NASA ADS] [CrossRef] [Google Scholar]
- Yuan, Z., Malhan, K., Sestito, F., et al. 2022a, ApJ, 930, 103 [Google Scholar]
- Yuan, Z., Martin, N. F., & Ibata, R. A. 2022b, MNRAS, 514, 1664 [Google Scholar]
- Zavala, J. A., Castellano, M., Akins, H. B., et al. 2025, Nat. Astron., 9, 155 [Google Scholar]
- Zhang, Z.-Y., Romano, D., Ivison, R. J., Papadopoulos, P. P., & Matteucci, F. 2018, Nature, 558, 260 [Google Scholar]
IRAF is distributed by the National Optical Astronomy Observatory, which is operated by the Association of Universities for Research in Astronomy (AURA) under a cooperative agreement with the National Science Foundation.
All Tables
All Figures
|
Fig. 1 (a) Self-organizing map trained by the STREAMFINDER catalog in the space of (E, Lz, θ, ϕ). The gray color bar represents the differences in the weight vectors between neighboring neurons. Previously confirmed C-19 members are projected onto the SOM and plotted as red crosses. (b) Histogram of the logarithmic distances in the weight vector space between the existing C-19 stars and stars from the STREAMFINDER catalog (ΔC19). Stars below the first percentile are selected as candidate C-19 members and shown in green in the histogram. They are also plotted as small colored circles in the other panels, with the color representing their proper motions in Gaia DR3 along the declination direction, μδ. Candidates brighter than G = 17.5 are further highlighted by yellow circles. (c) On-sky projection of the candidate members, color coded by μδ. Two stream segments are identifiable with similar μδ. The final four candidates for follow-up, selected through other means (see text) are highlighted with black circles. |
| In the text | |
|
Fig. 2 (a) On-sky projection of the updated sample of C-19 stream members. Previously identified members are represented by magenta daggers (Yuan et al. 2022b) and purple crosses (Bonifacio et al. 2024). The solid black line corresponds to the C-19 orbit derived by Ibata et al. (2023), and the small gray dots represent the simulated stream from Errani et al. (2022). Candidates identified from the fusion of StarGO and STREAMFINDER are plotted as orange circles, and the candidates identified using a star-by-star search of photometric metallicity catalogs after Gaia DR3 are plotted as blue circles. All shown members have radial velocities consistent with the orbit, as shown in panel b. Stars that have spectroscopic [Fe/H] < −3.0 are considered as members and are highlighted with solid black circles. The other stars are probable members and highlighted by dotted circles (see text for more details). (c) Color-magnitude diagram of all the C-19 members previously identified or from this study. The gray crosses denote candidate members without radial velocity information (Yuan et al. 2022b). The solid black line here represents the 12-Gyr isochrone with [Fe/H] = −2.2 from the PARSEC model (Bressan et al. 2012; Fu et al. 2018). |
| In the text | |
|
Fig. 3 Metallicities of the C-19 members. (a) Comparison of the metallicities derived from the two methods for the same spectra of the nine stars that have high S/N HR spectra. The symbols are color coded by S/N1 (Table 1). (b) Comparison of the metallicities derived from the HR spectra using Fe lines and the low-to-medium spectra using Ca triplet equivalent widths for three C-19 stars. The two existing member stars in Yuan et al. (2022b) with VLT/UVES spectra are plotted with yellow symbols and the new member with a Subaru/HDS spectrum is shown in magenta. (c) MDFs of [Fe/H] (blue) and [Fe/H]CaT (orange) in this work compared to the MDF of [FeI/H] of the existing C-19 members from Yuan et al. (2022b). |
| In the text | |
|
Fig. 4 (a) Spatial distribution of the C-19 stream members with radial velocity measurements in the (ϕ1, ϕ2) coordinate. Similar to Fig. 2, the members from previous studies are plotted as transparent red and purple circles (Martin et al. 2022a; Yuan et al. 2022b; Bonifacio et al. 2024), along with the derived orbit (Ibata et al. 2023) and the simulated stream (Errani et al. 2022). All the candidates from this work are color coded by their spectroscopic metallicities. The confirmed members have metallicities below −3, which are highlighted with solid black circles. The rest are probable members denoted by dotted circles. Among all the confirmed members, those brighter than G = 16 are further highlighted with orange circles, which are just slightly clustered in the main body. (b) The C-19 stream in the (ϕ1, vr) space, where the radial velocity measurements are taken from Yuan et al. (2022b), Bonifacio et al. (2024), and this work. |
| In the text | |
|
Fig. 5 Probability distribution functions (PDFs) of the mean offsets of the 22 confirmed C-19 member stars from the orbit in velocity (Δv) and position (Δϕ2), along with the corresponding dispersions, σv and σϕ2. The bottom left-hand panels shows the two-dimensional PDF, taken directly from the Markov chain Monte Carlo sampling; the histograms display the marginalized one-dimensional PDFs for the three parameters. |
| In the text | |
Current usage metrics show cumulative count of Article Views (full-text article views including HTML views, PDF and ePub downloads, according to the available data) and Abstracts Views on Vision4Press platform.
Data correspond to usage on the plateform after 2015. The current usage metrics is available 48-96 hours after online publication and is updated daily on week days.
Initial download of the metrics may take a while.