| Issue |
A&A
Volume 693, January 2025
|
|
|---|---|---|
| Article Number | A173 | |
| Number of page(s) | 7 | |
| Section | Extragalactic astronomy | |
| DOI | https://doi.org/10.1051/0004-6361/202451699 | |
| Published online | 14 January 2025 | |
The changing-look AGN SDSS J101152.98+544206.4 is returning to a type I state
1
Kavli Institute for Astronomy and Astrophysics, Peking University, Beijing 100871, People’s Republic of China
2
Department of Astronomy, School of Physics, Peking University, Beijing 100871, People’s Republic of China
3
Leiden Observatory, Leiden University, P.O. Box 9513 NL-2300 RA Leiden, The Netherlands
4
Kapteyn Astronomical Institute, University of Groningen, P.O. Box 800 NL-9700 AV Groningen, The Netherlands
5
Department of Astronomy, School of Physics, Huazhong University of Science and Technology, 1037 Luoyu Road, Wuhan 430074, People’s Republic of China
6
Shanghai Astronomical Observatory, Chinese Academy of Sciences, 80 Nandan Road, Shanghai 200030, People’s Republic of China
7
University of Science and Technology of China, No.96, JinZhai Road Baohe District, Hefei, Anhui 230026, People’s Republic of China
8
School of Physics and Electrical Engineering, Liupanshui Normal University, Liupanshui, Guizhou 553004, People’s Republic of China
9
Key Laboratory of Optical Astronomy, National Astronomical Observatories, Chinese Academy of Sciences, Beijing 100012, People’s Republic of China
10
Steward Observatory, University of Arizona, 933 N Cherry Avenue, Tucson, AZ 85721, USA
⋆ Corresponding authors; This email address is being protected from spambots. You need JavaScript enabled to view it.
; This email address is being protected from spambots. You need JavaScript enabled to view it.
Received:
29
July
2024
Accepted:
10
December
2024
Abstract
Aims. We discovered that the changing-look active galactic nucleus (CLAGN) SDSS J101152.98+544206.4 (J1011+5442 for short) gradually returns to the type I state after a short period between 2014 and 2019 in the faint type 1.9 state.
Methods. Motivated by the rebrightening in the optical and mid-infrared light curves from ZTF and WISE, we obtained new spectroscopic observations with the Xinglong 2.16 m, the Lijiang 2.4 m, and the MMT 6.5 m optical telescopes in 2024.
Results. After changing its optical AGN type from 1 to 1.9 between 2003 and 2015 according to the repeat spectroscopy from the Time Domain Spectroscopic Survey, J1011+5442 returned to its type I state in 2024. We detect the significant and very broad Hβ lines (full width at half maximum of ≳5000 km/s) based on the new spectra, which suggests that J1011+5442 was in the intermediate state between the dim state in 2015 and the bright state in 2003. The long-term optical and mid-infrared light curves also show a brightening trend between 2019 and 2024 as the broad Hβ line appeared. The time lag of about 100 days between the mid-infrared and optical variability is consistent with the prediction of dust reverberation mapping.
Conclusions. The behavior of the photometric and spectroscopic observations of J1011+5442 is consistent with the argument that the repeating changing-look phenomenon is regulated by the variation in the accretion rate.
Key words: galaxies: active / galaxies: Seyfert / quasars: individual: SDSS J101152.98+544206.4
© The Authors 2025
 Open Access article, published by EDP Sciences, under the terms of the Creative Commons Attribution License (https://creativecommons.org/licenses/by/4.0), which permits unrestricted use, distribution, and reproduction in any medium, provided the original work is properly cited.
This article is published in open access under the Subscribe to Open model. This email address is being protected from spambots. You need JavaScript enabled to view it. to support open access publication.
1. Introduction
A so-called changing-look active galactic nucleus (CLAGN) is a special type of AGNs that exhibits a significant change in their optical spectral appearance. CLAGNs experience transitions from a type I AGN with both broad (e.g., full width at half maximum, FWHM ≳ 1000 km/s) and narrow emission lines to a type II AGN with only narrow lines (FWHM ≲ 500 km/s), or vice versa (e.g., Ricci & Trakhtenbrot 2023). The classification of intermediate types 1.5, 1.8, and 1.9 are also defined based on the relative strength of the broad Hβ lines to the narrow [O III] lines (Osterbrock & Koski 1976; Osterbrock 1981; Winkler 1992). Increasingly more optical CLAGNs are found based on various methods (e.g., MacLeod et al. 2019; Sheng et al. 2020; Potts & Villforth 2021; Senarath et al. 2021; Jin et al. 2022; Yang et al. 2023; Guo et al. 2024). The main plausible mechanism for CLAGNs is related to (1) the variation in the intrinsic accretion rate (e.g. Sheng et al. 2017; Noda & Done 2018; Guolo et al. 2021; Liu et al. 2022; Yang et al. 2023), (2) obscuration effects (e.g., Risaliti et al. 2009; Ricci et al. 2016), and (3) tidal disruption events (TDEs, e.g., Trakhtenbrot et al. 2019). The obscuration scenario is disfavored for most sources with low absorption, low polarization degrees, and significant multiwavelength variability. TDE can only be applied to limited cases, and it is hard to explain the repeating changing-look phenomena. CLAGNs that show repeating appearance/disappearance of broad emission lines are much rarer (e.g., 3C 390.3, Marin et al. 2019; B3 0749+460A,Wang et al. 2022; Fairall 9, Marin et al. 2019; Mrk 1018, McElroy et al. 2016; Mrk 590, Denney et al. 2014; NGC 1365, Braito et al. 2014; Temple et al. 2023; NGC 1566, Sniegowska et al. 2020; NGC 4151, Puccetti et al. 2007; Marin et al. 2019; NGC 5548, Sniegowska et al. 2020; NGC 7582, Bianchi et al. 2009; Marin et al. 2019; NGC 7603, Marin et al. 2019; SDSS J151652.48+295413.4, Wang et al. 2023; UGC 3223, Wang et al. 2020 etc.). It is still uncertain whether every CLAGN experiences repeating changing-look events, and the physical mechanisms that cause these events are unclear as well. In addition, the short changing-look timescale (e.g., several years or shorter) is still unclear (e.g., Noda & Done 2018; Stern et al. 2018; Ross et al. 2018; Dexter & Begelman 2019; Feng et al. 2021; Śniegowska et al. 2022). The transition between a standard Shakura-Sunyaev thin disk (SSD; Shakura & Sunyaev 1973) and advection-dominated accretion flow (ADAF; e.g., Ho 2008; Yuan & Narayan 2014) caused by the radiation pressure instability in a narrow unstable zone might explain the multiple changing-look phenomena (Sniegowska et al. 2020). The large-scale magnetic fields can reduce the timescale for repeating CLAGNs that are driven by the wind, which can effectively remove the angular momentum and energy of the disk (Pan et al. 2021). In addition, the repeating changing-look phenomena might also be explained by the recoiled supermassive black hole (rSMBH) scenario (e.g., Kim et al. 2018) or throuhg close supermassive black hole binaries (CB-SMBHs; e.g., Wang & Bon 2020). The discovery of more repeating CLAGNs with high-cadence photometric and multi-epoch spectroscopic observations may help to solve this issue.
The source SDSS J101152.98+544206.4 (J1011+5442, hereafter) at z = 0.246 was initially identified as a type I AGN with broad Balmer emission lines in 2003. The broad Hβ emission lines subsequently disappeared before 2015 (Runnoe et al. 2016). Additionally, it exhibits a gradual decrease in its continuum luminosity. The polarization degree of J1011+5442 is low (0.15%; Hutsemékers et al. 2017, 2019). Inspired by its rebrightening since 2018 in optical and mid-infrared light curves from the Zwicky Transient Facility (ZTF; e.g., Bellm et al. 2019) and the Wide-field Infrared Survey Explorer (WISE; Wright et al. 2010), we performed follow-up spectroscopic observations with the Xinglong 2.16 m (XLT for short), the Lijiang 2.4 m (LJT for short), and the Multiple mirror telescope (MMT for short) 6.5 m optical telescopes. J1011+5442 almost returned to the type I state as the broad Hβ emission line reappeared. The new data confirm that J1011+5442 is a new repeating CLAGN with gradually brightened broad emission lines and continuum after 5 years in the faint state. Throughout this work, we adopt a flat ΛCDM cosmological model with H0 = 70 km s−1 Mpc−1, Ωm = 0.27, and ΩΛ = 0.73, which corresponds to a luminosity distance of DL = 1.244 Gpc.
2. Observations and data analysis
2.1. Photometry
Between 2006 January and 2013 May, J1011+5442 was observed by the Catalina Sky Survey (CSS; Drake et al. 2009). The ZTF has been monitoring J1011+5442 in the g, r, and i bands since 2018. We found that it gradually brightened since 2018 and peaked at around 2021, then experienced strong short-term variability in the optical light curves. We also checked the mid-infrared light curve from WISE, which imaged the full sky approximately every six months in four mid-infrared bands (referred to as W1, W2, W3, and W4, respectively, Wright et al. 2010) from 2010 January to September. Since the cryogen for cooling the W3 and W4 instruments was exhausted, it was reactivated on 2013 October 3 (called NEOWISE) with the W1 and W2 bands alone (Mainzer et al. 2014). We retrieved the data of AllWISE multi-epoch photometry table and NEOWISE single-exposure (L1b) source table from the NASA/IPAC Infrared Science Archive1. We present the light curves in the optical and mid-infrared bands in Figure 1. To investigate the variability in the magnitude and color in the optical and mid-infrared, we calculated the variability in the magnitude at the ZTF zg band (Δg) and the WISE W1 band (ΔW1) and the variability in the color (Δ(g − r) and Δ(W1 − W2)) compared to the first-epoch data. The color variability versus magnitude variability correlation is presented in Figure 2.
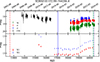 |
Fig. 1. Optical and mid-infrared light curves of J1011+5442. The dot-dashed red, green, cyan, and purple lines represent the spectroscopic observational time by SDSS, the Xinglong 2.16 m, the Lijiang 2.4 m telescope, and the MMT 6.5 m telescope. The straight blue line represents the spectroscopic observational time in the faint state by SDSS. The dotted black line represents the observational time by Chandra. The mid-infrared light curve is rebinned within half a year. |
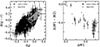 |
Fig. 2. Color variability vs. magnitude variability of J1011+5442 in the optical (left panel) and mid-infrared (right panel) band. We include the data of Mrk 1018 for comparison. A bluer-when-brighter feature in the optical and a redder-when-brighter feature in the mid-infrared are confirmed and consistent with other CLAGNs (e.g., Yang et al. 2018). |
2.2. Spectroscopy
We observed J1011+5442 with the Xinglong 2.16 m telescope (XLT, hereafter; Fan et al. 2016; Fu et al. 2022) on 2024 January 11 with a total exposure time of 4700 s, the Lijiang 2.4 m telescope (LJT, hereafter; Wang et al. 2019) on 2024 February 4 and 7 with the same exposure time of 3200 s, and the MMT Observatory 6.5 meter telescope (MMT, hereafter) on 2024 April 5 with a total exposure time of 3000 s. XLT is an equatorial mount reflector telescope at Xinglong Observatory and part of the National Astronomical Observatories of the Chinese Academy of Sciences (NAOC). The G4 grism and the slit with a width of  were used, so that the wavelength coverage was 4000–8800 Å and the spectral resolution of R = λ/Δλ was 265 at 5007 Å (Fan et al. 2016). LJT is an altitude-azimuth mount reflector telescope at Lijiang Observatory and part of the Yunnan Observatories (YNAO) of the Chinese Academy of Sciences (CAS). The G3 grism and the slit with a width of
  were used, so that the wavelength coverage was 3400–9100 Å and the spectral resolution of R = λ/Δλ was 250 at 6030 Å. Binospec is a multislit imaging spectrograph that was commissioned at the MMT in 2017. The instrument we used is BINOSPEC_270 and has a wavelength coverage of 3900–9240 Å and a spectral resolution of 1340 at 6500 Å2. J1011+5442 was observed under mostly good sky conditions by XLT, LJT, and MMT. The sky condition was slightly worse on February 4 than on February 7 for LJT. The observations by MMT were split into five 600-second exposures, one of which was made with a slightly worse seeing.
The spectra from XLT and LJT were reduced with the pipeline (PYFOSC; Fu 2020), which is based on PyRAF for long-slit spectroscopy. The spectra from MMT were reduced with the standard pipeline (PYPEIT3; Prochaska et al. 2020).
J1011+5442 shows type I AGN spectral features with significant broad Hα and Hβ emission lines based on the new spectroscopic observations. The dim-state spectra from SDSS could help us to model the stellar continuum by fitting an E-MILES SPS model (Vazdekis et al. 2016) with PPXF (Cappellari & Emsellem 2004). The stellar velocity dispersion we estimate is 123 ± 5 km s−1. Based on the MBH − σ* relation from Tremaine et al. (2002), we calculated the black hole mass as log(MBH, σ*/M⊙) = 7.28 ± 0.15.
To increase the signal-to-noise ratio (S/N) of the spectra, we combined the three spectra from XLT and LJT with the tool specutils4. The spectral flux by LJT was scaled to that of XLT due to their close observational time interval within one month, which is much shorter than the typical changing-look timescale. The absolute flux calibrations of the spectra were made using the nearest ZTF r-band magnitude with the package pyphot5. r = 18.56 ± 0.05 at MJD 60322 and r = 18.45 ± 0.05 at MJD 60354 were adopted to scale the spectra of XLT/LJT and MMT, respectively. The absolute flux-calibrated spectra from the new observations and the spectra from the Sloan Digital Sky Survey (SDSS) are shown in Figure 3.
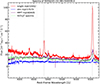 |
Fig. 3. Optical spectra of J1011+5442 in the rest frame. The bright and dim state spectra in red and blue are from the SDSS. For the XLT/LJT and MMT spectra in light green and purple, the absolute flux is scaled with the ZTF magnitude. |
2.3. Spectral decomposition
We further fit the spectra with a wrapper package (QSOFITMORE; Fu 2021), which is based on the multicomponent spectral fitting code pyQSOFit (Guo et al. 2018). The spectra were corrected for Galactic extinction with the dust map of Schlegel et al. (1998) and the extinction law from Wang & Chen (2019). The dereddened spectra were then shifted to the rest frame with a redshift of z = 0.246.
First, we decomposed the host galaxy component from the dim-state spectrum from the SDSS over the wavelength range of 3800–7000 Å. We fit the spectrum with a host component, a power-law continuum, the optical (Boroson & Green 1992) and UV (Vestergaard & Wilkes 2001) Fe II template, and line components. The broad lines and Fe II emissions are weak in this spectrum (see also Runnoe et al. 2016). The broad component of Hα was modeled by one Gaussian profile. The stellar lines contaminate the broad components of the Hβ lines (Runnoe et al. 2016).
Then, we fit the bright-state spectrum from SDSS and the new spectra from XLT/LJT and MMT over the same wavelength range. The broad component of Hα and Hβ was modeled by two Gaussian profiles. The host galaxy decomposition was not applied for these spectra because the negative host galaxy flux is higher than 100 pixels. We therefore subtracted the host component estimated from the dim-state spectra. For the spectrum from MMT, we masked the data in the wavelength range of 6067–6131 Å because of the poor data quality. For all the spectra, we fit the spectra with all the components as used in the dim-state spectrum. The narrow components of Hα, [N II]λλ6548,6584, [S II]λλ6716,6731, and Hβ were each modeled by a single Gaussian profile. The line widths and velocity offsets of the narrow lines were tied to each other. The relative flux ratio of the [N II]λλ6548,6584 doublet was fixed to 2.96:1. The relative flux ratio of the [O III]λλ,4959,5007 double lines was fixed to 1:3. The uncertainties were determined via a Monte Carlo simulation of the fitting procedure. We present the fitting result of the new spectra from XLT/LJT and MMT in Figure A.1 and Figure A.2. The properties of J1011+5442 from emission-line measurements are listed in Table 1.
Properties of J1011+5442 estimated from different spectra.
2.4. Chandra observation
There are two archival Chandra observations (ObsID 19518 and 22525 with exposure times of 11 ks and 30 ks, respectively) of J1011+5442. Since the X-ray intensity is still weak, we only extracted the ACIS-S spectrum of ObsID 22525 (observed on 2020 September 18) with the latest CIAO (v4.16) and CALDB (v4.11.0). The source and background spectra were extracted from a circle with a radius of 3″ and an annulus with an inner radius of 5″ and an outer radius of 10″, respectively. The net photon count rate of the spectrum was only 2.6 × 10⁻³ ± 3.3 × 10⁻⁴ photons per second. We therefore estimated the X-ray flux with the command modelflux by assuming an X-ray photon spectral index of 2 and taking the Galactic column density of hydrogen6 to be 8.27 × 1019 cm−2. The lower limit of the 0.5–8 keV unabsorbed X-ray flux is 3.71 × 10⁻¹⁴ erg cm−2 s−1, which corresponds to L0.5 − 8 keV = 6.87 × 1042 erg s−1.
3. Discussion
Active galactic nuclei that show repeating changing look are still rare (see also Table B.1). We report that J1011+5442 is another repeating CLAGN after around 5 years (between 2014 and 2019) in the dim state. It returned to the type I state in 2024. The multi-epoch spectroscopic observations show significant broad Hβ lines in 2003 and 2024 and undetectable broad Hβ lines in 2015, while the broad Hα lines are always apparent. J1011+5442 is in an intermediate state between the dim state in 2015 and the bright state in 2003 based on the absolute flux-calibrated spectra (see Figure 3). The disappearance and reappearance of the broad Hβ lines is consistent with the dimming and rebrightening of the optical continuum and mid-infrared emission. The variability in color versus magnitude shows the bluer-when-brighter and redder-when-bright features in the optical and mid-infrared band, which is consistent with other CLAGNs and is not caused by the variable obscuration (e.g., Yang et al. 2018). The mid-infrared (MIR) color (W1-W2) changes from 1.2 in the bright state to 0.5 − 0.75 in the dim state and gradually increases as it turns on. The opposite color-change trend in the MIR band is mainly caused by the activity from the central engine of AGN (e.g., accretion rate change). Mid-IR emission is thought to mainly come from the hot dust heated by the central engine of AGNs, which lags the optical emission from the disk in the dust reverberation mapping scenario (Hickox & Alexander 2018). We estimated the time lag of the mid-infrared variability to the optical band using the interpolation cross-correlation function (ICCF; Peterson et al. 1998; Sun et al. 2018). An interpolation time step of one day was applied to the optical and mid-infrared light curves, which were rebinned into 10 days and 180 days, respectively. The flux randomization and random subset selection methods were employed with 40 000 realizations in the Monte Carlo simulation to estimate the centroid time lag and the uncertainties7. The centroid time lags for the WISE W1 band variability to the ZTF g and r bands are  and
and  days. According to the time lag and bolometric luminosity (τ-L) correlation of the dust reverberation mapping from the luminous QSOs (Lyu et al. 2019), the predicted time lags are around 165 and 62 days based on the bright- and dim-state bolometric luminosity (Runnoe et al. 2016). The spectroscopic observations and the optical and mid-infrared photometric light curves further support the hypothesis that the repeating changing-look phenomena are driven by the abrupt change in the intrinsic accretion rate and not by the TDE or obscuration effects (e.g., Runnoe et al. 2016; Sheng et al. 2017; Noda & Done 2018).
There are extreme variations in the broad emission lines (especially for the Hβ lines) from the broad line region (BLR) for CLAGNs. The blue part of the spectrum from MMT is quite similar to that in the dim state from the SDSS, except for the very broad Hβ emission lines in the MMT spectrum. The BLR might not be in equilibrium or the virial factor could change (e.g., McElroy et al. 2016; Krumpe et al. 2017). The black hole mass (log MBH, σ* = 7.28 ± 0.15) estimated based on the MBH − σ* relation might be a better choice (e.g., Jin et al. 2022), which is an intermediate value of the virial black hole mass estimated for J1011+5442 (i.e., MBH, bright, Hβ = (3.6 ± 0.2)×107 M⊙, MBH, bright, Hα = (4.7 ± 0.1)×107 M⊙, and MBH, dim, Hα = (1.8 ± 0.3)×107 M⊙ based on the broad Hβ and Hα emission lines in the bright state and Hα in the dim state, respectively; see Runnoe et al. 2016). The MBH, σ* is closer to the MBH, dim, Hα in the dim state, but also consistent with the value in the bright state within the error bars. We adopted the MBH, σ* estimated above to estimate the Eddington ratio in different states. The Eddington ratio Lbol/LEDD = 0.28 was estimated for bright state with Lbol = 6.8 × 1044 erg s−1 (Runnoe et al. 2016). When we assume a bolometric correction factor of 10 (e.g., Vasudevan et al. 2009), the estimated Eddington ratio from the X-ray observation for J1011+5442 is Lbol/LEDD ≳ 2.8%. This is similar to but slightly lower than that (Lbol/LEDD = 3.5%) of the dim state with Lbol = 8.4 × 1043 erg s−1 (Runnoe et al. 2016), which suggests that J1011+5442 is still in the dim state at the epoch (2020) of the X-ray observation. The host-subtracted bolometric luminosity estimated from the MMT spectrum (2024) is Lbol = 5.2 × 1044 erg s−1. The corresponding Eddington ratio of Lbol/LEDD is 0.21, which indicates that J1011+5442 is in the intermediate state between the dim (2015–2020) and bright state (2003–2010). The Eddington ratio (2.8–28%) is close to the critical value at which the state transition between ADAF and SSD would occur (e.g., Noda & Done 2018; Guolo et al. 2021). The accretion mode transition could explain the significant change in the broad Hβ lines.
The changing-look timescale for the disappearance and reappearance of broad Hβ lines in J1011+5442 is around 5 years (see Figure 1). The well-known CLAGN Mrk 1018 also experienced a changing look multiple times (e.g., McElroy et al. 2016; Krumpe et al. 2017; Lyu et al. 2021; Brogan et al. 2023), which is somewhat similar to the behavior of J1011+5442 (e.g., the changing-look timescale and the variability in the mid-infrared emission). The mechanism that drives the variation in the accretion rate on this short timescale with multiple changing-look events in individual sources is still debated. For a recoiling supermassive black hole, the sound crossing time (τs) of the density perturbation in the accretion disk caused by a tidal impulse is given by (Liu et al. 2008; Kim et al. 2018)
 (1)
(1)
where the effective temperature of the accretion disk T is determined by
 (2)
(2)
for a rotating Kerr black hole. We obtain that the τs is around 1.0 ∼ 1.4 years adopting a typical accretion disk radius Rd ∼ 100 Rg (e.g., Noda & Done 2018), log(MBH, σ*/M⊙) = 7.28, and the bolometric Eddington ratio 0.028 ∼ 0.28. The sound crossing timescale is much shorter than the observed changing-look timescale of 5 years, which does not support a recoiling supermassive black hole in J1011+5442. In the rSMBH scenario, Kim et al. (2018) predicted that Mrk 1018 would return to type I in the mid-2020 s. It experienced an outburst in the optical and mid-infrared bands in 2021 (e.g., Brogan et al. 2023). However, this scenario is not supported by the new spectropolarimetry observation with low continuum polarization signatures for Mrk 1018 (e.g., Hutsemékers et al. 2020). A low polarization degree is also reported for J1011+5442 (Hutsemékers et al. 2017, 2019), which further rules out the rSMBH explanation for the repeating changing-look phenomena in J1011+5442 (e.g., Hutsemékers et al. 2020).
In the scenario of close binaries of supermassive black holes, the tidal interaction between mini-disks and CB-SMBHs with low mass ratios and high eccentricities could lead to the turn-on and turn-off due to the accumulation/exhaustion of peeled gas after the periastron phase (e.g., Wang & Bon 2020). The asymmetric or double-peaked profiles in the broad emission lines (see Figure 4) might support this scenario. The discovery of more repeating CLAGNs can also provide us with candidate SMBHBs.
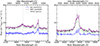 |
Fig. 4. ZTF magnitude-scaled spectra from new observations focused on the Hβ and Hα emission lines. The dim-state spectrum is also shown for comparison. Broad Hβ lines are apparent in the new spectra. |
4. Conclusion
We reported that J1011+5442 is another repeating CLAGN based on new spectroscopic observations by XLT, LJT, and MMT in 2024. The broad Hβ lines in J1011+5442 disappeared and reappeared within around 20 years. J1011+5442 gradually returns to the type I state, which is located in between the bright state in 2003 and the dim state in 2015. The rapid variations in the broad Balmer lines are accompanied by the increase in the optical continuum and in the mid-infrared emission since 2019. The rebrightening of its optical and mid-infrared emission supports the hypothesis that the changing-look phenomenon is driven by the abrupt change in the accretion rate because the time lag of the mid-infrared emission variability relative to the optical band is consistent with the prediction of dust reverberation mapping. Multiple times of changing-look events within a short timescale are still rare and confusing. We encourage more optical spectroscopic and X-ray observations to investigate the repeating changing-look behavior for J1011+5442 and to determine whether the broad Hβ line again disappears in the next several years.
The code pyCCF is available in http://ascl.net/code/v/1868
Acknowledgments
We thank the anonymous referee for useful comments that effectively improved the manuscript. We are thankful for the support of the National Science Foundation of China (11721303, 11927804, and 12133001) and the National Key R & D Program of China (2022YFF0503401). We acknowledge the science research grant from the China Manned Space Project with No. CMS-CSST-2021-A06. We acknowledge the support of the staff of the Xinglong 2.16 m telescope. This work was partially supported by the Open Project Program of the Key Laboratory of Optical Astronomy, National Astronomical Observatories, Chinese Academy of Sciences. Guoshoujing Telescope (the Large Sky Area Multi-Object Fiber Spectroscopic Telescope LAMOST) is a National Major Scientific Project built by the Chinese Academy of Sciences. Funding for the project has been provided by the National Development and Reform Commission. LAMOST is operated and managed by the National Astronomical Observatories, Chinese Academy of Sciences. We acknowledge the support of the Cultivation Project for LAMOST Scientific Payoff and Research Achievement. We acknowledge the support of the staff of the Xinglong 2.16 m telescope and the Lijiang 2.4 m telescope, which was partially supported by the Open Project Program of the Key Laboratory of Optical Astronomy, National Astronomical Observatories, Chinese Academy of Sciences and funded by the Chinese Academy of Sciences and the People’s Government of Yunnan Province, respectively. Observations reported here were obtained at the MMT Observatory, a joint facility of the University of Arizona and the Smithsonian Institution. Based on observations collected at the Samuel Oschin Telescope 48-inch and the 60-inch Telescope at the Palomar Observatory as part of the Zwicky Transient Facility project. The ZTF forced-photometry service was funded under the Heising-Simons Foundation grant 12540303 (PI: Graham). This publication makes use of data products from the Wide-field Infrared Survey Explorer and NEOWISE, which is funded by the National Aeronautics and Space Administration. This research has made use of data products from the Sloan Digital Sky Survey (SDSS, www.sdss.org), and NASA/IPAC EXTRAGALACTIC DATABASE (NED, https://ned.ipac.caltech.edu/).
References
- Bellm, E. C., Kulkarni, S. R., Graham, M. J., et al. 2019, PASP, 131, 018002 [Google Scholar]
- Bianchi, S., Piconcelli, E., Chiaberge, M., et al. 2009, ApJ, 695, 781 [Google Scholar]
- Bon, E., Zucker, S., Netzer, H., et al. 2016, ApJS, 225, 29 [NASA ADS] [CrossRef] [Google Scholar]
- Boroson, T. A., & Green, R. F. 1992, ApJS, 80, 109 [Google Scholar]
- Braito, V., Reeves, J. N., Gofford, J., et al. 2014, ApJ, 795, 87 [NASA ADS] [CrossRef] [Google Scholar]
- Brogan, R., Krumpe, M., Homan, D., et al. 2023, A&A, 677, A116 [NASA ADS] [CrossRef] [EDP Sciences] [Google Scholar]
- Cappellari, M., & Emsellem, E. 2004, PASP, 116, 138 [Google Scholar]
- Denney, K. D., De Rosa, G., Croxall, K., et al. 2014, ApJ, 796, 134 [Google Scholar]
- Dexter, J., & Begelman, M. C. 2019, MNRAS, 483, L17 [NASA ADS] [CrossRef] [Google Scholar]
- Drake, A. J., Djorgovski, S. G., Mahabal, A., et al. 2009, ApJ, 696, 870 [Google Scholar]
- Fan, Z., Wang, H., Jiang, X., et al. 2016, PASP, 128, 115005 [NASA ADS] [CrossRef] [Google Scholar]
- Feng, J., Cao, X., Li, J.-W., & Gu, W.-M. 2021, ApJ, 916, 61 [NASA ADS] [CrossRef] [Google Scholar]
- Fu, Y. 2020, https://doi.org/10.5281/zenodo.3915021 [Google Scholar]
- Fu, Y. 2021, https://doi.org/10.5281/zenodo.5810042 [Google Scholar]
- Fu, Y., Wu, X.-B., Jiang, L., et al. 2022, ApJS, 261, 32 [NASA ADS] [CrossRef] [Google Scholar]
- Greene, J. E., Peng, C. Y., & Ludwig, R. R. 2010, ApJ, 709, 937 [Google Scholar]
- Guo, H., Shen, Y., & Wang, S. 2018, Astrophysics Source Code Library [record ascl:1809.008] [Google Scholar]
- Guo, W.-J., Zou, H., Fawcett, V. A., et al. 2024, ApJS, 270, 26 [NASA ADS] [CrossRef] [Google Scholar]
- Guolo, M., Ruschel-Dutra, D., Grupe, D., et al. 2021, MNRAS, 508, 144 [NASA ADS] [CrossRef] [Google Scholar]
- Hickox, R. C., & Alexander, D. M. 2018, ARA&A, 56, 625 [Google Scholar]
- Ho, L. C. 2008, ARA&A, 46, 475 [Google Scholar]
- Hon, W. J., Wolf, C., Onken, C. A., Webster, R., & Auchettl, K. 2022, MNRAS, 511, 54 [NASA ADS] [CrossRef] [Google Scholar]
- Hutsemékers, D., Agís González, B., Sluse, D., Ramos Almeida, C., & Acosta Pulido, J. A. 2017, A&A, 604, L3 [NASA ADS] [CrossRef] [EDP Sciences] [Google Scholar]
- Hutsemékers, D., Agís González, B., Marin, F., et al. 2019, A&A, 625, A54 [NASA ADS] [CrossRef] [EDP Sciences] [Google Scholar]
- Hutsemékers, D., Agís González, B., Marin, F., & Sluse, D. 2020, A&A, 644, L5 [NASA ADS] [CrossRef] [EDP Sciences] [Google Scholar]
- Jin, J.-J., Wu, X.-B., & Feng, X.-T. 2022, ApJ, 926, 184 [NASA ADS] [CrossRef] [Google Scholar]
- Kim, D. C., Yoon, I., & Evans, A. S. 2018, ApJ, 861, 51 [NASA ADS] [CrossRef] [Google Scholar]
- Krumpe, M., Husemann, B., Tremblay, G. R., et al. 2017, A&A, 607, L9 [NASA ADS] [CrossRef] [EDP Sciences] [Google Scholar]
- Liu, H. T., Bai, J. M., Zhao, X. H., & Ma, L. 2008, ApJ, 677, 884 [NASA ADS] [CrossRef] [Google Scholar]
- Liu, H., Wu, Q., & Lyu, B. 2022, ApJ, 930, 46 [NASA ADS] [CrossRef] [Google Scholar]
- Lyu, J., Rieke, G. H., & Smith, P. S. 2019, ApJ, 886, 33 [NASA ADS] [CrossRef] [Google Scholar]
- Lyu, B., Yan, Z., Yu, W., & Wu, Q. 2021, MNRAS, 506, 4188 [NASA ADS] [CrossRef] [Google Scholar]
- MacLeod, C. L., Green, P. J., Anderson, S. F., et al. 2019, ApJ, 874, 8 [Google Scholar]
- Mainzer, A., Bauer, J., Cutri, R. M., et al. 2014, ApJ, 792, 30 [Google Scholar]
- Marin, F., Hutsemékers, D., & Agís González, B., 2019, in SF2A-2019: Proceedings of the Annual Meeting of the French Society of Astronomy and Astrophysics, eds. P. Di Matteo, O. Creevey, A. Crida, et al., 509 [Google Scholar]
- McElroy, R. E., Husemann, B., Croom, S. M., et al. 2016, A&A, 593, L8 [NASA ADS] [CrossRef] [EDP Sciences] [Google Scholar]
- Noda, H., & Done, C. 2018, MNRAS, 480, 3898 [Google Scholar]
- Oknyansky, V. L., Winkler, H., Tsygankov, S. S., et al. 2020, MNRAS, 498, 718 [NASA ADS] [CrossRef] [Google Scholar]
- Osterbrock, D. E. 1981, ApJ, 249, 462 [Google Scholar]
- Osterbrock, D. E., & Koski, A. T. 1976, MNRAS, 176, 61P [NASA ADS] [CrossRef] [Google Scholar]
- Pan, X., Li, S.-L., & Cao, X. 2021, ApJ, 910, 97 [NASA ADS] [CrossRef] [Google Scholar]
- Parker, M. L., Schartel, N., Grupe, D., et al. 2019, MNRAS, 483, L88 [NASA ADS] [CrossRef] [Google Scholar]
- Peterson, B. M., Wanders, I., Horne, K., et al. 1998, PASP, 110, 660 [Google Scholar]
- Potts, B., & Villforth, C. 2021, A&A, 650, A33 [NASA ADS] [CrossRef] [EDP Sciences] [Google Scholar]
- Prochaska, J. X., Hennawi, J. F., Westfall, K. B., et al. 2020, J. Open Source Software, 5, 2308 [NASA ADS] [CrossRef] [Google Scholar]
- Puccetti, S., Fiore, F., Risaliti, G., et al. 2007, MNRAS, 377, 607 [Google Scholar]
- Ricci, C., & Trakhtenbrot, B. 2023, Nat. Astron., 7, 1282 [Google Scholar]
- Ricci, C., Bauer, F. E., Arevalo, P., et al. 2016, ApJ, 820, 5 [NASA ADS] [CrossRef] [Google Scholar]
- Ricci, T. V., Steiner, J. E., May, D., Garcia-Rissmann, A., & Menezes, R. B. 2018, MNRAS, 473, 5334 [NASA ADS] [CrossRef] [Google Scholar]
- Risaliti, G., Salvati, M., Elvis, M., et al. 2009, MNRAS, 393, L1 [NASA ADS] [CrossRef] [Google Scholar]
- Ross, N. P., Ford, K. E. S., Graham, M., et al. 2018, MNRAS, 480, 4468 [Google Scholar]
- Runnoe, J. C., Cales, S., Ruan, J. J., et al. 2016, MNRAS, 455, 1691 [Google Scholar]
- Schlegel, D. J., Finkbeiner, D. P., & Davis, M. 1998, ApJ, 500, 525 [Google Scholar]
- Senarath, M. R., Brown, M. J. I., Cluver, M. E., et al. 2021, MNRAS, 503, 2583 [NASA ADS] [CrossRef] [Google Scholar]
- Shakura, N. I., & Sunyaev, R. A. 1973, A&A, 24, 337 [NASA ADS] [Google Scholar]
- Sheng, Z., Wang, T., Jiang, N., et al. 2017, ApJ, 846, L7 [NASA ADS] [CrossRef] [Google Scholar]
- Sheng, Z., Wang, T., Jiang, N., et al. 2020, ApJ, 889, 46 [NASA ADS] [CrossRef] [Google Scholar]
- Sniegowska, M., Czerny, B., Bon, E., & Bon, N. 2020, A&A, 641, A167 [NASA ADS] [CrossRef] [EDP Sciences] [Google Scholar]
- Śniegowska, M., Grzedzielski, M., Czerny, B., & Janiuk, A. 2022, Astron. Nachr., 343, e210065 [Google Scholar]
- Stern, D., McKernan, B., Graham, M. J., et al. 2018, ApJ, 864, 27 [Google Scholar]
- Sun, M., Grier, C. J., & Peterson, B. M. 2018, AstrophysicsSource Code Library [record ascl:1805.032] [Google Scholar]
- Temple, M. J., Ricci, C., Koss, M. J., et al. 2023, MNRAS, 518, 2938 [Google Scholar]
- Trakhtenbrot, B., Arcavi, I., MacLeod, C. L., et al. 2019, ApJ, 883, 94 [Google Scholar]
- Tremaine, S., Gebhardt, K., Bender, R., et al. 2002, ApJ, 574, 740 [NASA ADS] [CrossRef] [Google Scholar]
- Vasudevan, R. V., Mushotzky, R. F., Winter, L. M., & Fabian, A. C. 2009, MNRAS, 399, 1553 [NASA ADS] [CrossRef] [Google Scholar]
- Vazdekis, A., Koleva, M., Ricciardelli, E., Röck, B., & Falcón-Barroso, J. 2016, MNRAS, 463, 3409 [Google Scholar]
- Vestergaard, M., & Peterson, B. M. 2006, ApJ, 641, 689 [Google Scholar]
- Vestergaard, M., & Wilkes, B. J. 2001, ApJS, 134, 1 [Google Scholar]
- Wang, J.-M., & Bon, E. 2020, A&A, 643, L9 [NASA ADS] [CrossRef] [EDP Sciences] [Google Scholar]
- Wang, S., & Chen, X. 2019, ApJ, 877, 116 [Google Scholar]
- Wang, C.-J., Bai, J.-M., Fan, Y.-F., et al. 2019, Res. Astron. Astrophys., 19, 149 [CrossRef] [Google Scholar]
- Wang, J., Xu, D. W., & Wei, J. Y. 2020, ApJ, 901, 1 [Google Scholar]
- Wang, J., Zheng, W. K., Xu, D. W., et al. 2022, Res. Astron. Astrophys., 22, 015011 [CrossRef] [Google Scholar]
- Wang, J., Zheng, W. K., Brink, T. G., et al. 2023, ApJ, 956, 137 [NASA ADS] [CrossRef] [Google Scholar]
- Wang, J., Xu, D. W., Cao, X., et al. 2024, ApJ, 970, 85 [NASA ADS] [CrossRef] [Google Scholar]
- Winkler, H. 1992, MNRAS, 257, 677 [NASA ADS] [Google Scholar]
- Wright, E. L., Eisenhardt, P. R. M., Mainzer, A. K., et al. 2010, AJ, 140, 1868 [Google Scholar]
- Yang, Q., Wu, X.-B., Fan, X., et al. 2018, ApJ, 862, 109 [Google Scholar]
- Yang, Q., Green, P. J., MacLeod, C. L., et al. 2023, ApJ, 953, 61 [NASA ADS] [CrossRef] [Google Scholar]
- Yuan, F., & Narayan, R. 2014, ARA&A, 52, 529 [NASA ADS] [CrossRef] [Google Scholar]
- Zeltyn, G., Trakhtenbrot, B., Eracleous, M., et al. 2022, ApJ, 939, L16 [NASA ADS] [CrossRef] [Google Scholar]
- Zeltyn, G., Trakhtenbrot, B., Eracleous, M., et al. 2024, ApJ, 966, 85 [NASA ADS] [CrossRef] [Google Scholar]
Appendix A: Fitting
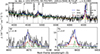 |
Fig. A.1. Spectral fitting result for the combined spectrum of J1011+5442 from XLT and LJT. |
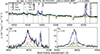 |
Fig. A.2. Spectral fitting result for the spectrum of J1011+5442 from MMT. |
Appendix B: RCLAGNs
Repeating CLAGNs collected from the literature. The table lists the source name, redshift, BH mass, types, and references.
All Tables
Repeating CLAGNs collected from the literature. The table lists the source name, redshift, BH mass, types, and references.
All Figures
|
Fig. 1. Optical and mid-infrared light curves of J1011+5442. The dot-dashed red, green, cyan, and purple lines represent the spectroscopic observational time by SDSS, the Xinglong 2.16 m, the Lijiang 2.4 m telescope, and the MMT 6.5 m telescope. The straight blue line represents the spectroscopic observational time in the faint state by SDSS. The dotted black line represents the observational time by Chandra. The mid-infrared light curve is rebinned within half a year. |
| In the text | |
|
Fig. 2. Color variability vs. magnitude variability of J1011+5442 in the optical (left panel) and mid-infrared (right panel) band. We include the data of Mrk 1018 for comparison. A bluer-when-brighter feature in the optical and a redder-when-brighter feature in the mid-infrared are confirmed and consistent with other CLAGNs (e.g., Yang et al. 2018). |
| In the text | |
|
Fig. 3. Optical spectra of J1011+5442 in the rest frame. The bright and dim state spectra in red and blue are from the SDSS. For the XLT/LJT and MMT spectra in light green and purple, the absolute flux is scaled with the ZTF magnitude. |
| In the text | |
|
Fig. 4. ZTF magnitude-scaled spectra from new observations focused on the Hβ and Hα emission lines. The dim-state spectrum is also shown for comparison. Broad Hβ lines are apparent in the new spectra. |
| In the text | |
|
Fig. A.1. Spectral fitting result for the combined spectrum of J1011+5442 from XLT and LJT. |
| In the text | |
|
Fig. A.2. Spectral fitting result for the spectrum of J1011+5442 from MMT. |
| In the text | |
Current usage metrics show cumulative count of Article Views (full-text article views including HTML views, PDF and ePub downloads, according to the available data) and Abstracts Views on Vision4Press platform.
Data correspond to usage on the plateform after 2015. The current usage metrics is available 48-96 hours after online publication and is updated daily on week days.
Initial download of the metrics may take a while.