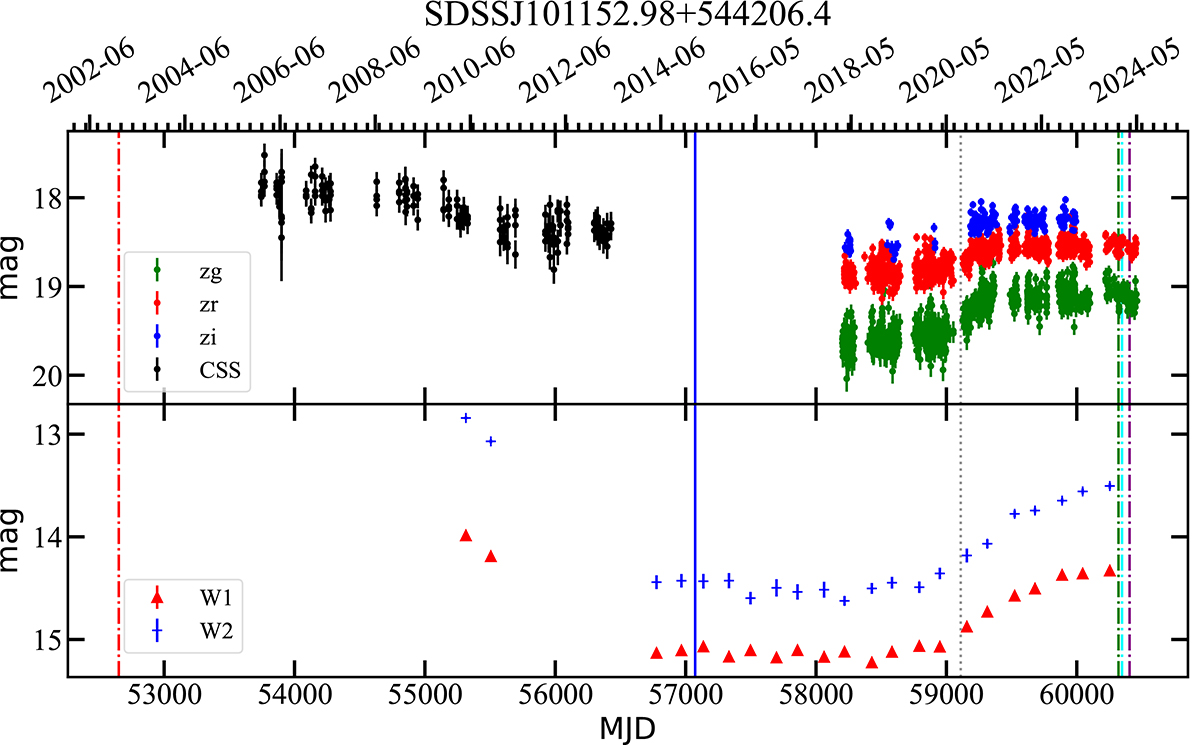
Fig. 1.
Download original image
Optical and mid-infrared light curves of J1011+5442. The dot-dashed red, green, cyan, and purple lines represent the spectroscopic observational time by SDSS, the Xinglong 2.16 m, the Lijiang 2.4 m telescope, and the MMT 6.5 m telescope. The straight blue line represents the spectroscopic observational time in the faint state by SDSS. The dotted black line represents the observational time by Chandra. The mid-infrared light curve is rebinned within half a year.
Current usage metrics show cumulative count of Article Views (full-text article views including HTML views, PDF and ePub downloads, according to the available data) and Abstracts Views on Vision4Press platform.
Data correspond to usage on the plateform after 2015. The current usage metrics is available 48-96 hours after online publication and is updated daily on week days.
Initial download of the metrics may take a while.