| Issue |
A&A
Volume 691, November 2024
|
|
|---|---|---|
| Article Number | A81 | |
| Number of page(s) | 16 | |
| Section | Celestial mechanics and astrometry | |
| DOI | https://doi.org/10.1051/0004-6361/202450967 | |
| Published online | 30 October 2024 | |
Analysis of the Gaia Data Release 3 parallax bias in the Galactic plane
1
Shanghai Astronomical Observatory, Chinese Academy of Sciences,
Shanghai
200030,
China
2
University of Chinese Academy of Sciences,
Beijing
100049,
China
★ Corresponding author; shilonցThis email address is being protected from spambots. You need JavaScript enabled to view it.
Received:
3
June
2024
Accepted:
20
September
2024
Abstract
Context. Systematic errors are inevitable in Gaia published astrometric data. A global recipe has been proposed to correct for the GEDR3 parallax zero-point offset, but this does not take the Galactic plane into consideration. The applicability of their correction model to the Galactic plane remains uncertain.
Aims. We attempt to carry out an independent investigation into the sample dependence of the proposed correction, and its applicability to the Galactic plane.
Methods. We collected various samples, including quasars, binaries, and sources with parallaxes from other surveys or methods, to validate the proposed correction, especially in the Galactic plane.
Results. We conclude that the proposed correction exhibits sample dependence, and does not apply effectively to the Galactic plane. We present a new parallax bias correction for application to the Galactic plane, offering improvements over the previous correction. The correction difference between L21 and this work can be as high as 10 µas within certain ranges of magnitude and colour. This work provides an additional recipe for users of Gaia parallaxes, especially for sources located near the Galactic plane.
Key words: astrometry / parallaxes / stars: distances
© The Authors 2024
 Open Access article, published by EDP Sciences, under the terms of the Creative Commons Attribution License (https://creativecommons.org/licenses/by/4.0), which permits unrestricted use, distribution, and reproduction in any medium, provided the original work is properly cited.
This article is published in open access under the Subscribe to Open model. This email address is being protected from spambots. You need JavaScript enabled to view it. to support open access publication.
1 Introduction
The third data release from the European Space Agency mission Gaia covers observations made between July 2014 and May 2017, during the first 34 months of the Gaia mission (Gaia Collaboration 2016; Gaia Collaboration 2023b). This release took place in two stages: the early stage, Gaia Early Data Release 3 (GEDR3), which provides updated astrometry and photometry supplemented by radial velocities from the second data release (GDR2) (Gaia Collaboration 2018), and the full Gaia Data Release 3 (GDR3), which includes the same sources as GEDR3 along with new radial velocities, spectra, light curves, astrophysical parameters, and more. The astrometric data in GDR3 are identical to those in GEDR3. In GDR3, the typical uncertainties of parallaxes range from 0.03 to 1.3 mas for stars with 15 < G < 21 mag.
As one of the most critical data sets provided by the Gaia mission, high-precision and high-accuracy parallaxes enable the derivation of reliable stellar distances. This has a significant impact on fields such as stellar formation and evolution, and the structure and dynamics of the Milky Way. However, systematic errors are inevitable in the published astrometric data because of imperfections in the instrument and data processing methods (Lindegren et al. 2021b). Several studies have investigated the parallax zero-point offset of GEDR3 using different tracers, including quasars (∼ −21 µas, Lindegren et al. 2021b; ∼ −24 µas, Liao et al. 2021), red giant stars (∼ +22 µas, Zinn 2021), red clump stars (∼ +26 µas, Huang et al. 2021), and W Ursae Majoris (EW)-type eclipsing binary systems (∼ −27 µas, Ren et al. 2021). Fabricius et al. (2021) compared the GEDR3 parallaxes with various external catalogues; with the use of external reference catalogues of open clusters (Kharchenko et al. 2013; Dias et al. 2014), they derived an average zero-point difference of −59 µas and −91 µas, respectively. Lindegren et al. (2021a, hereafter L21) proposed a recipe to correct the GEDR3 parallax zeropoint offset, which is a function of G-band magnitude, colour information, and the ecliptic latitude of the sources. The correction functions are denoted as Z5(G, veff, β) and  for five-parameter and six-parameter solutions, respectively, where Z represents the parallax zero-point offset. The colour parameters used in the L21 correction are the (photometric) effective wavenumber in Z5 and the (astrometric) pseudocolour in Z6 . The L21 correction is based on three samples: quasars in Gaia-CRF3 (hereafter GCRF3, Gaia Collaboration 2022), stars in the Large Magellanic Cloud, and binaries. Thus, the applicability of the L21 correction to other samples not considered in their model remains unknown. Additionally, the samples they considered are nearly devoid of targets in the Galactic plane due to the high source densities in this region. Consequently, the applicability of their correction model to the Galactic plane also remains uncertain because of the paucity of sources in this area.
The aim of the present study is to carry out an independent investigation into the sample dependence of the L21 correction, and its applicability to the Galactic plane. To this end, we collected various samples within the Galactic plane. Quasars provide a direct estimate of the parallax bias, including data from the Large Sky Area Multi-Object Fibre Spectroscopic Telescope Data Release 10 (LAMOST DR10; Jin et al. 2023), the Sloan Digital Sky Survey Data Release 16 (SDSS DR16; Lyke et al. 2020), the Sixth Release of the Large Quasar Astrometric Catalogue (LQAC-6; Souchay et al. 2024), the all-sky spectroscopic quasar catalogue – Quaia (Storey-Fisher et al. 2024), the quasar candidate catalogue behind the Galactic plane (GPQ, Fu et al. 2021, 2022), and the improved GDR3 quasar candidate catalogue, CatNorth, built with data from Gaia, Pan-STARRS1, and CatWISE2020 (Fu et al. 2024). In addition, wide binaries (El-Badry et al. 2021), which are so widely separated that the two components never interact, have been considered to investigate the parallax bias. Furthermore, parallaxes from other surveys and obtained with alternative methods are required to investigate the parallax offset by comparing them with the Gaia parallaxes, including (1) trigonometric parallaxes from the Hubble Space Telescope (HST) (Groenewegen 2021) and Very Long Baseline Interferometry (VLBI) astrometry (Xu et al. 2019), (2) RR Lyrae stars (RRLs) with the derived parallaxes from the recalibrated period-absolute magnitude-metallicity (PMZ) relations (Muraveva et al. 2018), (3) red clump stars (RCs) with the derived parallaxes from recalibrated absolute magnitudes based on LAMOST data (Huang et al. 2020), (4) W Ursae Majoris (EW)-type eclipsing binary systems with the derived parallaxes from the recalibrated period–luminosity relation (Ren et al. 2021), (5) red giant stars (RGs) with the asteroseismic parallaxes (Khan et al. 2023), and (6) red-giant-branch stars (RGBs) with the spectrophotometric parallaxes (Hogg et al. 2019).
The paper is structured as follows. Section 2 details the sample-selection process. In Sect. 3, we validate the L21 correction using the samples described in Sect. 2. Section 4 presents a new estimate of the parallax correction coefficients applicable to the Galactic plane. In Sect. 5, we compare and validate two parallax bias corrections. A summary concludes the paper in Sect. 6.
Statistics of the cross-matches of GDR3 to external catalogues.
2 Sample selection
To investigate the sample dependence of the L21 correction and its applicability to the Galactic plane, we require extensive and high-quality samples, including QSOs, wide binaries, and sources with parallaxes from other surveys or attained using other methods. Table 1 lists the result of cross-matches with 15 external catalogues located at |b| ⩽ 20°1 and |b| > 20° (b represents Galactic latitude), respectively, followed by further astrometric filtering.
2.1 Cross-matching
First, we cross-matched the GDR3 astrometric catalogue with the external catalogues listed in Table 1. The first seven entries in the table, namely SDSS DR16Q, LAMOST DR10, LQAC-6, Quaia, GPQ, CatNorth, and KiDS DR4, are quasar catalogues. The eighth entry is the catalogue of binaries. Entries from the ninth to the last, that is, VLBI, HST, RGs, RRLs, RCs, EWs, and RGBs, are sources with parallaxes from other surveys or methods. The astrometric information is used for the cross-matches. In cases where more than one Gaia source is matched to a source in an external catalogue, and vice versa, these sources are removed. We only consider unique matches in the case where one Gaia source is matched to one source in the external catalogue. Table 1 gives statistics of the cross-matches of GDR3 to external catalogues. Columns 3–4 list the number of unique matches located at |b| ⩽ 20° and |b| > 20° in GDR3, respectively. Further filtering was then applied, as described below.
2.1.1 Quasars
Due to the high source densities in the Galactic plane, ensuring the cleanliness of the quasar sample is challenging. Lyke et al. (2020) presented the final SDSS-IV quasar catalogue from Data Release 16, with 750 414 sources in the quasar-only subcatalogue. We cross-matched this catalogue with GDR3 using the table ‘gaiadr3.dr2_neighbourhood’ in the Gaia archive, applying matching conditions of ‘angular_distance < 100 mas’ and ‘mag- nitude_difference < 0.5 mag’. This results in 2159 and 451 336 unique matches located at |b| ⩽ 20° and |b| > 20°, respectively. Jin et al. (2023) provided the LAMOST quasar catalogue from Data Releases 1 to 10, which contains 83 376 sources. We crossmatched the LAMOST quasar catalogue with GDR3 at a radius of 2 arcsec, in which the numbers of unique matches located at |b| ⩽ 20° and |b| > 20° are 2556 and 56 847, respectively. In addition, LQAC-6 presented by Souchay et al. (2024) contains 1 149 138 sources with high quasar probability (>0.9). We cross-matched LQAC-6 with GDR3 at a radius of 1 arcsec and get 1 145 750 unique matches. Among 1 145 750 matches, 73 460 and 1 072 290 sources are located at |b| ⩽ 20° and |b| > 20°, respectively. Storey-Fisher et al. (2024) presented the all-sky quasar catalogue, Quaia, which samples the largest comoving volume of any existing spectroscopic quasar sample. These authors improved the quasar candidate catalogue identified by the Gaia mission with unWISE infrared data, applying cuts based on proper motions and colours. Their catalogue consists of 1 295 502 quasar candidates with G < 20.5, among which 153 416 and 1 142 086 sources are located at |b| ⩽ 20° and |b| > 20°, respectively.
In addition, we consider quasar catalogues achieved by machine learning. Fu et al. (2021, 2022) provided a reliable GPQ candidate catalogue with 100 153 sources located at |b| ⩽ 20° achieved through a transfer-learning method for quasar selection, with a purity of ~90% on the Simbad matches. Among them, 100 104 unique matches are considered. Fu et al. (2024) presented CatNorth, an improved GDR3 quasar candidate catalogue built with data from Gaia, Pan-STARRS1, and CatWISE2020. Their catalogue contains 1 545 514 reliable quasar candidates from the parent GDR3 quasar candidate catalogue. Among them, 193 002 and 1 352 512 sources are located at |b| ⩽ 20° and |b| > 20° , respectively. Furthermore, the quasar catalogue from the Kilo-Degree Survey (KiDS) Data Release 4 with a purity of 97%, presented by Nakoneczny et al. (2021), includes 157 813 sources with high quasar probability (p(QSOcand) > 0.9 for r < 22). We cross-match this catalogue with GDR3 at a radius of 2 arcsec, yielding 74 478 unique matches, all of which are located at |b| > 20°.
2.1.2 Wide binaries
Similar to the approach in L21, we also consider binaries in our analysis. Physical binaries offer valuable insights into determining the parallax offset, as the binary components have essentially near-identical parallaxes. The catalogue of wide binaries (WBs) of El-Badry et al. (2021) is listed in Table 1. In its raw form, it contains 1.8 million candidate physical binaries. The sample is restricted to the subset of 1 256 400 pairs with >90% probability of being bound (chance alignment <10%). Among them, 605 346 and 651 022 pairs are located at |b| ⩽ 20° and |b| > 20°, respectively, and further filtering is described below.
2.1.3 Sources with parallaxes from other surveys or methods
Initially, we consider independent trigonometric parallaxes (see Table 1). The VLBI astrometry is capable of measuring parallaxes with accuracies of ~10 µas (Reid & Honma 2014), which has an astrometric quality comparable to that of GDR3. We cross-matched 108 VLBI sources of Xu et al. (2019) with GDR3 at a radius of 100 mas, retaining 75 and 27 unique matches located at |b| ⩽ 20° and |b| > 20°, respectively. In cases where one VLBI source has multiple reference parallaxes, we retained the one with the highest precision (e.g. VY CMa, HD 283447, CoKu HP Tau G2, V1096 Tau, V1023 Tau, HD 283572, IRAS 20126+4104, HD 226868). Groenewegen (2021) compiled a list of 111 objects with the independent trigonometric parallax data from HST, considering the results determined by using the Fine Guidance Sensor (FGS) and the Wide Field Camera 3 (WFC3) from several studies (Benedict et al. 2017; van Belle et al. 2020; Bond et al. 2018; Riess et al. 2014, 2018; Casertano et al. 2016). We used the results of Groenewegen (2021), who provide GDR3 identifiers in their table. Of the 111 objects, only 1 is not listed in GDR3 (Polaris A), and 8 have no parallax listed in GDR3. Among the 102 objects left over, 46 and 56 unique matches are located at |b| ⩽ 20° and | b| > 20°, respectively.
In addition to independent trigonometric parallaxes, derived parallaxes from different methods are also considered. First, independent distance measurements are available from astero- seismology of RG stars. Khan et al. (2023) determined distances to nearly 12 500 RGs observed by Kepler, K2, and TESS. After cross-matching with GDR3 at a radius of 2 arcsec, 6821 and 7704 unique matches are located at |b| Հ 20° and |b| > 20°, respectively.
Additionally, parallaxes derived using standard candles, distance indicators, and spectrophotometry are considered as well, including RRLs (Muraveva et al. 2018), RCs (Huang et al. 2020), EWs (Ren et al. 2021), and RGBs (Hogg et al. 2019). First, RRLs are radially pulsating stars used as standard candles for distance measurement. Muraveva et al. (2018) provided derived parallaxes for 401 RRLs based on recalibrated period-absolute magnitude-metallicity (PMZ) relations and absolute magnitude- metallicity relations. Among them, 77 and 324 RRLs are located at |b| ⩽ 20° and |b| > 20°, respectively. Primary RCs are metalrich low-mass stars (typically smaller than 2 M⊙) with stable luminosities, making them reliable distance indicators. Huang et al. (2020) presented a sample of 137 448 RCs with derived parallaxes. Using over 10 000 primary RCs with GDR2 parallaxes, they recalibrated the KS absolute magnitudes based on LAM- OST data, deriving distances for all RCs with this recalibration. The purity and completeness of their sample are generally higher than 80%. After cross-matching with GDR3 at a radius of 2 arcsec, 96 813 and 37 666 unique matches are located at |b| ⩽ 20° and |b| > 20° , respectively. EWs can also serve as distance indicators due to their well-defined period-luminosity relationship. Ren et al. (2021) presented a catalogue of 113 821 EWs with derived parallaxes from the recalibrated period-luminosity relation. Among them, 83 126 and 26 386 EWs are located at |b| ⩽ 20° and |b| > 20° in GDR3, respectively. Hogg et al. (2019) determined spectrophotometric distances to 44 784 RGBs predicted with a data-driven model combining spectroscopy from APOGEE DR14 and photometric information from 2MASS, Gaia, and WISE. After cross-matching with GDR3 at a radius of 2 arcsec, 37 199 and 7410 unique matches are located at |b| ⩽ 20° and |b| > 20° , respectively. The distance indicator calibrations of RRLs, RCs, EWs, and RGBs, as mentioned above, indirectly depend on GDR2 or GDR3 parallaxes. This introduces the potential for circular reasoning when using these sources to validate GDR3 parallaxes. Therefore, it is important to note that these sources cannot be considered for use in independent verifications; however, they remain valuable for investigating parallax zero-point differences as a function of colour and sky position.
2.2 Quality filtering
2.2.1 Quasars
For all quasar catalogues in Table 1, we apply the following criteria, which are adopted from the GCRF3 quasar selection (Gaia Collaboration 2022):
![Mathematical equation: $\left\{ {\matrix{ {{\rm{ (i) }}} \hfill & {{\rm{astrometri}}{{\rm{c}}_{\rm{p}}}{\rm{aram}}{{\rm{_}}_{\rm{s}}}{\rm{solved = 31 or 95, }}} \hfill \cr {{\rm{ (ii) }}} \hfill & {\mid (\varpi + 0.017{\rm{ mas }})\mid /{\sigma _\pi } < 5,} \hfill \cr {{\rm{ (iii) }}} \hfill & {{{\rm{X}}_\mu }^2 \equiv \left[ {\matrix{ {{\mu _{\alpha *}}} \hfill & {{\mu _\delta }} \hfill \cr } } \right]{\mathop{\rm Cov}\nolimits} {{(\mu )}^{ - 1}}\left[ {\matrix{ {{\mu _{\alpha *}}} \hfill \cr {{\mu _\delta }} \hfill \cr } } \right] < 25.} \hfill \cr } } \right.$](/articles/aa/full_html/2024/11/aa50967-24/aa50967-24-eq2.png) (1)
(1)
Criterion (i) selects the sources that have five- or six-parameter astrometric solutions; criterion (ii) takes the global parallax zeropoint offset of EDR3 (−17 µas) (Lindegren et al. 2021a) into account; and criterion (iii) is that the proper motion components µα* and µδ should be small compared to their uncertainties σµα* and σµδ, where Cov(µ)−1 is the covariance matrix of proper motion. The numbers of unique matches that survived the filtering by Eq. (1) are provided in Columns 5–6 of Table 1. This filtering resulted in the removal of 14%, 22%, 0.01%, 0.1%, 0.02%, and 1% of sources for SDSS DR16Q, LAMOST DR10, LQAC-6, Quaia, GPQ, and CatNorth within the Galactic plane, respectively, and 14%, 4%, 0.2%, 0.07%, 2% and 25% of sources for SDSS DR16Q, LAMOST DR10, LQAC-6, Quaia, CatNorth, and KiDS DR4 outside the Galactic plane, respectively.
2.2.2 Wide binaries
It can be assumed that the components of binaries have similar true parallaxes, although their magnitudes and colours may be very different. Thus, the parallax differences between the components of binaries should be as close to zero as possible. For the WBs, we applied the following criteria:
 (2)
(2)
where ‘1’ and ‘2’ denote the components with the brighter and the fainter G magnitude, respectively. Criterion (i) selects WBs whose components both have five- or six-parameter astrometric solutions. Criterion (ii) selects WBs whose parallax differences between two components fall within five times the formal uncertainty. Criterion (iii) selects WBs whose fainter components can be corrected using the quasar-derived recipe (see Sect. 4). The numbers of unique matches that survived the filtering by Eq. (2) are listed in Columns 5–6 of Table 1, resulting in the removal of 60% and 59% of pairs within and outside the Galactic plane, respectively.
2.2.3 Sources with parallaxes from other surveys or obtained with alternative methods
First, for sources with parallaxes from other surveys or obtained using alternative methods in Table 1, we applied criterion (i) in Eq. (1) to select the sources that have five- or six-parameter astrometric solutions. We assume that the parallax offsets (Δϖ) of these sources are given by the difference between GDR3 parallax (ϖG) and other parallax determinations (ϖO). Assuming that errors are Gaussian as given in GDR3, we use the following criteria to select sources,
 (3)
(3)
where the parallax difference of the source should be zero within five times the formal uncertainty. The numbers of unique matches of sources that survived the filtering by Eqs. (1-i) and (3) are given in Columns 5–6 of Table 1, removing 7%, 26%, 1%, 7%, 9%, 5%, and 2% of sources within the Galactic plane, and 7%, 27%, 0, 3%, 19%, 6%, and 3% of sources outside the Galactic plane, for VLBI, HST, RRLs, RCs, EWs, RGs, and RGBs, respectively.
2.3 Final selection
The numbers of the retained sources are given in Columns 7–8 of Table 1. For WBs, all filtered sources are retained, with 63% having five-parameter solutions and 37% having six-parameter solutions. For sources with parallaxes from other surveys or obtained using alternative methods, all filtered sources are also retained, with 98% having five-parameter solutions and 2% having six-parameter solutions. For all quasar catalogues, we first excluded overlapping sources in GCRF3 to obtain the Non- GCRF3 sources. Next, duplicate Non-GCRF3 sources among quasar catalogues were removed. The final union of the Non- GCRF3 sample contains 81 263 sources located at |b| ⩽ 20° and 241 588 sources at |b| > 20°. Among the Non-GCRF3 sources within the Galactic plane, 51 546 (63%) have five- parameter solutions and 29 717 (37%) have six-parameter solutions in GDR3. Outside the Galactic plane, 153 923 (64%) have five-parameter solutions and 87 665 (36%) have six-parameter solutions in GDR3.
To estimate the level of stellar contamination in Non- GCRF3, we analysed histograms of the normalised parallaxes ϖ/σϖ and normalised proper motion components  . Ignoring small systematic and random offsets, the normalised quantities should follow Gaussian distributions with mean values of close to zero and standard deviations only slightly larger than one for a clean sample of QSOs, as described in Gaia Collaboration (2022) (see Sect. 2.3). Conversely, if their distributions deviate significantly from the expected Gaussian, this indicates that the sample is contaminated by stellar objects with non-zero parallaxes and/or proper motions. Figure 1 shows the distributions of the normalised parallaxes and proper motion components for the Non-GCRF3 sample located at |b| ⩽ 20° and |b| > 20°, respectively, with five-parameter and six-parameter solutions. For the Non-GCRF3 sample located at |b| ⩽ 20°, the standard deviations of the three normalised quantities are 1.058, 1.075, and 1.098 for the five-parameter solutions and 1.071, 1.158, and 1.210 for the six-parameter solutions. For the Non-GCRF3 sample located at |b| > 20°, the standard deviations are 1.042, 1.087, and 1.107 for the five-parameter solutions and 1.053, 1.105, and 1.127 for the six-parameter solutions. In comparison, the standard deviations of the normalised quantities in GCRF3 are 1.052, 1.055, and 1.063 for the five-parameter solutions and 1.073, 1.099, and 1.116 for the six-parameter solutions (Gaia Collaboration 2022). The slightly larger standard deviations in our Non-GCRF3 sample indicate minor differences, but overall, the distributions remain very symmetric and close to Gaussian, suggesting a low level of stellar contamination.
Due to the high density of stellar sources in the Galactic plane, we also plot the colour-colour diagram for the Non- GCRF3 sample located at |b| ⩽ 20°, compared with galaxies, stars, and GCRF3 located at |b| ⩽ 20°, see Fig. 2. For the Non- GCRF3 sample, we sampled 2000 quasars to better visualise the overlapping structures with GCRF3. The selection of galaxies and stars used in the analysis are detailed in Appendix A. The overlap between the contours of the Non-GCRF3 and GCRF3 samples indicates the reliability of our sample. Figure 3 displays the distribution of the Non-GCRF3 sample located at |b| ⩽ 20° in Galactic latitude. In this paper, we focus on sources with five- parameter solutions, as most of the sources of our samples have five-parameter solutions.
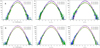 |
Fig. 1 Distributions of the normalised parallaxes and proper motion components for the Non-GCRF3 sample located at |b| ⩽ 20° (a) and |b| > 20° (b), respectively, with five-parameter (blue) and six-parameter (green) solutions. The turquoise curves show the corresponding best-fit Gaussian distributions. |
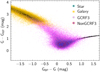 |
Fig. 2 Colour–colour diagram for Non-GCRF3 (blue), GCRF3 (pink), galaxies (yellow), and stars (black) in the Galactic plane (|b| ⩽ 20°). |
3 Validation of the L21 correction
In this section, we assess the validity of the L21 correction by dividing the sky into two regions: the Galactic plane region (|b| ⩽20°) and the off-Galactic-plane region (|b| > 20°). We use QSOs, WBs, and sources with parallaxes from other surveys or methods listed in Table 1 to evaluate the L21 correction.
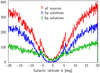 |
Fig. 3 Distribution of the Non-GCRF3 sample located at |b| ⩽ 20° in Galactic latitude. The distribution is shown for the whole sample (red) and separately for the sources with five-parameter (blue) and six- parameter (green) astrometric solutions. |
3.1 Quasar verification
First, we used quasars to assess the validity of the L21 correction. Since the L21 correction is primarily based on the GCRF3 sample, we applied it to the Non-GCRF3 sample to examine its sample dependence.
Figures 4 and 5 display the results for the five-parameter solutions of the Non-GCRF3 sample located at |b| ⩽ 20° and | b| > 20°, respectively. The figures are divided according to magnitude, colour, and ecliptic latitude. Blue dots show the individual values plotted versus magnitude, effective wavenumber, and sine of ecliptic latitude. Black circles show mean values of the uncorrected parallaxes (ϖ) in bins of magnitude and so on; green circles show mean values of the corrected parallaxes (ϖ − Z5) applying the L21 correction. In Fig. 4, the corrected parallaxes (green) are not centred on zero, showing a zero-point deviation of approximately 20 µas. This indicates that the L21 correction does not apply to the Galactic plane effectively. In contrast, Fig. 5 shows that the L21 correction is more effective for sources located at |b| > 20°, particularly in regions of high source density.
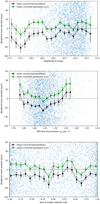 |
Fig. 4 Parallaxes for 51 546 quasars with five-parameter solutions located at |b| ⩽ 20° in the Non-GCRF3 sample. |
3.2 Binary verification
It can be assumed that the components of binaries have similar true parallaxes, although their magnitudes and colours may be very different. We compared the corrected parallax differences (applying the L21 correction) of WBs with the zero point to assess the validity of the L21 correction.
Figures 6 and 7 show the parallax differences for the five- parameter solutions of WBs located at |b| ⩽ 20° and |b| > 20°, respectively, divided according to magnitude, colour, and ecliptic latitude. The horizontal axes represent the properties of the bright components of the binaries. Blue dots show the individual values plotted versus magnitude, effective wavenumber, and sine of ecliptic latitude. Black circles show mean values of the uncorrected parallax differences (ϖ1 – ϖ2) in bins of magnitude and so on; green circles show mean values of the corrected parallax differences applying the L21 correction  . After applying the L21 correction, the mean values of parallax differences (green) of WBs are not centred on zero, regardless of whether WBs are located at |b| ⩽ 20° or |b| > 20°. We conclude that the L21 correction exhibits sample dependence and does not apply effectively to these WBs. The parallax differences as a function of magnitude and colour differences are shown in Appendix B. As expected, these differences approach zero for small magnitude and colour differences for both the corrected and uncorrected versions.
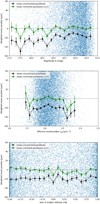 |
Fig. 5 Parallaxes for 153 923 quasars with five-parameter solutions located at |b| > 20° in the Non-GCRF3 sample. |
3.3 Further verification
In addition to quasar and binary verifications, we also compared independent parallaxes from other surveys or methods with the GDR3 parallaxes to assess the validity of the L21 correction, including VLBI, HST, and RG sources listed in Table 1. Table 2 gives the results for five-parameter solutions of these sources located at |b| ⩽ 20° and |b| > 20°, respectively. In the Galactic plane (|b| ⩽ 20°), the L21 correction results in overcorrection for VLBI sources. Outside the Galactic plane (|b| > 20°), the L21 correction results in overcorrection for VLBI, HST, and RG sources. For VLBI and HST sources, the sample sizes are too small to rigorously assess the L21 correction. Based on these results, we conclude that the L21 correction exhibits sample dependence.
Although RRLs, RCs, EWs, and RGBs cannot be considered independent checks due to their indirect dependence on Gaia parallaxes, we still present the results for these sources in Table 2. Additionally, we plot the parallax zero-point differences as a function of colour and ecliptic latitude for sources with derived parallaxes (RGs, RRLs, RCs, EWs, and RGBs) in Fig. C.1; for further details, see Appendix C. Overall, the parallax zero-point differences show distinct behaviours within and outside the Galactic plane, supporting the necessity of this work.
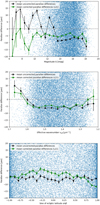 |
Fig. 6 Parallax differences of 148 234 binaries located at |b| ⩽ 20° with five-parameter solutions binned by magnitude, colour, and ecliptic latitude of the bright components of binaries. |
4 Estimate of the new correction coefficients
In this section, we fit the parallax bias function for sources with five-parameter solutions and get the new coefficients that apply to the Galactic plane. We use the parameterised function Z(G, veff, β) defined in Appendix A of L21. The generic function is
 (4)
(4)
where the functions
 (5)
(5)
are piecewise linear in G. Among the functions, gi(G) are the basis functions in magnitude, cj(veff) are the basis functions in colour, and bk(β) are the basis functions in ecliptic latitude. The coefficients zijk are the free parameters used to fit Z to the given data. For more details on the basis functions, see L21 Appendix A. The primary methods for estimating the new correction involve either: (i) using quasars to directly estimate the parallax bias for G ≳ 16, or (ii) using binaries to map differential variations for bright stars.
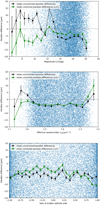 |
Fig. 7 Parallax differences of 172 931 binaries located at |b| > 20° with five-parameter solutions binned by magnitude, colour, and ecliptic latitude of the bright components of binaries. |
Parallax corrections for sources with parallaxes with five-parameter solutions.
4.1 Quasars
First, we used the Non-GCRF3 sample with five-parameter solutions located at |b| ⩽ 20° to estimate the new correction coefficients. For completeness, we also considered GCRF3 in the estimation. The GCRF3 sample located at |b| ⩽ 20° contains 139 907 sources with five-parameter solutions. The combined sample includes 191 286 sources with five-parameter solutions and wavenumbers in the range of 1.24–1.72 µm−1. The magnitudes range from G ≃ 13.8 to 21.0; only 99 sources are brighter than G = 16.1.
Figure 8 shows the weighted mean parallax plotted against G, νeff, and β. The blue points show the parallaxes of individual sources. In each bin, the black square is the mean parallax in DR3 weighted by  , with error bars indicating the estimated standard deviation of the weighted mean. The main trends are as follows.
Overall, a negative parallax bias is observed: the weighted mean parallax of the sample is approximately −18 µas, with a median of about −12.7 µas. These values are represented by the red lines in Fig. 8, and they are slightly smaller than those reported in L21 (−21 and −17 µas).
As a function of G, there is a non-linear variation when G ≲ 16, followed by an approximately linear increase from G ⋍ 16 to 20.
The variation as a function of νeff shows an approximately linear trend within the well-populated range of colours.
As a function of β, there is a non-linear variation.
The trends described above can be well approximated by the parameterised function Z(G, νeff , β) in Eq. (5). However, considering the limited support in G and νeff , we need to add some constraints. We only use i = 8… 12 for the basis function in magnitude, gi (G), given the scarcity of quasars in the range G < 16.1. Additionally, for the basis function in colour, cj(νeff), we use j = 0 and 1 for wavenumbers of the sample in the range 1.24– 1.72 µm−1. The quasar sample contains few sources redder than veff ≃ 1.4 µm−1 or bluer than 1.7 µm−1, and therefore cannot be used to estimate qjk for j = 2, 3, and 4.
Our estimate of Z5(G, νeff , β) from the quasar sample is given by the coefficients qjk in Table 3. It is primarily valid within the subspace populated by quasars. Most importantly, this does not include sources that are brighter than G ≃ 16 or redder than veff ≃ 1.48 µm−1. To extend Z5 in these directions, we resort to the differential method using physical pairs.
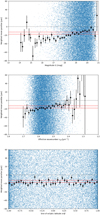 |
Fig. 8 Mean parallax of quasars binned by magnitude, effective wavenumber, and sine of ecliptic latitude. The two red lines indicate the weighted mean value (−18 µas) and median (−12.7 µas) of the full sample. |
Coefficients for the function fitted to the quasar parallaxes.
4.2 Wide binaries
Having mapped Z5(G,νeff, β) for G > 16.1 with quasars, we extended our analysis to brighter sources. Similar to the methods in L21, we also used binaries for which it can be assumed that the components share similar true parallaxes. Using the results from the previous section to ‘float’ the parallax bias of the fainter component of binaries, we were then able to estimate the bias of the brighter component, as
 (6)
(6)
where ‘1’ and ‘2’ denote the components with the brighter and the fainter G magnitude of the binaries, respectively, and Z5(G2, veff2,β) represents the parallax bias of the faint component, with Z5 defined by the coefficients in Table 3. The bias-corrected parallax of the faint component is computed as ϖ2 − Z5(G2, veff2,β), where ϖ2 and veff2 are the published GDR3 parallax and effective wavenumber of the faint component. Z5(G1,veff 1,β) is denoted as the parallax bias estimate of the brighter component. We used WBs listed in Table 1 with five-parameter solutions and G in the range of 6.0–21.0, located at |b| ⩽ 20°, to estimate the new correction coefficients.
Figure 9 shows the parallax bias of the bright components plotted against G, veff, and β. The blue points show the parallax differences of individual sources. In each bin, the black square is the weighted mean parallax difference in DR3 weighted by  , with error bars indicating the estimated standard deviation of the weighted mean. The main trends are as follows:
In general, there is a negative parallax bias: the weighted mean parallax of the sample is approximately −31.3 µas, with a median of about −29.1 µas, as indicated by the two overlapping red lines in Fig. 9.
As a function of G, there is a non-linear variation, except for the approximately linear increase from G ⋍ 16 to 18.
As a function of veff, the variation is approximately linear when veff ≳ 1.5 and ≲ 1.7 µm−1, with a slight curvature when veff ≳ 1.2 and ≲ 1.5 µm−1. There are very sources where veff ≳ 1.7 µm−1.
As a function of β, the variation can be described by a quadratic polynomial in sinβ.
The investigated magnitude interval overlaps with the range in Table 3 for G ≃ 16.1–19, providing a consistency check and a potentially improved estimate of the parallax bias in an interval poorly covered by quasars. Considering the trends in Fig. 9, we use i = 0…10 for the magnitude basis function, g¡(G), and j = 0,1,2 for the colour basis function, Cj(veff). The curvature with colour in the mid-red region (veff = 1.24–1.48 µm−1) is fully described by the non-interaction term q20 , that is q21 = q22 = 0. A severe limitation is that the scarcity of bright sources with veff < 1.2 or > 1.7 µm−1 makes it almost impossible to determine q30 and q40 . The resulting fit is given in Table 4.
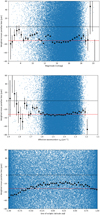 |
Fig. 9 Weighed mean parallax bias of the bright components of binaries binned by magnitude, effective wavenumber, and sine of ecliptic latitude. The two overlapping red lines indicate the weighted mean (−31.3 µas) and median (−29.1 µas) of the full sample. |
4.3 Combined fit
The magnitude intervals overlap between Tables 3 and 4 for G = 16.1–19.0. We combine the coefficients for G = 16.1–21.0 from Table 3 and the coefficients for G = 6.0–15.9 from Table 4. Our tests show that this combination leads to effective corrections. The end result is shown in Table 5; this is our final estimate of the bias function for five-parameter solutions that apply to the Galactic plane.
5 Comparison and verification
In this section, we present the results of applying the new bias correction in this work (TW) and the L21 correction to various samples to evaluate and compare their effectiveness. We employed the quasars used to derive the correction in Sect. 4.1 to perform a consistency check on the procedures used to derive the correction. Additionally, we tested two corrections on globular clusters and sources with independent parallaxes from other surveys or obtained using other methods independent of the derivation process.
Coefficients for the function as estimated from wide binaries.
5.1 Using quasars
We applied two bias corrections to quasars described in Sect. 4.1, expecting the mean corrected parallaxes after applying the new bias correction to be closer to zero, and to be independent of magnitude, colour, and so on. Figure 10 shows the results for the five-parameter solutions, divided according to magnitude, colour, and ecliptic latitude. Black circles show the mean values of the uncorrected parallaxes (ϖ) in bins of magnitude and so on; blue circles and green circles show the mean values of the corrected parallaxes (ϖ − Z5) after applying the new correction of this work (TW) and the L21 correction, respectively. Overall, the parallaxes corrected with the new bias correction are closer to zero than those corrected with the L21 model, indicating that the new correction is more applicable to the Galactic plane. The correction difference between L21 and this work is approximately 9.71 µas at the faint magnitude end and can be as high as 11.07 µas when veff = 1.42 µm−1.
5.2 Using globular clusters
As all stars in a given globular cluster share the same true parallax (with negligible spread), we can use stars in globular clusters to validate bias corrections. Vasiliev & Baumgardt (2021) used GEDR3 data to investigate the kinematic properties of Milky Way globular clusters, employing a mixture modelling approach to simultaneously determine cluster membership probabilities for each star and infer cluster properties, particularly the mean parallax. Several clusters located at |b| ≃ 20° are considered for our purpose, including NGC 6397, NGC 5139, NGC 6121, and NGC 6656. These clusters are located at b ≃ −12°, +15°, +16°, and −8°, with mean parallaxes of 0.416 ± 0.010 mas, 0.193 ± 0.009 mas, 0.556 ± 0.010 mas, and 0.306 ± 0.010 mas (Vasiliev & Baumgardt 2021), respectively. We selected stars in these clusters with five-parameter solutions that have a high membership probability and reliable astrometric measurements, as described in Eq. (7).
 (7)
(7)
Criterion (i) selects reliable astrometric sources with five- parameter solutions; and criterion (ii) selects stars with high membership probability (>90%). Using these ‘clean’ subsets, we compared the validity of the two bias corrections.
Figure 11 shows the results for stars in NGC 6397, which are divided according to magnitude, effective wavenumber, and ecliptic latitude. Blue dots show the individual values plotted versus magnitude, effective wavenumber, and sine of ecliptic latitude. Black circles show mean values of the uncorrected parallaxes (ϖ) in bins of magnitude and so on; blue circles and green circles show the mean values of the corrected parallaxes (ϖ − Z5) after applying the new correction of this work (TW) and the L21 correction, respectively. The middle grey dashed line indicates the mean parallax (0.416 mas), while the other two grey dashed lines represent its statistical uncertainty (0.010 mas). Overall, the corrected parallaxes after applying the new correction are closer to the mean parallax. The correction difference of NGC 6397 between L21 and this work is about 10.0 µas when 0.9 < sin β < 0.95, and can be as high as 17.82 µas when G = 16. Results for the other clusters are described in Sect. 5.4.
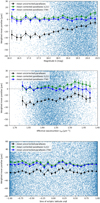 |
Fig. 10 Parallaxes for 180 231 quasars with five-parameter solutions in GDR3. |
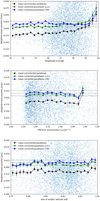 |
Fig. 11 Parallaxes for 12 307 stars in NGC 6397 with five-parameter solutions in GDR3. |
5.3 Using sources with independent parallaxes from other surveys or obtained with alternative methods
Following the method in Sect. 3.3, we compare independent parallaxes from other surveys or methods with the GDR3 parallaxes to assess the validity of the two corrections in the Galactic plane. VLBI, HST, and RG sources located at |b| ⩽ 20° and with independent parallaxes are listed in Table 1. As these sources may be affected by different external systematic uncertainties, tests involving them only serve as a secondary verification. The results are given in Table 6. The new correction in this work (TW) proves to be more effective than the L21 correction for VLBI sources. Other sources show comparable results for the two corrections. Overall, our correction demonstrates effectiveness for most sources with independent parallaxes.
5.4 Limitations
Results for NGC 5139, NGC 6121, and NGC 6656 can be found in Appendix D. Overall, the two corrections exhibit similar efficacy for these clusters, though the two corrections are not optimal. This may be due to challenges in determining globular cluster membership of Vasiliev & Baumgardt (2021). We acknowledge the possibility that our correction method may be sample-dependent. However, even with a more comprehensive sample for fitting the new model, sample-dependence issues may persist (Groenewegen 2021).
Parallax corrections for sources with independent parallaxes located at |b| ⩽ 20° with five-parameter solutions.
6 Summary
L21 proposed a complex recipe to address the parallax bias in GDR3, drawing from quasars in GCRF3, stars in LMC, and physical binaries. However, as the L21 sample is sparse in the Galactic plane, we evaluated the efficiency of the L21 correction in this region using quasars, wide binaries, and sources with parallaxes from other surveys or determined using alternative methods. Our results, detailed in Figs. 4–7 and Table 2, suggest that the L21 correction is sample-dependent and not applicable to the Galactic plane. We fit the parallax bias function for sources with five-parameter solutions and obtained new coefficients that apply to the Galactic plane. A direct estimation of the parallax bias via quasars is supplemented by indirect methods involving binaries. For sources in this region with five-parameter solutions in GDR3, the new fitted bias function is given by the functions qjk(G) obtained through linear interpolation in Table 5.
In this study, we present a new parallax bias correction tailored specifically to the Galactic plane, offering improvements over the existing L21 correction, the validity of which for use with parallaxes in the Galactic plane was previously untested. The correction difference between L21 and this work can be as high as 10 µas within certain ranges of magnitude and colour. The differences in parallax corrections between these two recipes are primarily evident in magnitude and colour, likely due to the influence of extinction from the Milky Way disk on these parameters. Historically, the Galactic plane has posed challenges for quasar surveys due to its high source density and significant extinctions. Our work represents a comprehensive effort to compile the most exhaustive collection of quasars within this region to date. It is important to note that this paper does not claim to provide a definitive solution, but rather offers a new approach to address the parallax bias issue in the Galactic plane. This work provides an additional recipe for users of Gaia parallaxes, especially regarding sources located near the Galactic plane. We acknowledge the possibility that our correction method may be sample dependent. However, we tried to incorporate data from diverse sources within the Galactic plane and rigorously tested our correction against various samples. Further progress is expected with Gaia DR4, which will have improved parallax uncertainties and reduced systematic errors.
Acknowledgements
We appreciate the insightful advice provided by Dr. G.A. Brown. This work has made use of data from the European Space Agency (ESA) mission Gaia (https://www.cosmos.esa.int/gaia), processed by the Gaia Data Processing and Analysis Consortium (DPAC, https://www.cosmos.esa.int/web/gaia/dpac/consortium). Funding for the DPAC has been provided by national institutions, in particular the institutions participating in the Gaia Multilateral Agreement. This research has made use of the VizieR catalogue access tool and the cross-match service provided by CDS, Strasbourg. We are also very grateful to the developers of the TOPCAT (Taylor 2005) software. This work has been supported by the National Natural Science Foundation of China (NSFC) through grants 12173069, the Strategic Priority Research Program of the Chinese Academy of Sciences, Grant No.XDA0350205, the Youth Innovation Promotion Association CAS with Certificate Number 2022259, the Talent Plan of Shanghai Branch, Chinese Academy of Sciences with No. CASSHB-QNPD-2023-016. We acknowledge the science research grants from the China Manned Space Project with No. CMS-CSST-2021-A12 and No. CMS-CSST-2021-B10.
Appendix A ADQL queries for the galaxy and star sample
Figure 2 shows the distribution of the two colours of Non- GCRF3 quasars, GCRF3 quasars, galaxies, and stars located at |b| ⩽ 20°. The sources used to construct samples of galaxies and stars are as follows:
Galaxies: random 100 000 galaxies located at |b| ⩽ 20° using criteria provided in Gaia Collaboration (2023a, see Table 11) to select the pure galaxy sample. The ADQL query is as follows.
SELECT TOP 100000 g.*
FROM gaiadr3.galaxy_candidates as c
INNER JOIN gaiadr3.gaia_source as g
USING (source_id)
WHERE (c.radius_sersic IS NOT NULL
OR c.classlabel_dsc_joint=’galaxy’
OR c.vari_best_class_name=’GALAXY’)
AND (g.b BETWEEN -20 AND 20)
Stars: We take a random 100 000 stars located at |b| ⩽ 20° by selecting high reliable astrometric sources which are not candidates of quasars and galaxies. The ADQL query is as follows.
SELECT TOP 100000 *
FROM gaiadr3.gaia_source
WHERE in_qso_candidates = ’false’
AND in_galaxy_candidates = ’false’
AND ruwe <= 1.4
AND parallax <= 0.2
AND parallax_over_error >= 5
AND astrometric_excess_noise_sig <= 2
AND astrometric_excess_noise <= 0.1
AND visibility_periods_used >11
AND duplicated_source = ’false’
AND phot_variable_flag !=’VARIABLE’
AND phot_bp_mean_flux_over_error > 100
AND phot_g_mean_flux_over_error > 100
AND phot_rp_mean_flux_over_error > 100
AND b BETWEEN -20 AND 20
Appendix B Parallax differences of binaries against magnitude and colour differences
Figures B.1 and B.2 show the results for the five-parameter solutions of WBs located at |b| ⩽ 20° and |b| > 20° according to magnitude difference (G1 − G2) and colour difference (veff1 − veff2), respectively. The parallax differences go to zero for small magnitude and colour differences for both the corrected and uncorrected versions.
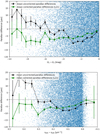 |
Fig. B.1 Parallax differences of 148 234 binaries located at |b| ⩽ 20° with five-parameter solutions versus magnitude and colour differences. |
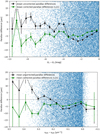 |
Fig. B.2 Parallax differences of 172 931 binaries located at |b| > 20° with five-parameter solutions versus magnitude and colour differences. |
Appendix C Parallax zero-point differences of sources with derived parallaxes against colour and ecliptic latitude
Figure C.1 shows the results for the five-parameter solutions of sources with derived parallaxes from different methods (RGs, RRLs, RCs, EWs, and RGBs), located at |b| ⩽ 20° (a) and |b| > 20° (b) according to colour and ecliptic latitude, respectively. VLBI and HST sources are not plotted due to their small sample sizes. Overall, the parallax differences show clear distinctions between regions within and outside the Galactic plane.
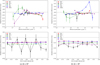 |
Fig. C.1 Parallax zero-point differences versus colour and ecliptic latitude of sources with derived parallaxes (RGs, RRLs, RCs, EWs, and RGBs) located at |b| ⩽ 20° (a) and |b| > 20° (b) with five-parameter solutions. The dots with error bars represent the weighted mean parallax differences for each bin across different samples. The large error bars for RRLs (black) are attributed to the limited sample size. The grey dashed line indicates a parallax difference of zero. |
Appendix D Tests of other globular clusters
Figures D.1, D.2, and D.3 show the results for stars in NGC 5139, NGC 6121, and NGC 6397, respectively. These figures are divided according to magnitude, effective wavenumber and ecliptic latitude. Blue dots show the individual values plotted versus magnitude, effective wavenumber, and sine of ecliptic latitude. Black circles show mean values of the uncorrected parallaxes (ϖ) in bins of magnitude etc.; blue circles and green circles show mean values of the corrected parallaxes (ϖ − Z5) applying the new correction in this work (TW) and the L21 correction respectively. In Fig. D.1, the corrected parallaxes applying the L21 model (green) of NGC 5139 are closer to the mean parallax zone (0.193 ± 0.009 mas). Figures D.2 and D.3 show that both corrections yield comparable results within the well-populated region.
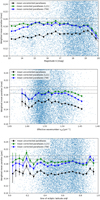 |
Fig. D.1 Parallaxes for 53 309 stars in NGC 5139 with five-parameter solutions in GDR3. The middle grey dashed line indicates the mean parallax (0.193 mas), while the other two grey dashed lines represent its statistical uncertainty (0.009 mas). |
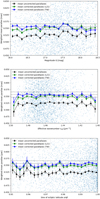 |
Fig. D.2 Parallaxes for 5208 stars in NGC 6121 with five-parameter solutions in GDR3. The middle grey dashed line indicates the mean parallax (0.556 mas), while the other two grey dashed lines represent its statistical uncertainty (0.010 mas). |
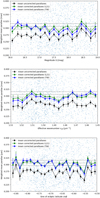 |
Fig. D.3 Parallaxes for 4323 stars in NGC 6656 (0.306 ± 0.010 mas) with five-parameter solutions in GDR3. The middle grey dashed line indicates the mean parallax (0.306 mas), while the other two grey dashed lines represent its statistical uncertainty (0.010 mas). |
References
- Benedict, G. F., McArthur, B. E., Nelan, E. P., & Harrison, T. E. 2017, PASP, 129, 012001 [NASA ADS] [CrossRef] [Google Scholar]
- Bond, H. E., Nelan, E. P., Remage Evans, N., Schaefer, G. H., & Harmer, D. 2018, ApJ, 853, 55 [NASA ADS] [CrossRef] [Google Scholar]
- Casertano, S., Riess, A. G., Anderson, J., et al. 2016, ApJ, 825, 11 [Google Scholar]
- Dias, W. S., Monteiro, H., Caetano, T. C., et al. 2014, A&A, 564, A79 [NASA ADS] [CrossRef] [EDP Sciences] [Google Scholar]
- El-Badry, K., Rix, H.-W., & Heintz, T. M. 2021, MNRAS, 506, 2269 [NASA ADS] [CrossRef] [Google Scholar]
- Fabricius, C., Luri, X., Arenou, F., et al. 2021, A&A, 649, A5 [NASA ADS] [CrossRef] [EDP Sciences] [Google Scholar]
- Fu, Y., Wu, X.-B., Yang, Q., et al. 2021, ApJS, 254, 6 [NASA ADS] [CrossRef] [Google Scholar]
- Fu, Y., Wu, X.-B., Jiang, L., et al. 2022, ApJS, 261, 32 [NASA ADS] [CrossRef] [Google Scholar]
- Fu, Y., Wu, X.-B., Li, Y., et al. 2024, ApJS, 271, 54 [NASA ADS] [CrossRef] [Google Scholar]
- Gaia Collaboration (Prusti, T., et al.) 2016, A&A, 595, A1 [NASA ADS] [CrossRef] [EDP Sciences] [Google Scholar]
- Gaia Collaboration (Brown, A. G. A., et al.) 2018, A&A, 616, A1 [NASA ADS] [CrossRef] [EDP Sciences] [Google Scholar]
- Gaia Collaboration (Klioner, S. A., et al.) 2022, A&A, 667, A148 [NASA ADS] [CrossRef] [EDP Sciences] [Google Scholar]
- Gaia Collaboration (Bailer-Jones, C. A. L., et al.) 2023a, A&A, 674, A41 [NASA ADS] [CrossRef] [EDP Sciences] [Google Scholar]
- Gaia Collaboration (Vallenari, A., et al.) 2023b, A&A, 674, A1 [NASA ADS] [CrossRef] [EDP Sciences] [Google Scholar]
- Groenewegen, M. A. T. 2021, A&A, 654, A20 [NASA ADS] [CrossRef] [EDP Sciences] [Google Scholar]
- Hogg, D. W., Eilers, A.-C., & Rix, H.-W. 2019, AJ, 158, 147 [Google Scholar]
- Huang, Y., Schönrich, R., Zhang, H., et al. 2020, ApJS, 249, 29 [NASA ADS] [CrossRef] [Google Scholar]
- Huang, Y., Yuan, H., Beers, T. C., & Zhang, H. 2021, ApJ, 910, L5 [NASA ADS] [CrossRef] [Google Scholar]
- Jin, J.-J., Wu, X.-B., Fu, Y., et al. 2023, ApJS, 265, 25 [NASA ADS] [CrossRef] [Google Scholar]
- Khan, S., Miglio, A., Willett, E., et al. 2023, A&A, 677, A21 [NASA ADS] [CrossRef] [EDP Sciences] [Google Scholar]
- Kharchenko, N. V., Piskunov, A. E., Schilbach, E., Röser, S., & Scholz, R. D. 2013, A&A, 558, A53 [NASA ADS] [CrossRef] [EDP Sciences] [Google Scholar]
- Liao, S., Wu, Q., Qi, Z., et al. 2021, PASP, 133, 094501 [NASA ADS] [CrossRef] [Google Scholar]
- Lindegren, L., Bastian, U., Biermann, M., et al. 2021a, A&A, 649, A4 [EDP Sciences] [Google Scholar]
- Lindegren, L., Klioner, S. A., Hernández, J., et al. 2021b, A&A, 649, A2 [EDP Sciences] [Google Scholar]
- Lyke, B. W., Higley, A. N., McLane, J. N., et al. 2020, ApJS, 250, 8 [NASA ADS] [CrossRef] [Google Scholar]
- Muraveva, T., Delgado, H. E., Clementini, G., Sarro, L. M., & Garofalo, A. 2018, MNRAS, 481, 1195 [Google Scholar]
- Nakoneczny, S. J., Bilicki, M., Pollo, A., et al. 2021, A&A, 649, A81 [NASA ADS] [CrossRef] [EDP Sciences] [Google Scholar]
- Reid, M. J., & Honma, M. 2014, ARA&A, 52, 339 [NASA ADS] [CrossRef] [Google Scholar]
- Ren, F., Chen, X., Zhang, H., et al. 2021, ApJ, 911, L20 [NASA ADS] [CrossRef] [Google Scholar]
- Riess, A. G., Casertano, S., Anderson, J., MacKenty, J., & Filippenko, A. V. 2014, ApJ, 785, 161 [Google Scholar]
- Riess, A. G., Casertano, S., Yuan, W., et al. 2018, ApJ, 855, 136 [Google Scholar]
- Souchay, J., Secrest, N., Sexton, R., & Barache, C. 2024, A&A, 683, A112 [NASA ADS] [CrossRef] [EDP Sciences] [Google Scholar]
- Storey-Fisher, K., Hogg, D. W., Rix, H.-W., et al. 2024, ApJ, 964, 69 [NASA ADS] [CrossRef] [Google Scholar]
- Taylor, M. B. 2005, in Astronomical Society of the Pacific Conference Series, 347, Astronomical Data Analysis Software and Systems XIV, eds. P. Shopbell, M. Britton, & R. Ebert, 29 [NASA ADS] [Google Scholar]
- van Belle, G. T., Schaefer, G. H., von Braun, K., et al. 2020, PASP, 132, 054201 [NASA ADS] [CrossRef] [Google Scholar]
- Vasiliev, E., & Baumgardt, H. 2021, MNRAS, 505, 5978 [NASA ADS] [CrossRef] [Google Scholar]
- Xu, S., Zhang, B., Reid, M. J., Zheng, X., & Wang, G. 2019, ApJ, 875, 114 [NASA ADS] [CrossRef] [Google Scholar]
- Zinn, J. C. 2021, AJ, 161, 214 [Google Scholar]
We selected |b| ⩽ 20° rather than 10° for two reasons: first, to broaden our sample coverage and encompass a larger portion of the Galactic plane, and second, to ensure an overlapping area with GCRF3, which was considered in L21.
All Tables
Parallax corrections for sources with independent parallaxes located at |b| ⩽ 20° with five-parameter solutions.
All Figures
|
Fig. 1 Distributions of the normalised parallaxes and proper motion components for the Non-GCRF3 sample located at |b| ⩽ 20° (a) and |b| > 20° (b), respectively, with five-parameter (blue) and six-parameter (green) solutions. The turquoise curves show the corresponding best-fit Gaussian distributions. |
| In the text | |
|
Fig. 2 Colour–colour diagram for Non-GCRF3 (blue), GCRF3 (pink), galaxies (yellow), and stars (black) in the Galactic plane (|b| ⩽ 20°). |
| In the text | |
|
Fig. 3 Distribution of the Non-GCRF3 sample located at |b| ⩽ 20° in Galactic latitude. The distribution is shown for the whole sample (red) and separately for the sources with five-parameter (blue) and six- parameter (green) astrometric solutions. |
| In the text | |
|
Fig. 4 Parallaxes for 51 546 quasars with five-parameter solutions located at |b| ⩽ 20° in the Non-GCRF3 sample. |
| In the text | |
|
Fig. 5 Parallaxes for 153 923 quasars with five-parameter solutions located at |b| > 20° in the Non-GCRF3 sample. |
| In the text | |
|
Fig. 6 Parallax differences of 148 234 binaries located at |b| ⩽ 20° with five-parameter solutions binned by magnitude, colour, and ecliptic latitude of the bright components of binaries. |
| In the text | |
|
Fig. 7 Parallax differences of 172 931 binaries located at |b| > 20° with five-parameter solutions binned by magnitude, colour, and ecliptic latitude of the bright components of binaries. |
| In the text | |
|
Fig. 8 Mean parallax of quasars binned by magnitude, effective wavenumber, and sine of ecliptic latitude. The two red lines indicate the weighted mean value (−18 µas) and median (−12.7 µas) of the full sample. |
| In the text | |
|
Fig. 9 Weighed mean parallax bias of the bright components of binaries binned by magnitude, effective wavenumber, and sine of ecliptic latitude. The two overlapping red lines indicate the weighted mean (−31.3 µas) and median (−29.1 µas) of the full sample. |
| In the text | |
|
Fig. 10 Parallaxes for 180 231 quasars with five-parameter solutions in GDR3. |
| In the text | |
|
Fig. 11 Parallaxes for 12 307 stars in NGC 6397 with five-parameter solutions in GDR3. |
| In the text | |
|
Fig. B.1 Parallax differences of 148 234 binaries located at |b| ⩽ 20° with five-parameter solutions versus magnitude and colour differences. |
| In the text | |
|
Fig. B.2 Parallax differences of 172 931 binaries located at |b| > 20° with five-parameter solutions versus magnitude and colour differences. |
| In the text | |
|
Fig. C.1 Parallax zero-point differences versus colour and ecliptic latitude of sources with derived parallaxes (RGs, RRLs, RCs, EWs, and RGBs) located at |b| ⩽ 20° (a) and |b| > 20° (b) with five-parameter solutions. The dots with error bars represent the weighted mean parallax differences for each bin across different samples. The large error bars for RRLs (black) are attributed to the limited sample size. The grey dashed line indicates a parallax difference of zero. |
| In the text | |
|
Fig. D.1 Parallaxes for 53 309 stars in NGC 5139 with five-parameter solutions in GDR3. The middle grey dashed line indicates the mean parallax (0.193 mas), while the other two grey dashed lines represent its statistical uncertainty (0.009 mas). |
| In the text | |
|
Fig. D.2 Parallaxes for 5208 stars in NGC 6121 with five-parameter solutions in GDR3. The middle grey dashed line indicates the mean parallax (0.556 mas), while the other two grey dashed lines represent its statistical uncertainty (0.010 mas). |
| In the text | |
|
Fig. D.3 Parallaxes for 4323 stars in NGC 6656 (0.306 ± 0.010 mas) with five-parameter solutions in GDR3. The middle grey dashed line indicates the mean parallax (0.306 mas), while the other two grey dashed lines represent its statistical uncertainty (0.010 mas). |
| In the text | |
Current usage metrics show cumulative count of Article Views (full-text article views including HTML views, PDF and ePub downloads, according to the available data) and Abstracts Views on Vision4Press platform.
Data correspond to usage on the plateform after 2015. The current usage metrics is available 48-96 hours after online publication and is updated daily on week days.
Initial download of the metrics may take a while.