| Issue |
A&A
Volume 691, November 2024
|
|
|---|---|---|
| Article Number | A108 | |
| Number of page(s) | 11 | |
| Section | Stellar structure and evolution | |
| DOI | https://doi.org/10.1051/0004-6361/202450674 | |
| Published online | 31 October 2024 | |
Separating the causes of O–C variations in an RR Lyrae star with the Blazhko effect
The case of V1109 Cas
1
Institute of Applied Nuclear Technology (ITNA), University of Cheikh Anta Diop, BP 5005 Dakar Fann, Senegal
2
IMCCE, Observatoire de Paris, PSL Research University, CNRS UMR 8028, Sorbonne Université, Université de Lille, 77 av. Denfert-Rochereau, 75014 Paris, France
3
University of Antwerp, Physics Department, Groenenborgerlaan 171, Antwerpen B-2020, Belgium
4
KU Leuven, Institute of Astronomy, Celestijnenlaan 200D, Heverlee B-3001, Belgium
5
Vrije Universiteit Brussel – VUB, Department of Physics and Astronomy, Pleinlaan 2, Brussel B-1050, Belgium
6
Université de Toulouse, IRAP CNRS UPS, 14 Avenue Edouard Belin, Toulouse F-31400, France
7
Géosciences Environnement Toulouse UMR5563, CNRS, IRD & Université de Toulouse, 14 Avenue Edouard Belin, 31400 Toulouse, France
8
Université Félix Houphouët-Boigny, UFR Sciences de la Terre et des Ressources Minières Cocody, Abidjan, Côte d’Ivoire
9
LAM, Laboratoire d’Astrophysique de Marseille, 38 Rue Frédéric Joliot Curie, Marseille F-13013, France
10
GEOS (Groupe Européen d’Observations Stellaires), 23 Parc de Levesville, 28300 Bailleau l’Evêque, France
11
Oukaimeden Observatory, High Energy Physics and Astrophysics Laboratory, Cadi Ayyad University, Marrakech, Morocco
⋆ Corresponding author; This email address is being protected from spambots. You need JavaScript enabled to view it.
Received:
10
May
2024
Accepted:
24
August
2024
Abstract
Context. To date, puzzlingly few bona fide RR Lyrae stars have been identified in binaries. Binarity in pulsating stars can be revealed through well-timed photometric data over sufficiently long time bases because of the light travel time effect (LTTE) on the pulsations, which manifests as variation in the timings of maximum light in the O−C (observed minus calculated) diagram. However, O−C variations can also have other causes, such as the Blazhko effect or a sudden or gradual change in the main pulsation period.
Aims. We approach this challenge by disentangling the Blazhko effect and period changes from the potential LTTE on V1109 Cas, an RR Lyrae star suspected to be part of a binary system based on its O−C data in the GEOS database. In doing so, we aim to uncover the subtler signals indicative of a companion (LTTE).
Methods. We analysed nine years of ground-based photometric data, using Fourier analysis to model the pulsation modulated by the Blazhko effect. From the fit to the observed light curves, we constructed a refined O−C diagram without the scatter caused by Blazhko modulation. Subsequently, we considered different possible scenarios, because distinguishing intrinsic period changes or breaks from the LTTE is challenging.
Results. If the remaining O−C variation is due to a period break, refining the O−C diagram can almost entirely remove the trends. If we interpret the variation as an LTTE, we can consider possible configurations. While we currently favour a period break as the explanation for the residual O−C variations, more data on the star in the forthcoming years will help reveal whether the O−C variations are due to the LTTE or intrinsic period changes.
Conclusions. Our study, based on a detailed light-curve fitting of V1109 Cas, offers insights into the discernment between Blazhko modulation, intrinsic period breaks, and the LTTE in binary systems. Our results highlight the complexity of determining binarity from O−C data traditionally used for detecting binary motion, calling for caution in this process.
Key words: methods: data analysis / techniques: photometric / telescopes / surveys / binaries: general / stars: variables: RR Lyrae
© The Authors 2024
 Open Access article, published by EDP Sciences, under the terms of the Creative Commons Attribution License (https://creativecommons.org/licenses/by/4.0), which permits unrestricted use, distribution, and reproduction in any medium, provided the original work is properly cited.
This article is published in open access under the Subscribe to Open model. This email address is being protected from spambots. You need JavaScript enabled to view it. to support open access publication.
1. Introduction
Since their discovery at the end of the 19th century, RR Lyrae stars have played a crucial role in astrophysics. These evolved, low-mass, radially pulsating stars, initially called cluster variables given their high occurrence rates in globular clusters, are characterised by large amplitude variations of their luminosity (order 0.3−2 mag) with periods of between a few hours and about a day (Smith 1995). On the Hertzsprung-Russell diagram, RR Lyrae stars are positioned on the intersection of the horizontal branch with the instability strip. RR Lyrae pulsations are caused by the kappa-gamma mechanism, which involves the interaction between the opacity (kappa) and the temperature gradient (gamma) in the star’s outer layers. As the star expands, lower temperatures increase opacity, trapping radiation and causing radiative-pressure-driven expansion. This cyclic interaction drives the observed pulsations, characterised by a regular cycle of expansion and contraction, leading to changes in luminosity. The kappa-gamma mechanism relies on the interaction between variations in opacity and temperature gradient during the pulsation cycle.
RR Lyrae stars come in different subtypes. Most numerous are the fundamental-mode pulsators or RRab stars, which show longer periods (typically 0.3−1.0 days, but most of them above 0.45 days), peaked light curves, and larger amplitudes (typically 1 mag or more in V). The first-overtone pulsators or RRc stars have shorter periods (0.2−0.5 days), more sinusoidal light curves than the RRab stars, and smaller amplitudes, typically below 0.5 mag in the V filter. Finally, the Lyrae pulsators or RRd stars are rare and pulsate in the fundamental radial mode and the first overtone simultaneously.
Light curves of pulsating stars, and particularly of RR Lyrae stars, are usually characterised by the instant when the star is the brightest, at its maximum. Historically, RR Lyrae stars have often been studied through the so-called O−C (‘observed–calculated’) diagrams, in which the observed times of maximum are compared to the calculated times of maximum based on a reference epoch and a value of the pulsation period, assumed to be constant. However O−C diagrams can be constructed from timing (or phase) information of many different light-curve features, not only maxima. In this way, O−C variations reveal changes in the pulsation period. O−C diagrams have revealed that some RR Lyrae stars display period changes that are too sudden to be of evolutionary nature. Moreover, many RR Lyrae stars show continuous period variation resulting in a parabolic O−C curve, which is positive or negative depending on whether the period increases or decreases. All of these commonly observed intrinsic period changes (gradual increase, decrease) or period breaks (discontinuous period changes) can be studied through the O−C diagram.
About 50% of the fundamental-mode pulsators (RRab stars; Jurcsik 2009; Benkő et al. 2014) show a remarkable amplitude and/or phase modulation with a period of typically weeks to months, called the Blazhko effect (Blažko 1907). The modulation is also found in a smaller but considerable fraction of the first-overtone pulsators (RRc stars; around 10%, Netzel et al. 2018) and RRd stars (Soszyński et al. 2016). This modulation is mostly periodic but variations in the period of the Blazhko effect are seen in several well-studied stars (Kolenberg et al. 2006; LaCluyzé et al. 2004; Le Borgne et al. 2014).
In addition to causing variations in the amplitude of the light curve, the Blazhko effect often manifests itself as a phase modulation, because it causes the instantaneous period of the star to vary with an amplitude of up to several minutes across the Blazhko modulation cycle. Therefore, the Blazhko effect can also be detected in O−C variations, with the moment of maximum light occurring sometimes earlier and sometimes later than the calculated time of maximum based on the mean period of the star.
Finally, there is yet another cause of variations in the O−C diagram: a light travel time effect (LTTE) in a binary system can also affect the observed timings of maximum light (Woltjer 1922; Irwin 1952). The LTTE is the modulation of the light curves induced by the changing distance between the observer and the pulsating component in a binary system due to its motion around the centre of mass (Hajdu et al. 2021). In principle, the LTTE in a binary system should be detectable in the O−C diagrams of an RR Lyrae star. While more than half of stars are generally found in multiple systems, strikingly few of the many known RR Lyrae stars are known to be part of a multiple system (Liška et al. 2016a). Since RR Lyraes are evolved low-mass stars with ages above 10 Gyr, they have gone through a giant phase during which the star had a radius of a few astronomical units. If such a star is part of a binary system, it is unlikely that the companion star has an orbit that is smaller than the RR Lyrae star had when it was still in its giant phase. Therefore, due to their evolutionary path, the orbital periods of binaries containing a RR Lyrae star must be of the order of tens of years, and hence their detection is difficult. Given their distances, the probability of observing a binary system containing an RR Lyrae star without adaptive optics or interferometry is negligible. Very wide binaries can be detected as proper motion pairs with long orbital motions using Gaia data, even when the brightness ratios are of the same order of magnitude as those of RR Lyrae stars and their supposed companions, as shown by Kervella et al. (2019) with multiple probable detections. Since the start of the Gaia mission, the accuracy of the positions recorded at different dates has allowed proper-motion anomalies to be identified. Some of these anomalies can be interpreted as a motion of the star around the centre of mass in a binary system. Kervella et al. (2019) studied 198 RR Lyrae stars using Hipparcos and Gaia DR2 data: 13 of them show significant proper-motion anomalies.
The analysis of light curves can potentially reveal eclipsing binaries. However, considering the distance between the components, observing eclipse events is, in general, very unlikely. Generally, very few candidate RR Lyrae stars in eclipsing binary systems have been found, with a peculiar exception being the case of OGLE-BLG-RRLYR-02792, an entirely new kind of variable star, a so-called binary evolution pulsator (Pietrzyński et al. 2012).
The detection of a binary component in RR Lyrae stars can also be inferred from fluctuations in the mean radial velocity relative to the barycentre of the Solar System, known as the gamma velocity. This method has been employed in various research efforts, such as the study conducted by Barnes et al. (2021), to identify binary RR Lyrae systems. To derive binarity through radial velocity measurements, it is essential to undertake comprehensive time-series observations that span the entire pulsation period of the RR Lyrae star. This approach ensures the accurate calculation of the gamma velocity from the star’s radial-velocity curve. The necessity for detailed observations becomes particularly pronounced for stars exhibiting the Blazhko effect, which complicates the radial-velocity profile and consequently the determination of the gamma velocity.
The LTTE is the most widely used method for searching for binaries among the RR Lyrae stars. For a binary RR Lyrae star, the motion around the centre of mass causes changes in position that can be measured via the LTTE through the timing of the maximum of the light curves. If the pulsating star has a binary companion, the gravitational effects induce its centre to orbit around the centre of mass of the double system. We can define a vector joining the centre of mass to the centre of the pulsating star. The projection of this vector on the line of sight produces an orbital LTTE. As a consequence, the O−C values will vary periodically with orbital period T.
These periodic variations are often studied using O−C diagrams (Liska & Skarka 2015). The detailed methodology for this technique is described in Sections 3.2 and 3.4. A notorious star discovered through the LTTE is TU UMa, which is the best RR Lyrae star candidate known in a binary system (Saha & White 1990; Wade et al. 1999). The binarity of TU UMa was demonstrated using this method, with an orbital period of 23.3 years, a minimum mass of the companion of 0.33 solar masses, and an eccentricity of ≃0.7 (Liška et al. 2016b).
In recent decades, several stars showing such O−C variations have been investigated, yielding new candidate binary RR Lyrae stars. Hajdu et al. (2021) present 87 candidates for RR Lyrae variable stars in binary systems based on a new search using the LTTE and O−C diagrams in the Galactic bulge time-series photometry of the Optical Gravitational Lensing Experiment (OGLE). Of these, 61 are new candidates, while 26 have previously been reported (Hajdu et al. 2018). Analyses of the RR Lyrae light curves of the Kepler mission showed three additional possible binary candidates (Barnes et al. 2021; Li & Qian 2014).
In studies focusing on RR Lyrae stars within binary systems, the interpretation of O−C diagrams can be complicated by the presence of the Blazhko effect alongside intrinsic variations in the star’s period. It is essential to separate these contributions to accurately discern the binary system’s dynamics.
To simplify the analysis of the O−C data sets, the first studies that searched for orbital LTTEs looked at RR Lyrae stars that do not exhibit the Blazhko effect, and were carried out by, for example, Saha & White (1990) and Hajdu et al. (2015). In the present paper, we take this approach further and focus on a potential binary system RR Lyrae star, V1109 Cas, which also exhibits the Blazhko effect. The availability of more light-curve data for V1109 Cas enhances our capacity to dissect and understand the various factors contributing to its O−C variation behaviour.
2. Data
The star V1109 Cas (right ascension (RA) of  , declination (Dec) of
  ), has an apparent visual magnitude ranging from 12.67 to 13.47. The potential binarity of this star was revealed by its O−C variations from the GEOS RR Lyrae Survey (GRRS; Le Borgne et al. 2018). The GEOS RR Lyrae is a pivotal resource for researchers focusing on RR Lyrae stars, offering access to over 153 925 recorded maxima for 4185 stars. This extensive collection includes data derived from electronic, photographic, and visual observations of field RRab and RRc stars. The database facilitates comprehensive analyses by providing tools for examining O−C curves, bibliographies, and statistics on RR Lyrae maxima; it integrates with external astronomical catalogs and databases, enhancing the scope of research on phenomena such as period variations and the Blazhko effect (Le Borgne et al. 2007). Observational data on O−C times provide valuable insights into the pulsational properties of RR Lyrae stars, yet they capture only a limited aspect of the stellar variability. Therefore, we selected a star for which comprehensive photometric data are accessible in addition to the O−C information. As shown in Figure 1, the O−C diagram of V1109 Cas reveals deviations suggestive of binary characteristics. Yet, we also see clear indications of a Blazhko variability in the O−C diagram, leading to large scatter in the O−C diagram. The integration of detailed photometric observations allows us to delineate the Blazhko effect and identify potential disruptions in the periodicity of the star’s pulsation with more accuracy and to assess whether the star is part of a binary system, as its O−C diagram seems to suggest.
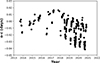 |
Fig. 1. Original O−C diagram of the suspected binary RR Lyrae star V1109 Cas from the GEOS database, based on a mean period of P0 = 0.436196000 days. |
In our investigation of the star, we utilised photometric data provided by Eric Denoux, a contributor to the GRRS (Le Borgne et al. 2018). The observations were conducted using a 25.4 cm Schmidt-Cassegrain telescope equipped with a SBIG ST-2000 XM CCD camera, which has a resolution of 1600 × 1200 pixels and a pixel size of 7.4 × 7.4 μm. To optimise the data capture, a 2 × 2 binning technique was employed during the recording process.
The observational dataset spans nine years, from 2013 to 2022. The recorded magnitudes are presented in differential magnitude units. The measurement timings, recorded initially in Julian days (JD) and ranging from 2456547.32592 to 2459843.69796, were converted to heliocentric Julian days (HJD) to account for the effect of the Earth’s motion.
3. Methodology
3.1. O–C diagram
According to a given pulsation period, P, one can index each time of maximum by an integer E, counting the number of maxima that have occurred since an initial heliocentric Julian date, HJD0. When a pulsating star beats regularly (i.e. when there is no Blazhko effect or other period variation), the instants of maximum light must adhere to the following law (Equation 1):
 (1)
(1)
where CE is the calculated time of the Eth maximum.
Consider an observation recorded at time HJD, the first step consists in determining the count E, the number of elapsed pulsation cycles since HJD0 (Equation (2)):
 (2)
(2)
where the ⌊⌉ symbol stands for ‘round to the nearest integer’. For a given E, the date of the observed maximum is OE and can be compared to the corresponding time CE calculated using Equation (1). A set of OE − CE is named O−C. If the star is pulsating regularly and the correct period P is known, all O−C sets should be equal to zero.
The Blazhko effect is defined as a modulation of the pulsating period that causes O−C to vary with the so-called Blazhko period, PB. Typical Blazhko periods, PB, lie between 10 and 500 days, with some stars showing modulation periods of thousands of days (Skarka et al. 2020), reaching into the realm of the expected binary periods. The Blazhko effect leads to magnitude changes at maximum brightness, whereas the induced magnitude changes at the minimum brightness are much smaller.
Periodic variations of the O−C values can be due to a Blazhko effect or to a LTTE or to a combination of the two effects (see Equation (A.5)). Moreover, the Blazhko effect has an O−C amplitude of the same order of magnitude as the suspected orbital LTTE.
Other effects are known to also produce variations of O−C with time. A regular increase or decrease in the pulsating period induces a parabolic behaviour of the O−C values and is observed in a significant fraction of stars (e.g. BN Aqr). Sudden changes of the pulsation period are sometimes observed when they induce O−C slope breaks (e.g. AV Dra). These two O−C diagram situations are illustrated in Figure 2. The two effects (period increase or decrease, and period break) are considered intrinsic to the RR Lyrae star, just like the Blazhko effect. Thus, if an RR Lyrae star in a binary system shows a Blazhko effect, a more careful analysis is needed to separate the two effects on the O−C diagram.
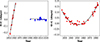 |
Fig. 2. O−C diagrams showing a period break with a sequence of linear fits for AV Dra (left) and parabolic behaviour with a parabolic fit for BN Aqr (right). We have removed the outliers between 1930 and 1940 on BN Aqr. |
Intrinsic pulsation period changes can resemble O−C variations due to a binary orbit and can mistakenly be interpreted as such. Even period breaks, although not smooth, can look like the signature of the LTTE for some geometrical configurations. Both period changes and period breaks lead to variations in the O−C diagrams, but these variations can be differentiated as shown in Figure 2. However, binary motion is periodic, and to confirm the LTTE, several authors take a few cycles to conclude the effect: see Hajdu et al. (2021) Section 3 and Skarka et al. (2020) section.
The classical O−C diagram, as defined in Equation (1), is based on just one mean pulsation period and does not take into account its periodic modulation due to the Blazhko effect. With the light curves of V1109 Cas at our disposal, we proceeded in two steps to refine the O−C diagrams as schematically shown in Figure 3. In the first step, we focused on the Blazhko effect by fitting the data with a mean pulsation period modulated by a Blazhko effect. With the reduced scatter in the O−C diagram after removing the Blazhko effect, we see a residual signal that could be due to the LTTE and/or intrinsic period changes (gradual or break). We investigate both scenarios in the second step.
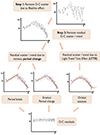 |
Fig. 3. Schematic overview of our methodology to determine refined O−C diagrams for the suspected binary RR Lyrae star V1109 Cas. |
3.2. Fourier analysis to account for the Blazhko modulation
To describe the variability, we employed a technique that involves fitting the light curves with a series of sinusoidal functions, governed by the following equation:
 (3)
(3)
where m(t) represents the magnitude as a function of time t, Ai denotes the amplitude associated with each frequency Fi, and Φi is the corresponding phase shift.
A Fourier fit for a Blazhko-modulated star encompasses the primary frequency, its harmonics, and often symmetrical multiplet patterns around these frequencies, indicative of the Blazhko effect. These multiplets frequently appear as triplets, with the spacing between the central frequency (main or harmonic) and the adjacent side-peaks equal to the Blazhko or modulation frequency. Accordingly, Equation (3) can be extended following the approach outlined by Kolenberg et al. (2011):
![Mathematical equation: $$ \begin{aligned} m(t) =&A_0 + \sum _{i = 1}^{n} \Bigl [A_i \sin \bigl (2\pi (k f_0 t + \phi _i)\bigr )\nonumber \\&+ A_i^{+} \sin \bigl (2\pi \bigl ((k f_0 + f_B)t + \phi _i^{+}\bigr )\bigr )\nonumber \\&+ A_i^{-} \sin \bigl (2\pi \bigl ((k f_0 - f_B)t + \phi _i^{-}\bigr )\bigr )\Bigr ]\nonumber \\&+ B_0 \sin \bigl (2\pi (f_B t + \phi _B)\bigr ). \end{aligned} $$](/articles/aa/full_html/2024/11/aa50674-24/aa50674-24-eq6.gif) (4)
(4)
The last term in this summation is included only if the Blazhko frequency can be directly detected in the data. This is not always the case; the Blazhko frequency is usually found indirectly through the side peaks in the Fourier spectrum.
The Fourier analysis of our dataset was performed using Period04, a software tool designed for the statistical evaluation of extensive astronomical time series; even those with unevenly spaced data points, as noted by Lenz & Breger (2014).
This initial analysis leads to the creation of a synthetic dataset that mirrors the observed pulsation patterns. It incorporates all detected frequencies linked to the stellar pulsation, including the fundamental frequency, its harmonics, and those attributable to the Blazhko effect. Thus, we model the star’s pulsation modulated by the Blazhko phenomenon.
3.3. Step 1: Refined O–C diagrams based on a constant mean pulsation period modulated due to the Blazhko effect
As a first step in our analysis, we fit the observed data assuming a mean pulsation period with Blazhko modulation, as in Equation (4). Our synthetic data set allows us to derive a refined version of the O−C diagram.
The peak times in the original data furnish the (O) values, while the maxima identified in the synthetic (model) light curve yield the (C) values. This process generates a sequence of (C) values derived from the synthetic fit that encapsulates every identified frequency, including those linked to the Blazhko modulation. We used Python routines to determine the times of maximum brightness for the original (O) or synthetic (C), fitting the data using a cubic spline function with a non-zero smoothing parameter developed by Le Borgne et al. (2007).
3.4. Step 2: Further refinement of the O–C diagrams for different scenarios
By segregating the influences of the Blazhko effect, we aim to clarify whether or not residual O−C discrepancies provide evidence of inherent pulsation period variations, such as a break or gradual change in the period, or of binarity. In our subsequent analysis, we consider each of these cases as a potential explanation for the remaining O−C variation. If the O−C variation is due to a LTTE, we can use the equations in Appendices A and B to determine the orbital solution and estimate the companion’s mass. To fit the orbital solution, we use a statistical method based on a five-dimensional grid varying the following orbital elements: the orbital period T, e, the longitude of the ascending node Ω, a1 ⋅ sin(i), and the date of periapsis (YearM0). We note that a1, the semi-major axis of the RR Lyrae star, is referenced with the centre of mass of the system. For each date of O−C, we compute the corresponding LTTE using the equations in Appendix A. The χ2 is computed as the weighted sum of squared deviations. The best solution is where χ2 is minimal.
4. Analysis and results
4.1. Initial O–C diagram
The O−C diagram based on the GEOS database, which is also shown in Figure 1, was determined using the following ephemerides:
 (5)
(5)
with CE the calculated time of the Eth maximum. Figure 1 shows a large scatter as well as a slightly upward trend followed by a downward trend. A repetitive pattern can be seen in the scatter between 2018 and 2021, reminiscent of the star’s Blazhko modulation.
4.2. Fourier analysis
We performed a Fourier analysis on the full light curves we have at our disposal for V1109 Cas, encompassing 13 809 data points, spanning from HJD 2456547.3269171 to HJD 2459843.6994033. Applying the method described in Section 3.2 to the star V1109 Cas, we converged to a fit to the data including 30 frequencies presented in Table 1: the main fundamental-mode frequency f0 = 2.2925357 ± 0.0000002 c/d, and its harmonics up to 15f0, and equidistant triplets around these frequencies with a spacing of fB = 0.005294 ± 0.000001 c/d corresponding to a Blazhko period of PB = 188.89 ± 0.07 d. The Blazhko frequency itself is also present in the data with a low but significant amplitude.
Result of the fit with 30 frequencies to the V data.
Figure 4 shows the fit we obtained to the data gathered by E. Denoux. It shows that the fit, including the Blazhko effect (red), takes into account and describes rather well the changes in amplitude, phase (timing of maximum), and light curve shape of the observed data. This is not the case for a fit without a Blazhko effect (blue).
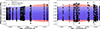 |
Fig. 4. Two subsets of the data (black) and the Fourier fits (red and blue) for the V1109 Cas observations, obtained by E. Denoux between 2013 and 2022. The blue fit only accounts for the mean period of the star and its harmonics, without modulation. The red fit takes into account the Blazhko modulation of the star, and fits the data better. |
4.3. Step 1: Refined O–C diagrams
Figure 5 shows a subset of our photometric data (in black) and the best fits without (in blue) and with the Blazhko effect (in red). The different fits show differences in O−C values of the order of several minutes. We constructed refined O−C diagrams based on a single mean period of pulsation modulated by the Blazhko effect, as described in Section 3.3. The lower left panel of Figure 6 demonstrates the value of adopting an alternative strategy to determine O−C values in the case of a Blazhko star. We see a significant reduction in the scatter of the O−C diagram when taking into account the phase modulation.
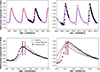 |
Fig. 5. Zoomed-in view of three pulsation periods (top) and one pulsation period (bottom), with the left and right panels showing two different sections of the light curve. The raw data are plotted in black. The fit without phase modulation is shown in blue, while the fit taking into account the Blazhko effect is shown in red. The vertical lines show the temporal shifts of the light maximum for the observations and for the two fits. The fit including the Blazhko effect is closer to the original data, explaining the reduction in scatter in the refined O−C diagram shown in Figure 6. |
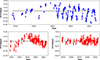 |
Fig. 6. O−C diagrams extracted from the Blazhko effect with a mean period (bottom left) using the method described in Section 3.2, and with a period break (bottom right) using the method described in Section 3.4. In the bottom left panel, we see a remaining variation that could be due to an orbit or an intrinsic period change. In the top panel, the blue colour represents the case where no Blazhko effect is extracted. |
The error bars depicted in Figure 6 stem from the sampling methodology outlined in Section 2.3 of Le Borgne et al. (2007). To get O−C data, the sampling process involves two consecutive exposures, each of 30 seconds, taken every 10 minutes within a window of 2 hours centred around the predicted peak time and extending 20 minutes beyond. On average, this results in an interval of 5.8 minutes between successive measurements. However, this nominal sampling regime may be affected by local factors like weather conditions or telescope operations. For well-covered maxima, the mean error bar is approximately 0.003 days, equivalent to 4.3 minutes, with typical error bars falling within the range of 0.002–0.010 days.
If the period changes caused by the Blazhko effect are properly taken into account, the difference in timing of maximum light between the original data (black dots) and the red fit, resulting in an O−C difference, will be due to the suspected orbital motion (LTTE) or intrinsic period changes (gradual or break).
4.4. Step 2: Further refining the O–C diagrams for different scenarios
In the left panel of Figure 6, we see a remaining variation that could be due to an intrinsic period change, such as a break or a gradual change, or to an orbit (LTTE).
4.4.1. Intrinsic period changes: Break or gradual change
After refining the O−C diagram on the basis of a mean pulsation period changed by the Blazhko effect, as shown in Figure 6, we noticed a possible break in the period around 2018. Therefore, we divided the data into two parts, and carried out a more detailed analysis of the light curves. A first part before 2018 extends from HJD 2456547.3269171 (September 11, 2013) to HJD 2458055.3275026 (October 28, 2017) corresponding to 2535 data points. A second part after 2018 extends from HJD 2458191.3920346 (March 13, 2018) to HJD 2459843.6994033 (September 21, 2022) corresponding to 11269 data points. The results of the fits are presented in Tables 2 and 3. We find periods of pulsation of 0.4362084 ± 0.0000002 days and 0.4361944 ± 0.0000004 days and modulation periods of PB = 187.0 ± 0.3 days and PB = 189.2 ± 0.1 days, respectively. The Blazhko frequency itself does not have a significant amplitude in the separate data sets.
Fit of a subset of V1109 Cas.
Fit of a subset of V1109 Cas.
The O−C diagram constructed on the basis of this period break as described in Section 3.3 and based on the sampling as described in Section 4.3 is shown in red in the right panel of Figure 6, with an error bar of 0.003 d. The period break removes the slopes in the O−C diagram, and what remains is a much smaller scatter around zero.
While the shape of the refined O−C diagram is indicative of a period break, we also investigated whether or not we could detect gradual period changes over the 9 years of observations. To determine this, we subdivided the data set into bins of 200 days, and performed Fourier analysis as in Equation (4) on the light curves in two consecutive intervals (400 days, covering more than two Blazhko periods) with a sliding window. This analysis was performed on 15 overlapping windows. The changes in pulsation period for subsequent windows were below the error bars of 0.0001 days, except for the location of the break. This led us to conclude that a period break is a more likely explanation for the shape of the refined O−C diagram than a gradual period change.
4.4.2. LTTE: Fitting the orbital solution
An alternative explanation for the remaining variation in the O−C diagram after subtraction of the Blazhko effect is the LTTE. Orbital motion would result in gradual apparent period changes, as the time between consecutive maxima will change periodically due to the varying light travel time. While the period break is a likely explanation for the observed shape of the refined O−C diagram (Figure 6), we consider an alternative interpretation of the O−C dispersion after extraction of the Blazhko effect, believing it to be due to an orbit for a specific configuration. We used the statistical method described in Section 3.4 to calculate the optimal orbital parameters based on the χ2 values. Table 4 lists the orbital elements, the minimum mass, and the semi-amplitude K calculated from the orbital parameters (Hajdu et al. 2021). Uncertainties are given at the 3σ level. The companion mass is deduced under the assumption that the RR Lyrae star has a mass of 0.63 M⊙ (Marsakov et al. 2019), as given in Table 4. Figure 7 displays the χ2 maps with the 3σ contours. Figure 8 shows the fit over the data without the Blazhko effect and the residuals after the subtraction of the orbit.
Orbital elements and mass derived from a fit to the O−C diagram after subtraction of the Blazhko effect.
5. Discussion
In the previous sections, we derive refined O−C diagrams taking into account the pulsation period changes induced by the Blazhko effect. From these refined diagrams, other causes for O−C variations can more easily be derived, such as period breaks, gradual period changes, and the LTTE.
As the Blazhko effect has an O−C amplitude of the same order of magnitude as the suspected orbital LTTE, we looked for ways to distinguish between the two effects. First, the LTTE does not significantly change the brightness at maximum light, while the Blazhko effect does. When only considering O−C data, the brightness at maximum light is not considered. Time-series photometry over a longer time base, however, allows us to distinguish this distinct feature of Blazhko modulation. Second, binary stars are generally not expected to have orbits closer than a distance corresponding to the RR Lyrae radius when it was a giant (i.e. a few astronomical units). Therefore, orbital periods are expected to be longer (years to decades, or even centuries) than typical Blazhko periods (weeks to months). Observations spanning more than a century can be necessary to uncover period changes or the LTTE. For the star DM Cyg, for example, the O−C diagram based on observations spanning one century revealed a steady period increase (Jurcsik et al. 2009). If this period increase were due to the LTTE, we would have to observe for even longer than a century to observe the expected subsequent period decrease.
For most studied modulated RR Lyrae stars, the available data are insufficient to perform a full light-curve analysis that allows us to mathematically model the Blazhko effect accurately. With only O−C data, as found in the GEOS RR Lyrae database, one can also derive (and subtract) a mean Blazhko period using phase dispersion minimisation methods. However, as the Blazhko effect is not always mono-periodic, and a subset of modulated stars also show period doubling (Kolenberg et al. 2010; Szabó et al. 2010) and Szabó et al. (2010), there is an advantage to the light-curve fitting as applied on V1109 Cas here.
For modulated stars with a changing Blazhko period and/or multiple Blazhko periods, applying this light-curve fitting method is more challenging and will require more data, but it will still yield a more accurate subtraction of the Blazhko effect than when only using the times of maximum (O−C data). The nine years of time-series photometry of the star V1109 Cas would not be sufficient to derive an accurate binary period on top of the Blazhko effect, but a detailed study of the refined O−C diagram could reveal which explanation is more likely for the O−C variations.
Our analysis reveals that a period break is a likely explanation for the O−C variations. We compared the O−C residuals using the standard deviation (sigma, σ) of the considered O−C diagrams of V1109 Cas taking into account different effects. Before the extraction of the O−C variations due the Blazhko effect, sigma is equal to 0.013 days (18 minutes). Subsequently, after subtracting the Blazhko effect, considering a mean pulsation period, the standard deviation amounts to 0.008 days (11 minutes). Taking into account a period break reduces the standard deviation to 0.006 days (8 minutes), as illustrated in Figure 6. The residual O−C dispersion can be due to various factors, including insufficiently modeled period changes or modulations. However, we do not see a clear remaining trend in the residual O−C diagram, which would be indicative of orbital motion. Thus, taking into account a period break removes the potential orbital signature from the O−C diagram.
However, orbital effects on the O−C diagram can resemble a period break for some geometrical configurations (Ω ≃ 90° or Ω ≃ 270° and e > 0.5). With more data, it will be possible to decipher whether the O−C variations are due to a period break or an orbit. In the scenario of an orbit, we expect to see repeating features, such as upward and downward trends in the O−C diagram, which would not be expected for a mere period break or change.
Intrinsic and sudden changes of the fundamental radial period of an RR Lyrae star must be due to structural changes in the star, particularly changes in its density distribution. The cause of such changes remains unknown, but observations seem to indicate that stars either show distinct period breaks, or more gradual period changes. In Section 4.4.2 and Figures 7 and 8 we demonstrate that, if we hypothetically simulate the possibility of an orbital solution instead of considering the period break, this can lead to conclusions in terms of an orbit. We obtain a rather eccentric orbit and minimum mass m2 of 0.43 M⊙ (see Table 4), a plausible value for an invisible companion, also from a stellar evolution point of view. However, this orbital solution does not reduce the dispersion of the O−C diagram as we obtain a slightly higher value of the standard deviation σ of 10 minutes. The period break method gives better results.
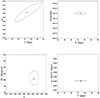 |
Fig. 7. χ2 maps with the 3σ contours of the orbital fit of V1109 Cas. See the description in Section 3.4. |
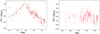 |
Fig. 8. O−C diagrams extracted from the orbital effect. Left: Initial O−C subtracted by the Blazhko effect showing only the LTTE (red) and the best orbit (green) as described in Section 4.4.2. Right: Residuals after subtraction of the best-fit orbit. |
Therefore, our results for the specific case of V1109 Cas show that the most likely interpretation of the dispersion of the O−C diagram after extraction of the Blazhko effect from the star V1109 Cas is a period break as shown in Figures 6 and 9. The period of pulsation found before the break is P = 0.4362084 ± 0.0000002 days and that after the break is P = 0.4361944 ± 0.0000004 days. The difference in period before and after the break is ΔP = 1.2 s.
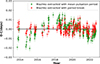 |
Fig. 9. Refined O−C diagram by extracting only the Blazhko effect (green) and extracting Blazhko effect and period break (red). For the period break, we used two different pulsation periods before and after the break to construct the refined O−C diagram (red). |
6. Summary and conclusions
In this work, we demonstrate how the Blazhko effect can be disentangled from potential period changes due to other aspects, namely either binary or intrinsic period breaks.
Puzzlingly few of the many detected RR Lyrae stars are known to have a stellar companion. The binarity of this class of pulsating stars is an elusive aspect of astrophysics due to the complexity of detecting companions to these evolved low-mass stars. Radial-velocity data of RR Lyrae stars gathered over sufficiently long periods are sparse and have only led to one bona fide candidate so far (Barnes et al. 2021).
However, binary RR Lyrae stars may be revealed through simple photometric data. The LTTE in a binary system should be detectable in the O−C (‘observed–calculated’) diagrams of the time of maximum light of an RR Lyrae star.
The O−C diagrams of RR Lyrae stars are also affected by intrinsic period changes (gradual increase, decrease), period breaks (discontinuous period changes), and, in many cases, a Blazhko effect, which is a periodic amplitude and phase (period) modulation of the light curve. These contributions have to be carefully disentangled in order to extract the binary motion.
The aim of this study is to analyse observational data obtained with small ground-based telescopes for a suspected RR Lyrae binary star. We separate the different contributions to the O−C variations. If binarity is a contributor, we can constrain the orbital parameters of the binary system. The star V1109 Cas, for which long time-series photometry is available, was selected to cover the largest possible fraction of the orbital period. To study the binarity of V1109 Cas, we analysed the O−C diagram. In a first step, we reduced the scatter on the O−C diagram caused by the Blazhko effect. Subsequently, we analysed the O−C residuals after subtracting the Blazhko effect. We considered two cases: a first solution that takes into account an intrinsic period break or gradual period change effect, and a second solution that stipulates an orbital effect due to the LTTE.
Our analysis reveals that, for the nine years of time-series photometric data of the candidate binary RR Lyrae star V1109 Cas, the dispersion of the O−C can be explained by the Blazhko effect and a period break without invoking binarity. Future photometric observations of the star could shed more light on its potential binary nature.
Our study highlights the importance of a detailed analysis of the light curves to discern the Blazhko effect and a period break from binarity, and calls for caution when interpreting O−C variations as signs of binarity. Our methodology can be further tested and applied to numerous other RR Lyrae stars showing O−C variations reminiscent of the LTTE in a binary orbit. Our study also demonstrates the usefulness of data gathered by both amateur and professional observers with small telescopes, and the benefits of Pro-Am collaborations. We call upon this prolific community to continue their efforts in observing RR Lyrae stars, and in particular stars showing O−C variations.
Acknowledgments
This work has been supported by grants from the French Embassy, the Ministry of Higher Education and Innovation of Senegal, the Organisation for Women and Science for the Developing World, and SIDCA (Swedish International Development Cooperation Agency). We also gratefully acknowledge the Flemish VLIR-UOS south initiative (SI-2019-01-95) and the Fonds Bruyns, and the support by the agreement of the Antwerp University Association with the City of Antwerp, in the framework of which exchange collaboration visits have been supported. We thank the observers from the GEOS RR Lyr Survey for their collaboration through the online database http://rr-lyr.irap.omp.eu/dbrr. We thank all the staff at the Oukaimeden Observatory in Morocco for their warm welcome.
References
- Barnes, T. G., III, Guggenberger, E., & Kolenberg, K. 2021, AJ, 162, 117 [Google Scholar]
- Benkő, J. M., Plachy, E., Szabó, R., Molnár, L., & Kolláth, Z. 2014, ApJS, 213, 31 [CrossRef] [Google Scholar]
- Blažko, S. 1907, Astron. Nachr., 175, 325 [Google Scholar]
- Hajdu, G., Catelan, M., Jurcsik, J., et al. 2015, MNRAS, 449, L113 [NASA ADS] [CrossRef] [Google Scholar]
- Hajdu, G., Catelan, M., Jurcsik, J., & Thompson, I. B. 2018, AIP Conf. Ser., 6, 248 [Google Scholar]
- Hajdu, G., Pietrzyński, G., Jurcsik, J., et al. 2021, ApJ, 915, 50 [NASA ADS] [CrossRef] [Google Scholar]
- Irwin, J. B. 1952, ApJ, 116, 211 [Google Scholar]
- Jurcsik, J. 2009, AIP Conf. Ser., 1170, 286 [NASA ADS] [CrossRef] [Google Scholar]
- Jurcsik, J., Hurta, Z., Sódor, Á., et al. 2009, MNRAS, 397, 350 [CrossRef] [Google Scholar]
- Kervella, P., Gallenne, A., Remage Evans, N., et al. 2019, A&A, 623, A116 [NASA ADS] [CrossRef] [EDP Sciences] [Google Scholar]
- Kolenberg, K., Smith, H. A., Gazeas, K. D., et al. 2006, A&A, 459, 577 [NASA ADS] [CrossRef] [EDP Sciences] [Google Scholar]
- Kolenberg, K., Szabó, R., Kurtz, D. W., et al. 2010, ApJ, 713, L198 [NASA ADS] [CrossRef] [Google Scholar]
- Kolenberg, K., Bryson, S., Szabó, R., et al. 2011, MNRAS, 411, 878 [NASA ADS] [CrossRef] [Google Scholar]
- LaCluyzé, A., Smith, H. A., Gill, E. M., et al. 2004, AJ, 127, 1653 [CrossRef] [Google Scholar]
- Le Borgne, J. F., Paschke, A., Vandenbroere, J., et al. 2007, A&A, 476, 307 [EDP Sciences] [Google Scholar]
- Le Borgne, J. F., Poretti, E., Klotz, A., et al. 2014, MNRAS, 441, 1435 [NASA ADS] [CrossRef] [Google Scholar]
- Le Borgne, J.-F., Poretti, E., & Klotz, A. 2018, AIP Conf. Ser., 6, 284 [Google Scholar]
- Lenz, P., & Breger, M. 2014, Astrophysics Source Code Library [record ascl:1407.009] [Google Scholar]
- Li, L. J., & Qian, S. B. 2014, MNRAS, 444, 600 [CrossRef] [Google Scholar]
- Liska, J., & Skarka, M. 2015, Open Eur. J. Var. Stars, 169, 38 [NASA ADS] [Google Scholar]
- Liška, J., Skarka, M., Zejda, M., Mikulášek, Z., & de Villiers, S. N. 2016a, MNRAS, 459, 4360 [NASA ADS] [CrossRef] [Google Scholar]
- Liška, J., Skarka, M., Mikulášek, Z., Zejda, M., & Chrastina, M. 2016b, A&A, 589, A94 [CrossRef] [EDP Sciences] [Google Scholar]
- Marsakov, V. A., Gozha, M. L., & Koval’, V. V. 2019, Astron. Rep., 63, 203 [NASA ADS] [CrossRef] [Google Scholar]
- Netzel, H., Smolec, R., Soszyński, I., & Udalski, A. 2018, MNRAS, 480, 1229 [NASA ADS] [Google Scholar]
- Pietrzyński, G., Thompson, I. B., Gieren, W., et al. 2012, Nature, 484, 75 [CrossRef] [Google Scholar]
- Saha, A., & White, R. E. 1990, PASP, 102, 148 [NASA ADS] [CrossRef] [Google Scholar]
- Skarka, M., Prudil, Z., & Jurcsik, J. 2020, MNRAS, 494, 1237 [NASA ADS] [CrossRef] [Google Scholar]
- Smith, H. A. 1995, Cambridge Astrophysics Series (Cambridge: Cambridge University Press) [Google Scholar]
- Soszyński, I., Smolec, R., Dziembowski, W. A., et al. 2016, MNRAS, 463, 1332 [Google Scholar]
- Szabó, R., Kolláth, Z., Molnár, L., et al. 2010, MNRAS, 409, 1244 [CrossRef] [Google Scholar]
- Wade, R. A., Donley, J., Fried, R., White, R. E., & Saha, A. 1999, AJ, 118, 2442 [NASA ADS] [CrossRef] [Google Scholar]
- Woltjer, J. 1922, Bull. Astron. Inst. Neth., 1, 93 [NASA ADS] [Google Scholar]
Appendix A: Orbital solution
Given Keplerian orbital parameters (a, T, e, Ω, i, and HJDperiapsis) at a given time, HJD, we computed the mean anomaly, M:
 (A.1)
(A.1)
The eccentric anomaly, u, was deduced by solving the Kepler equation
 (A.2)
(A.2)
The true anomaly, v, was calculated as
 (A.3)
(A.3)
Then we computed the light time travel. At a given HJD corresponding to a maximum observed OE, the LTT contribution is
 (A.4)
(A.4)
If a Blazhko effect occurs by the time shift of B, the OE will add a term to Eq. A.4:
 (A.5)
(A.5)
Appendix B: Mass determination
From a dataset of O-C versus time, considering an O-C variation due only to the LTTE, we can measure the orbital period, T, and the amplitude, Δt, of the LTTE of O-C along the period. The following formula gives a1, the semi-major axis of the RR Lyrae star with the centre of mass,
 (B.1)
(B.1)
where i is angle between the line of sight and the axis perpendicular to the orbital plane, and c is the light celerity.
The semi-major axis of the companion relative to the RR Lyrae star, a, is a = a1 + a2, where a2 is the semi-major axis of the companion with the centre of mass. From the equality a1 ⋅ m1 = a2 ⋅ m2 we can deduce a2 = a1 ⋅ m1/m2. Thus, a = a1 ⋅ (m1 + m2)/m2. The third Kepler’s law,
 (B.2)
(B.2)
combined with above relations gives the relation
 (B.3)
(B.3)
where fi is
 (B.4)
(B.4)
In the case sin(i) = 1 (i.e. the orbit is seen edge-on), the resolution of the third-order polynomial of Eq. B.3 gives the minimal mass of m2 (m1 is assumed and Δt is measured).
The general formula for calculating m2 if m1 and sin(i) are known is the mass function f(m):
 (B.5)
(B.5)
The companion mass was deduced, allowing us to hypothesise that RR Lyrae stars have a mass of 0.63 M⊙ (Marsakov et al. 2019).
All Tables
Orbital elements and mass derived from a fit to the O−C diagram after subtraction of the Blazhko effect.
All Figures
|
Fig. 1. Original O−C diagram of the suspected binary RR Lyrae star V1109 Cas from the GEOS database, based on a mean period of P0 = 0.436196000 days. |
| In the text | |
|
Fig. 2. O−C diagrams showing a period break with a sequence of linear fits for AV Dra (left) and parabolic behaviour with a parabolic fit for BN Aqr (right). We have removed the outliers between 1930 and 1940 on BN Aqr. |
| In the text | |
|
Fig. 3. Schematic overview of our methodology to determine refined O−C diagrams for the suspected binary RR Lyrae star V1109 Cas. |
| In the text | |
|
Fig. 4. Two subsets of the data (black) and the Fourier fits (red and blue) for the V1109 Cas observations, obtained by E. Denoux between 2013 and 2022. The blue fit only accounts for the mean period of the star and its harmonics, without modulation. The red fit takes into account the Blazhko modulation of the star, and fits the data better. |
| In the text | |
|
Fig. 5. Zoomed-in view of three pulsation periods (top) and one pulsation period (bottom), with the left and right panels showing two different sections of the light curve. The raw data are plotted in black. The fit without phase modulation is shown in blue, while the fit taking into account the Blazhko effect is shown in red. The vertical lines show the temporal shifts of the light maximum for the observations and for the two fits. The fit including the Blazhko effect is closer to the original data, explaining the reduction in scatter in the refined O−C diagram shown in Figure 6. |
| In the text | |
|
Fig. 6. O−C diagrams extracted from the Blazhko effect with a mean period (bottom left) using the method described in Section 3.2, and with a period break (bottom right) using the method described in Section 3.4. In the bottom left panel, we see a remaining variation that could be due to an orbit or an intrinsic period change. In the top panel, the blue colour represents the case where no Blazhko effect is extracted. |
| In the text | |
|
Fig. 7. χ2 maps with the 3σ contours of the orbital fit of V1109 Cas. See the description in Section 3.4. |
| In the text | |
|
Fig. 8. O−C diagrams extracted from the orbital effect. Left: Initial O−C subtracted by the Blazhko effect showing only the LTTE (red) and the best orbit (green) as described in Section 4.4.2. Right: Residuals after subtraction of the best-fit orbit. |
| In the text | |
|
Fig. 9. Refined O−C diagram by extracting only the Blazhko effect (green) and extracting Blazhko effect and period break (red). For the period break, we used two different pulsation periods before and after the break to construct the refined O−C diagram (red). |
| In the text | |
Current usage metrics show cumulative count of Article Views (full-text article views including HTML views, PDF and ePub downloads, according to the available data) and Abstracts Views on Vision4Press platform.
Data correspond to usage on the plateform after 2015. The current usage metrics is available 48-96 hours after online publication and is updated daily on week days.
Initial download of the metrics may take a while.