Fig. 5.
Download original image
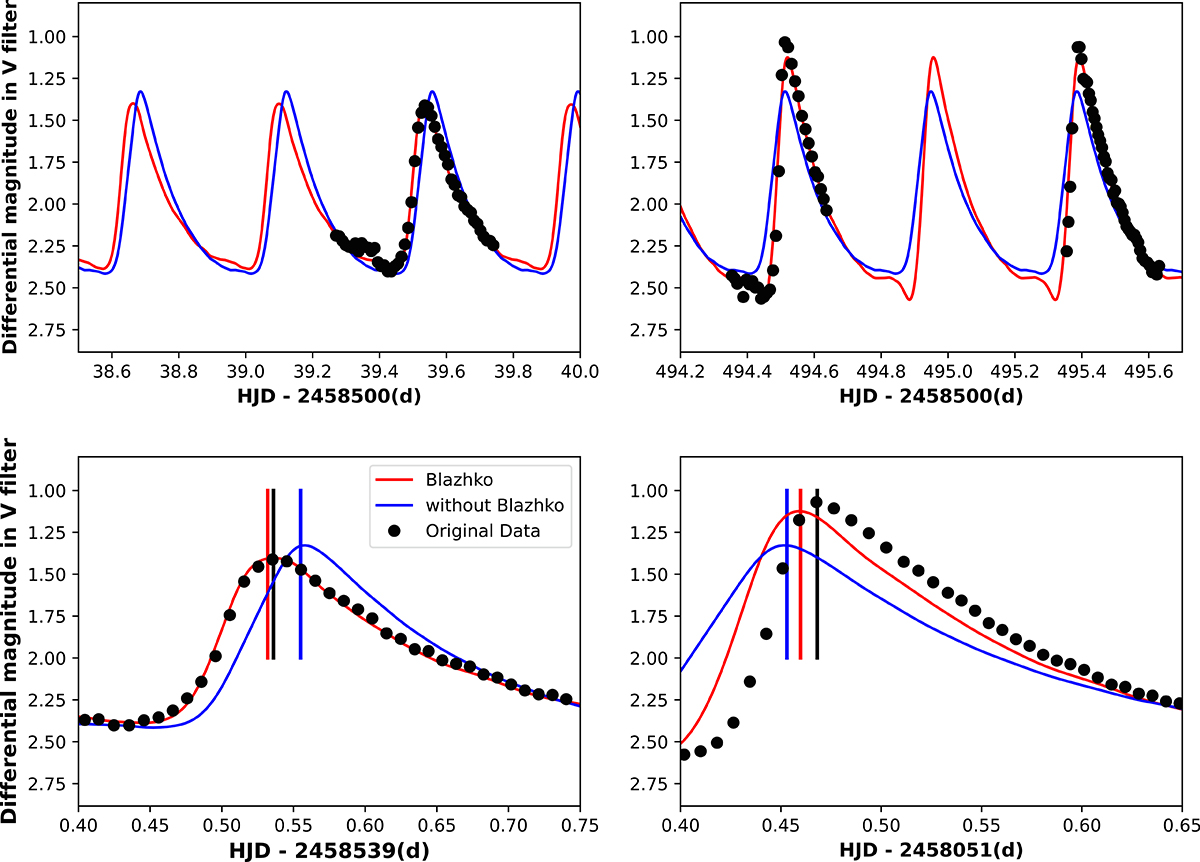
Zoomed-in view of three pulsation periods (top) and one pulsation period (bottom), with the left and right panels showing two different sections of the light curve. The raw data are plotted in black. The fit without phase modulation is shown in blue, while the fit taking into account the Blazhko effect is shown in red. The vertical lines show the temporal shifts of the light maximum for the observations and for the two fits. The fit including the Blazhko effect is closer to the original data, explaining the reduction in scatter in the refined O−C diagram shown in Figure 6.
Current usage metrics show cumulative count of Article Views (full-text article views including HTML views, PDF and ePub downloads, according to the available data) and Abstracts Views on Vision4Press platform.
Data correspond to usage on the plateform after 2015. The current usage metrics is available 48-96 hours after online publication and is updated daily on week days.
Initial download of the metrics may take a while.