Open Access
Fig. 9.
Download original image
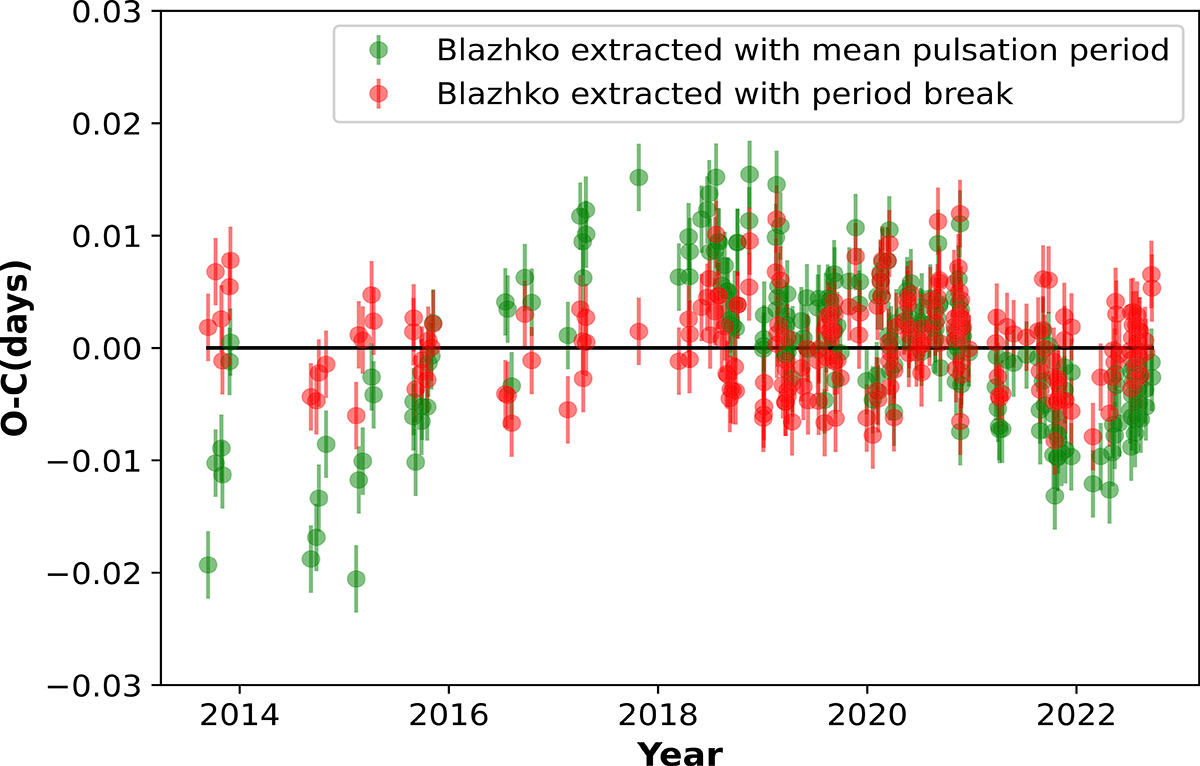
Refined O−C diagram by extracting only the Blazhko effect (green) and extracting Blazhko effect and period break (red). For the period break, we used two different pulsation periods before and after the break to construct the refined O−C diagram (red).
Current usage metrics show cumulative count of Article Views (full-text article views including HTML views, PDF and ePub downloads, according to the available data) and Abstracts Views on Vision4Press platform.
Data correspond to usage on the plateform after 2015. The current usage metrics is available 48-96 hours after online publication and is updated daily on week days.
Initial download of the metrics may take a while.