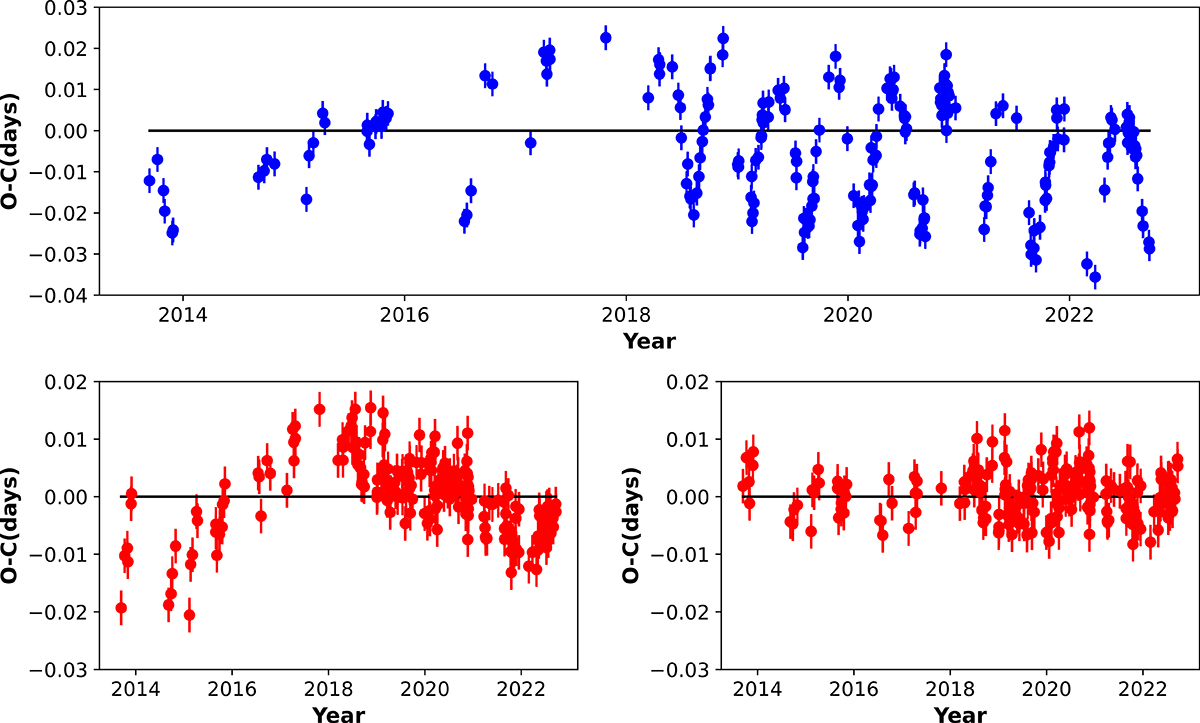
Fig. 6.
Download original image
O−C diagrams extracted from the Blazhko effect with a mean period (bottom left) using the method described in Section 3.2, and with a period break (bottom right) using the method described in Section 3.4. In the bottom left panel, we see a remaining variation that could be due to an orbit or an intrinsic period change. In the top panel, the blue colour represents the case where no Blazhko effect is extracted.
Current usage metrics show cumulative count of Article Views (full-text article views including HTML views, PDF and ePub downloads, according to the available data) and Abstracts Views on Vision4Press platform.
Data correspond to usage on the plateform after 2015. The current usage metrics is available 48-96 hours after online publication and is updated daily on week days.
Initial download of the metrics may take a while.