| Issue |
A&A
Volume 688, August 2024
|
|
|---|---|---|
| Article Number | A123 | |
| Number of page(s) | 13 | |
| Section | Astrophysical processes | |
| DOI | https://doi.org/10.1051/0004-6361/202449376 | |
| Published online | 13 August 2024 | |
The R-Process Alliance: Analysis of limited-r stars⋆
1
Zentrum für Astronomie der Universität Heidelberg, Landessternwarte, Königstuhl 12, 69117 Heidelberg, Germany
e-mail: This email address is being protected from spambots. You need JavaScript enabled to view it.
2
Department of Astronomy, Stockholm University, AlbaNova University Center, SE-106 91 Stockholm, Sweden
3
Department of Physics, University of Notre Dame, Notre Dame, IN 46556, USA
4
JINA Center for the Evolution of the Elements, USA
5
Department of Astronomy, University of Florida, 211 Bryant Space Science Center, Gainesville, FL 32601, USA
6
Department of Physics and Kavli Institute for Astrophysics and Space Research, Massachusetts Institute of Technology, Cambridge, MA 02139, USA
7
The Observatories of the Carnegie Institution for Science, 813 Santa Barbara St, Pasadena, CA 91101, USA
8
NSF’s NOIRLab, Tucson, AZ 85719, USA
9
Department of Physics, North Carolina State University, Raleigh, NC 27695, USA
10
Department of Physics & Astronomy, San Francisco State University, San Francisco, CA 94132, USA
11
Department of Astronomy and McDonald Observatory, The University of Texas, Austin, TX 78712, USA
Received:
29
January
2024
Accepted:
20
March
2024
Abstract
Context. In recent years, the R-Process Alliance (RPA) has conducted a successful search for stars that are enhanced in elements produced by the rapid neutron-capture (r-)process. In particular, the RPA has uncovered a number of stars that are strongly enriched in light r-process elements, such as Sr, Y, and Zr. These so-called limited-r stars were investigated to explore the astrophysical production site(s) of these elements.
Aims. We investigate the possible formation sites for light neutron-capture elements by deriving detailed abundances for neutron-capture elements from high-resolution spectra with a high signal-to-noise ratio of three limited-r stars.
Methods. We conducted a kinematic analysis and a 1D local thermodynamic equilibrium spectroscopic abundance analysis of three stars. Furthermore, we calculated the lanthanide mass fraction (XLa) of our stars and of limited-r stars from the literature.
Results. We found that the abundance pattern of neutron-capture elements of limited-r stars behaves differently depending on their [Ba/Eu] ratios, and we suggest that this should be taken into account in future investigations of their abundances. Furthermore, we found that the XLa of limited-r stars is lower than that of the kilonova AT2017gfo. The latter seems to be in the transition zone between limited-rXLa and that of r-I and r-II stars. Finally, we found that unlike r-I and r-II stars, the current sample of limited-r stars is largely born in the Galaxy and is not accreted.
Key words: stars: abundances / stars: chemically peculiar / stars: kinematics and dynamics / stars: Population II
Full Tables 4 and A.1 are available at the CDS via anonymous ftp to cdsarc.cds.unistra.fr (130.79.128.5) or via https://cdsarc.cds.unistra.fr/viz-bin/cat/J/A+A/688/A123
© The Authors 2024
 Open Access article, published by EDP Sciences, under the terms of the Creative Commons Attribution License (https://creativecommons.org/licenses/by/4.0), which permits unrestricted use, distribution, and reproduction in any medium, provided the original work is properly cited.
This article is published in open access under the Subscribe to Open model. This email address is being protected from spambots. You need JavaScript enabled to view it. to support open access publication.
1. Introduction
Since the pioneering work of Burbidge et al. (1957) and Cameron (1957), astronomers have known that elements beyond the iron peak are formed via the slow and rapid neutron-capture processes (s-process and r-process, respectively). However, the astrophysical site for the r-process is still highly debated. It has been hypothesized that two types of r-processes or two distinct sites may exist, differing by the available neutron flux. In the main r-process, all elements up to uranium can be produced, and in a neutron-starved, so-called limited r-process, only the lighter elements can be formed (up to ∼Ba) (Frebel 2018). This limited r-process, also referred to as the weak r-process (Hansen et al. 2012) or the light-element primary process (LEPP) (Travaglio et al. 2004), was introduced in order to explain the observed abundance distribution of light r-process elements (32 < Z < 56) in metal-poor stars, which differs from the behavior of the heavier elements.
The r-process-enhanced (RPE) stars are divided into two subcategories, namely r-I and r-II stars, for which +0.3 < [Eu/Fe] ≤ +0.7 and [Ba/Eu] < 0.0, and [Eu/Fe] > +0.7 and [Ba/Eu] < 0.0, respectively (Christlieb et al. 2004; Beers & Christlieb 2005; Holmbeck et al. 2020). Multiple studies have found that for the r-I and r-II stars, a remarkable match is seen between the abundances of the old metal-poor stars and the Sun for elements between the second and third r-process peaks (55 < Z < 73) (Sneden et al. 2008; Cowan et al. 2021). However, this universality does not extend to the lighter elements, where a larger scatter is seen. In particular, some stars display an enhancement in the light r-process elements compared to the heavy elements, which is evident when scaled to the Solar System r-process abundance pattern. These stars are characterized by the following abundance ratios: [Eu/Fe] < +0.3, [Sr/Ba] > +0.5 and [Sr/Eu] > 0.0, and they are called limited-r (rlim) stars (Frebel 2018).
The first star that was discovered to display this type of abundance pattern in its neutron-capture elements was HD 122563 (Sneden & Parthasarathy 1983; Honda et al. 2006, 2007). This star was found to exhibit an abundance pattern of neutron-capture elements that gradually decreases with growing atomic number. This was unlike any abundance pattern seen before, and it is dissimilar to the pattern seen in r-I and r-II stars. The main question astronomers have tried to answer since the discovery of this difference in r-process stars is whether the limited and main r-process components are the results of different events, or if they are the product of the same event for which different initial conditions or locations dictate the extent of the range of elements produced.
The community still speculates about the production sites of the r-process elements, with the exception of neutron star mergers (NSMs), which were confirmed as such after the observation of the kilonova (KN) AT2017gfo, which was the electromagnetic counterpart (Coulter et al. 2017) of the gravitational event GW170817 (Abbott et al. 2017a,b). Other candidate sites are collapsars (Siegel et al. 2019; Brauer et al. 2021), which are fast-rotating massive stars that end their lives as supernovae (SNe), magneto-rotational core-collapse supernovae (MR-SNe) (Winteler et al. 2012), and quark deconfinement SNe (Fischer et al. 2018, 2020). The two former sites can theoretically produce both the main and limited components of the r-process, whereas the latter is a candidate for a limited r-process. Specifically, Nishimura et al. (2017) found that core-collapse-SNe that are driven by magneto-rotational instability can produce a variety of r-process patterns that range from the limited-r to the solar r-process pattern, when neutrino heating and magnetic fields are similar.
To investigate the abundance signature of the limited-r neutron-capture elements and to thereby constrain the possible production sites for these elements, the R-Process Alliance (RPA) has included these stars in their search. The search also aims to identify highly r-process-enhanced stars. Following Frebel (2018), the RPA selected stars with [Eu/Fe] < +0.3, [Sr/Ba] > +0.5 and [Sr/Eu] > 0.0 as rlim; in the first four data releases, the RPA discovered 42 stars new rlim stars (Hansen et al. 2018; Sakari et al. 2018; Ezzeddine et al. 2020; Holmbeck et al. 2020). This paper reports the first detailed analysis of three of these rlim stars. The paper is organized as follows. In Sect. 2, we describe the observations of the stars, and in Sect. 3, we report the stellar parameters and determine the elemental abundances. The results are presented in Sect. 4. In Sect. 5, we discuss the possible birthplace of the rlim stars and whether NSMs could be the production site for the elements observed in the atmospheres of these stars.
2. Observations
Our sample stars listed in Table 1 were observed as part of the RPA survey for RPE stars. First, snapshot spectra were obtained (R ∼ 30 000 and a signal-to-noise ratio (S/N) ∼30 at 4100 Å; see Hansen et al. 2018 for details) and analyzed. Analyses of the snapshot spectra of J20313531−3127319 (J2031) and J21402305−1227035 (J2140) were published in Hansen et al. (2018) and Holmbeck et al. (2020), respectively, while this paper presents the first analysis of J00385967+2725516 (J0038). Following the analysis of the snapshot spectra, the three stars were selected as portrait candidates. Higher-resolution portrait spectra of J2031 and J2140 with a higher S/N were obtained with the Magellan Inamori Kyocera Echelle (MIKE) spectrograph (Bernstein et al. 2003) on the Magellan/Clay telescope at the Las Campanas Observatory in Chile in April 2019, while the portrait spectrum of J0038 was obtained with the TS23 echelle spectrograph (Tull et al. 1995) on the Harlan J. Smith 107 in (2.7 m) telescope at McDonald Observatory in August 2020. The MIKE spectra cover a wavelength range of 3350 Å–5000 Å in the blue and 4900 Å–9500 Å in the red. The observations were obtained with a 0.7 × 5.0″ slit and 2 × 2 binning, yielding a resolving power of R ∼ 37 000 and R ∼ 30 000 in the blue and red, respectively. The McDonald spectra cover a wavelength range from 3400 Å to 10 900 Åand were obtained with the 1.8″ slit and 1 × 1 binning. This yielded a resolving power of R ∼ 35 000. A snippet of all three spectra around 4500 Å is shown in Fig. 1. As depicted, the quality of our spectra is ideal for an accurate determination of the elemental abundances. The MIKE data were reduced with the Carnegie Python (CarPy) MIKE pipeline (Kelson et al. 2000; Kelson 2003), and the McDonald data were reduced using standard IRAF packages (Tody 1986, 1993), including correction for bias, flat field, and scattered light. Multiple spectra of the same star from different nights were subsequently coadded. Table 1 lists the stellar identification of the target (stellar ID), right ascension (RA), and declination (Dec), while Table 2 lists the heliocentric Julian date (HJD), exposure times, S/N per pixel, and heliocentric radial velocities for the spectra. The heliocentric radial velocities of the stars were determined via cross-correlation of the object spectra with spectra of the standard star HD 122563 (Vhelio = −26.13 km s−1; Gaia Collaboration 2018) obtained with the same instruments. Thirty-five orders were used for the cross-correlation of the McDonald spectrum, and fifty-five orders were used in the MIKE spectra. This resulted in the mean radial velocities and standard deviations listed in Table 2. The radial velocities of all three stars were reported in the literature. For J2031 and J2140, our velocities are consistent with previous measurements (J2031: −221.0 km s−1; Kunder et al. 2017, −222.5 km s−1; Hansen et al. 2018, and −221.1 km s−1; Steinmetz et al. 2020. J2140: −133.0 km s−1; Beers et al. 2017, and −130.4 km s−1; Gaia Collaboration 2018). For J0038, however, a velocity of −97.56 km s−1 was reported by Gaia Collaboration (2018), which is weaker in blueshift by ∼20 km s−1 than what we find it to be. This suggests that this star is part of a binary system. This assumption is supported by the fact that J0038 is included in the table of Gaia DR3 nonsingle stars (NSSs) nss_twobody_orbit (Halbwachs et al. 2023).
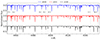 |
Fig. 1. Snippet of the spectra for our three stars. Stars are offset in the direction of the y-axis to avoid overlap. |
Basic data for the sample stars.
Observing log.
3. Stellar parameters and abundance analysis
We used the software smhr1 (Casey 2014; Ji et al. 2020) to normalize and then merge the orders of the echelle spectra. Then, we used it to fit Gaussians to measure the equivalent widths (EWs) of spectral absorption lines. Last, with smhr we derived the respective abundances from the curve of growth or from spectral synthesis via the 1D local thermodynamic equilibrium (LTE) radiative transfer code MOOG (Sneden 1973; Sobeck et al. 2011, 2017 version2).
The stellar parameters of effective temperature (Teff), surface gravity (log g), metallicity ([Fe/H]), and microturbulence (ξ) were determined following the procedure outlined in Roederer et al. (2018b). The Teff for the stars was determined photometrically, that is, from the colors listed in Table 1 using the color-temperature relations of Casagrande et al. (2010). They were dereddened using the Schlafly & Finkbeiner (2011) dust maps and extinction coefficients from McCall (2004). Furthermore, the log g was calculated using the following fundamental relation:

using Mbol, ⊙ = 4.75, log Teff, ⊙ = 3.7617, and log g⊙ = 4.438, and the parallaxes, ϖ, listed in Table 1. Finally, EW measurements of Fe I and Fe II lines were used to determine the metallicities and ξ. We adopted the [FeI/H] abundance as the model metallicity, and the value of ξ ensures that the Fe I abundances are independent of their respective reduced equivalent widths. The [FeI/H] and [FeII/H] abundances agree to within 0.03 dex for all three stars. The final stellar parameters for the stars, along with the associated uncertainties, are listed in Table 3. In Table 3, we list the combined systematic parameter uncertainties (see Roederer et al. 2018b for details) and statistical uncertainties arising from the scatter in individual Fe-line abundances.
Stellar parameters of the target stars.
Following the parameter determination, the elemental abundances were derived via EW analysis and spectral synthesis. We used α-enhanced ([α/Fe]= + 0.4) ATLAS9 model atmospheres (Castelli et al. 2003), and the solar abundances were taken from Asplund et al. (2009). The line lists we used for the analysis were generated from linemake3 (Placco et al. 2021), and they include isotopic and hyperfine structure broadening, where applicable, for which we employed the r-process isotope ratios from Sneden et al. (2008). Atomic data, EWs, and derived abundances for individual lines are listed in Table 4. The final abundances were determined as weighted averages of individual line abundances following Ji et al. (2020). We also followed the procedure outlined in Ji et al. (2020) to determine the abundance uncertainties by propagating through the stellar parameter uncertainties (see Table A.1).
4. Results
The abundances of 30 elements, including 10 neutron-capture elements, were determined for the three stars. The final abundances and associated uncertainties are listed in Table 5. In Table 6, we list the abundance ratios for the three stars associated with the rlim abundance criteria. Figure 2 compares the derived abundances for selected elements to those of normal Milky Way (MW) halo stars (black circles) from Roederer et al. (2014) and rlim stars (red stars) from the literature. The sample of literature rlim stars was compiled from the SAGA Database (Suda et al. 2008, 2011, 2017; Yamada et al. 2013), selected so that they fulfill the criteria of rlim stars (see Table 6). We only included stars that had measured abundances for all three elements (i.e., Sr, Ba and Eu) and excluded those for which only upper limits were available. The abundances from the following studies are included in Fig. 2: Barklem et al. (2005), Preston et al. (2006), François et al. (2007), Lai et al. (2008), Cohen et al. (2013), Ishigaki et al. (2013), Hansen et al. (2018), Sakari et al. (2018), Ezzeddine et al. (2020), Holmbeck et al. (2020).
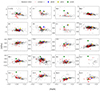 |
Fig. 2. Derived abundances for the three sample stars (blue, yellow, and green dots) compared to abundances of normal MW halo stars (black dots) from Roederer et al. (2014) and from the literature rlim stars (red stars). The error bars of our three stars, when not visible, are the size of the dots. |
Sample of line information.
Abundance table.
4.1. Light elements Li to Zn
We derived the abundances of elements from Li to Zn using a combination of EW and spectral synthesis analysis (see Table 4 for details of the individual lines). Figure 2 shows that the abundances derived for J0038 and J2031 generally follow the trends seen for other MW halo and rlim stars for the elements displayed, with the exception of O and K. On the other hand, J2140 generally exhibits higher abundances of the iron-peak elements Cr, Mn, Co, Ni, Cu, and Zn, as well as for O and K, similar to J0038 and J2031. This star is also enhanced in N and Na, suggesting that its chemical-enrichment history is different from typical MW halo stars and from that of the two other stars in our sample. Figure 2 shows that J2140 stands out from all other stars in their iron-peak and Na abundances. This is also very interesting considering that the α-element abundances of J2140 follow the trend of typical metal-poor MW halo stars, with the exception of O, which is somewhat higher.
In Fig. 3, we compare some spectral lines of Cr, Mn, Co, Ni, and Zn from J2140 to those of two other stars with similar stellar parameters in order to demonstrate the enhancement of these elements in this star. The comparison stars are CS 29502−092 and CS 22948−066, with stellar parameters Teff = 4820 ± 34 K, logg = 1.5 ± 0.14, and [Fe/H] = −3.2 ± 0.15, and Teff = 4830 ± 34 K, log g = 1.55 ± 0.15, and [Fe/H] = −3.18 ± 0.16, respectively (Roederer et al. 2014). The absolute abundances of these stars as reported by Roederer et al. (2014) are log ϵ(Cr I) = 2.19, log ϵ(Mn I) = 2.11, log ϵ(Ni I) = 3.21, log ϵ(Co I) = 1.73, log ϵ(Zn I) = 1.70 for CS 29502−092, and log ϵ(Cr I) = 1.82, log ϵ(Mn I) = 1.85, log ϵ(Ni I) = 2.86, log ϵ(CoI) = 1.67, log ϵ(Zn I) = 1.58 for CS 22948−066.
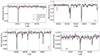 |
Fig. 3. Comparison of spectral lines between J2140 and stars CS 29502−092 and CS 22948−066. We show the spectral lines of Zn I at 4722.16 Å (top left panel), of Co I at 4118.77 Å and 4121.32 Å (top right panel), of Ni I and Cr I (bottom left panel) at 4604.99 Å and 4648.65 Å, and 4646.15 Å and 4651.28 Å, respectively, and of Mn I at 4754.04 Å (bottom right panel). |
We used the nonlocal thermodynamic equilibrium (NLTE) corrections from Bergemann et al. (2021) for O I and those from Andrievsky et al. (2010) for K I in order to assess whether the overabundances of these elements for all three stars are merely NLTE effects and not real enhancements. We repeated this for Cr I, Mn I, and Co I only for J2140 using the NLTE corrections from Bergemann & Cescutti (2010), Bergemann et al. (2019), and from Bergemann et al. (2010) with collisional data from Voronov et al. (2022), respectively. In the case of O I, the NLTE corrections for J0038 and J2031 are ∼ − 0.03 dex, whereas no correction arises for J2140. The NLTE corrections for K I are ∼ − 0.21 dex for J2140 and ∼ − 0.27 dex for J0038 and J2031. Concerning Cr I, Mn I, and Co I, the NLTE corrections for J2140 are ∼ + 0.55 dex, ∼ + 0.4 dex, and ∼ + 0.87 dex, respectively. Finally, after applying the evolutionary correction from Placco et al. (2014), J2140 has [C/Fe] = +1.05, which would classify it as a carbon-enhanced metal-poor (CEMP) star (Beers & Christlieb 2005; Aoki et al. 2007; Carollo et al. 2011; Norris et al. 2013).
4.2. Neutron-capture elements
We derived abundances of ten neutron-capture elements, specifically, Sr, Y, Zr, Ba, La, Nd, Eu, Dy, Er, and Yb, via spectral synthesis. The syntheses of neutron-capture element absorption features present in the spectra of the three stars are shown in Fig. 4. As demonstrated in Fig. 4, the spectral synthesis technique we employed can reproduce very well the observed single (Y II), blended (Zr II), and weak (Er II) lines. In Table 6, we list the [Eu/Fe], [Sr/Ba], and [Sr/Eu] ratios for the stars, along with the limits required for a rlim classification according to Frebel (2018). Two of our stars, J0038 and J2140, fulfill the criteria of rlim stars; [Eu/Fe] < +0.3, [Sr/Ba] > +0.5 and [Sr/Eu] > 0.0, while the [Eu/Fe] ratio of J2031 is too high and the [Sr/Eu] ratio is too low, and it can be classified as an r-I star. A somewhat cooler spectroscopic Teff of 4894 K and lower gravity of log g = 1.39 were derived in Hansen et al. (2018), likely resulting in the lower [Eu/Fe] abundances derived and in the subsequent rlim classification of this star. Its [Eu/Fe] = +0.3 abundance also barely qualify it for the r-I class, and it may therefore be useful for exploring the transition between the rlim and r-I regime.
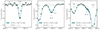 |
Fig. 4. Comparison of the synthesis and observed spectra (black dots) for an Y II line in J2031 (left panel), a Zr II line in J0038 (middle panel), and an Er II line in J2140 (right panel). The blue line is the best-fit synthesis, the blue band shows the uncertainty, and the dotted line is a synthesis without the given element. |
Limited-r classification criteria.
5. Discussion
5.1. r-process patterns for limited-r stars
The classical way to analyze the abundance patterns of RPE stars is to compare them to the scaled abundance pattern of the Solar System r-process because the pattern of heavy r-process elements (Ba to Hf) has many times been observed to exhibit a universality consistent with the scaled residual r-process solar pattern (Sneden et al. 2008; Cowan et al. 2021). However, as described in Sect. 1, when scaling to Eu, this universality does not extend to the light elements (32 < Z < 56), and it neither seems to apply to rlim stars such as HD 122563 (Honda et al. 2006, 2007). This suggests that a limited r-process or neutron-poor r-process could be in operation.
Recently, this picture has been challenged by the RPA by Roederer et al. (2022), who investigated the spread in the abundances of eight stars from the literature with varying r-process enrichment (−0.22 ≤ [Eu/Fe] ≤ +1.32). However, instead of scaling the full pattern to Eu, as is usually done, Roederer et al. (2022) scaled the light r-process elements (Se to Te) to Zr, and only the elements from Ba and up, to Eu. The authors found that even though the light r-process elements exhibit variations compared to the heavy elements, they are not entirely decoupled. Furthermore, by scaling to Zr, a universal pattern among the light r-process elements Se, Sr, Y, Zr, Nb, Mo, and Te appeared. However, for some elements, Ru, Rh, Pd, and Ag, the star-to-star scatter persisted. Roederer et al. (2023) investigated this scatter further and found that in RPE stars, the abundances of Ru, Rh, Pd, and Ag are correlated to those of heavy r-process elements with 63 ≤ Z ≤ 78. This is not observed for the neighboring elements with 34 ≤ Z ≤ 42 and 48 ≤ Z ≤ 68. In order to explain this finding, Roederer et al. (2023) proposed that these correlations appear due to fission-fragment depositions. Specifically, the authors assembled metal-poor stars from the literature with [Ba/Eu] < −0.3 to ensure that the r-process was the main channel of heavy-element production. They then constructed a pattern of the mean neutron-capture element abundances of stars with [Eu/Fe] ≤ +0.3, including the rlim star HD 122563. This so-called baseline pattern is assumed to represent an r-process without fission. Roederer et al. (2023) found that the r-process abundance variations in the other stars in the sample that have [Eu/Fe] > +0.3 can be explained by the coproduction of the r-process and fission-fragment depositions of transuranic nuclei, and that this mechanism alters the pattern not only around Ru – Ag, but also for the heavier elements in the regions 64 ≤ Z ≤ 78. This coproduction of certain light and heavy r-process elements was previously shown by Vassh et al. (2020). Vassh et al. (2020) applied the fission yields obtained with the finite-range liquid drop model (FRLDM) (Mumpower et al. 2020) on neutron-rich merger ejecta simulations and found that the late-time fission fragments are deposited in the region around Ru–Ag, leading up and into the lanthanides. This process influences the final abundance distribution in these regions most. Lemaître et al. (2021) also found that neutron-rich ejecta in NSMs produce fission fragments that contribute almost entirely to the final abundances of nuclei with 100 ≤ A ≤ 180 (Ru to and including the lanthanides). However, when the ejecta are less rich in neutrons and weak interactions are taken into account, Lemaître et al. (2021) found that the fission fragments deposit in the region A = 140 − 180, namely the lanthanides. Finally, it should be noted that the intermediate neutron-capture process (i-process; Cowan & Rose 1977) could also contribute to the abundances of the light neutron-capture elements with 32 ≤ Z ≤ 55 (Roederer et al. 2016).
Figure 5 compares the neutron-capture elemental abundances of our three stars with the baseline pattern from Roederer et al. (2023). In order to do this, we scaled the light r-process elements to Zr and the heavy ones, that is, Z ≥ 56, to Ba. We find that the abundance pattern for the rlim star J0038 (top panel) agrees very well with the baseline pattern. This suggests that this star could have been enriched by a similar r-process as r-I and r-II stars, but without fission-fragment deposition. The low [Ba/Eu] ratio for this star of −0.48 also agrees with that of the stars Roederer et al. (2023) used to construct the baseline pattern. J2031 (middle panel), which is an r-I star, matches the baseline pattern reasonably well for the light elements (Sr, Y, Zr), but appears to be more enhanced in some of the heavy elements. This suggests that it was enriched by an r-process that experienced some fission cycling. However, J2140 (bottom panel), which also fulfills the rlim abundance criteria (see Table 6), exhibits a somewhat higher Sr abundance and a much lower Eu abundance than indicated from the baseline pattern. This could suggest that the heavy elements present in the atmosphere of this star are the products of different or multiple nuclear processes. Since J2140 has [Ba/Eu] = −0.11, some contribution from the s-process is likely present, for example, from rotating massive stars (spin stars) (Meynet et al. 2006; Frischknecht et al. 2015; Limongi & Chieffi 2018). In the models of Frischknecht et al. (2015), spin stars can produce elements up to Ba, which are ejected via stellar winds, while the SN models of Limongi & Chieffi (2018) that include rotation find that heavier elements up to Pb can be produced. In principle, spin stars could also contribute to the Sr–Zr abundances we find for J0038 and J2031, but with their low [Ba/Eu] values (−0.48 and −0.62, respectively) and the good match to the baseline pattern for Sr–Zr, an r-process is more likely. However, the neutron-capture elements in the very old stars are probably formed through the r-process, as first suggested by Truran (1981).
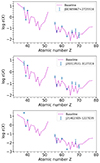 |
Fig. 5. Comparison to the baseline pattern. We plot the abundances of neutron-capture elements for stars J0038, J2031, and J2140 and overplot the scaled baseline pattern (Roederer et al. 2023). The light elements (Z < 56) are scaled to Zr, while the heavy (Z ≥ 56) elements are scaled to Ba. |
Based on this comparison, we suggest that in order to better study the rlim stars, [Ba/Eu] also need to be taken into account to be able to distinguish between stars that follow the baseline pattern and those that do not. In Fig. 6 we show the [Ba/Eu] ratios as a function of [Fe/H] for our sample stars and the literature rlim stars. Even though [Ba/Eu] has not been a selection criterion for the categorization of rlim stars so far, most of them in the literature have [Ba/Eu] < −0.3. Based on the good match between the abundance pattern of star J0038 and the baseline pattern and the lack of it for star J2140, our understanding of the formation of these elements would be helped by studying rlim stars in two regimes, that is [Ba/Eu] < −0.3 and ≥ − 0.3.
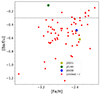 |
Fig. 6. [Ba/Eu] abundance ratios of our sample of stars and of rlim stars in the literature. The markers are the same as in Fig. 2. The dotted black line indicates [Ba/Eu] = −0.3. |
5.2. Lanthanide fractions
Since the rlim stars are selected to exhibit higher abundances in light r-process elements compared to the heavy ones, measuring and comparing the ratio of the bulk of light and heavy elements gives us some type of quantification of this overabundance, which can be useful for identifying the nucleosynthetic channel that causes the abundance signature of these stars. Because most of the heavy elements in RPE metal-poor stars that are easy to measure belong to the lanthanides, it is straightforward to use the lanthanide mass fraction of the stars in order to quantify the ratio of light to heavy elements. The lanthanide fraction (XLa) is the ratio of the mass of the elements belonging to the lanthanides to the mass of all other r-process elements.
The multimessenger observations of the gravitational wave event of the NSM GW170817 and its KN is the only evidence we have so far that r-process elements are being synthesized in such an event (Kasen et al. 2017; Perego et al. 2017; Drout et al. 2017; Rosswog et al. 2018). In addition, the lanthanide fraction of a KN is a measurable quantity because it directly affects the duration and shape of the KN light curve as well as the shape of its spectrum (Kasen et al. 2017). Ji et al. (2019) computed the XLa of r-process-dominated very metal-poor stars ([Fe/H] < −2.3 and [Ba/Eu] < −0.4) and compared them to the XLa of the KN AT2017gfo. They found that if this KN is a typical representative of an NSM, then these events cannot be the dominant r-process site because most r-I and r-II stars are richer in lanthanides than this specific KN.
We computed the XLa of our stars, as well as those of the rlim stars in the literature with abundances measured for Sr, Ba, and Eu at least. To do this, we followed Ji et al. (2019) and used the solar residual r-process abundances of Sneden et al. (2008). The XLa’s are shown in Fig. 7. This result exhibits a clear separation between rlim stars and the r-I and r-II star around the XLa value of the KN, which could suggest that the ratio of the light to heavy elements produced in this KN lies in the transition region from rlim to r-I, r-II stars. This is expected because by design, the selection criteria of rlim stars (Table 6) select stars with low lanthanide fractions. However, while the XLa of AT2017gfo might be a good match to rlim stars, the time delay of r-process element enrichment by NSMs might cause a problem. Figure 6 shows that almost all discovered and analyzed rlim stars have [Fe/H] < −2.0. This was previously discussed by Côté et al. (2019) and Holmbeck et al. (2020). Thus, due to the time delay in the onset of NSMs and the low metallicity of rlim stars, if they indeed bear the imprint of NSMs, they would need to have been born in an environment where star formation is inefficient, which in turn would allow the effects of this nucleosynthesis channel to be conspicuous. Recently, however, Kobayashi et al. (2023) showed that NSMs (including both neutron star (NS)–NS and NS–black hole (BH) mergers) can reproduce the evolutionary relations of [Eu/Fe] − [Fe/H] and [Eu/O] − [O/H] in the solar neighborhood when the delay-time distribution (DTD) between onset of star formation and merger is metallicity dependent. An alternative way to eliminate the problem of the time delay is to consider MR-SNe or collapsars as a significant source of r-process material in the early Universe. Ji et al. (2019) calculated theoretical log XLa values for collapsar models from Siegel et al. (2019) and MR-SN from Nishimura et al. (2015), finding values ranging from −1.60 to −2.81 and −0.77 to −1.94, respectively, which both overlap with the value derived for AT2017gfo. In the future, more model calculations and larger stellar samples from the RPA will help us to determine which sites are dominant. Finally, we note that there might be a bias in the sample of the rlim stars discovered to date because they were discovered in surveys aiming to find stars with [Fe/H] < −2.0.
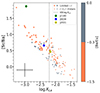 |
Fig. 7. Lanthanide fraction of our sample of stars and of the literature rlim, r-I, and r-II stars. The symbols are the same as in Fig. 2). The points are coral when [Ba/Eu] < −0.3 and gray when [Ba/Eu] ≥ −0.3. The dotted line is the lanthanide fraction of the KN of the neutron star merger GW170817 (Kilpatrick et al. 2017; Chornock et al. 2017; Tanaka et al. 2017; Tanvir et al. 2017; Troja et al. 2017). The error bar shows the mean uncertainty of the [Sr/Ba] abundances and the derived log XLas. |
5.3. Kinematics of limited-r stars
Previous studies have shown that a large fraction of r-II stars were likely born in smaller satellite systems and were accreted by the MW (Roederer et al. 2018a; Gudin et al. 2021; Shank et al. 2023). To investigate whether this is also the case for the rlim stars, we used Gaia DR3 radial velocities and proper motions (Gaia Collaboration 2023) and distances from Bailer-Jones et al. (2021) to study the kinematics of the rlim stars in our sample and in the literature. The orbits were then calculated with galpy4 (Bovy 2015). In order to estimate the uncertainties of the orbital parameters, we calculated 500 orbits for each star while varying the proper motions and radial velocities by sampling them from a Gaussian distribution. The distributions had as mean the actual values of the proper motions and radial velocities, while we used their uncertainties as sigma. Figure 8 shows the Toomre diagram, where we plot VLSR versus 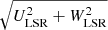 , which are the velocities with respect to the local standard of rest (LSR) in the Cartesian Galactic coordinate frame. As shown, all three stars from our study have retrograde orbits, suggesting they could have been accreted onto the MW from satellite galaxies. However, ∼65% of all the rlim stars are on prograde orbits. Moreover, 38% of the rlim stars have vtot < 220 km s−1, suggesting they may be consistent with disk stars. In addition, the rlim stars considered from the perspective of their [Ba/Eu] abundance ratio also appear to be different in the two groups. Most of the stars with [Ba/Eu] ≥ −0.3 are on prograde orbits. These findings differ from the findings of Roederer et al. (2018a) on the kinematics of 35 highly r-process-enhanced field stars (r-II for [Eu/Fe] > +0.7). Roederer et al. (2018a) showed that most if not all of the r-II stars were probably accreted by the MW from ultrafaint dwarf galaxies or low-luminosity dwarf spheroidal galaxies. The study of Roederer et al. (2018a) was extended to significantly larger samples by Gudin et al. (2021) (466 r-I and r-II stars) and Shank et al. (2023) (1720 stars). These studies confirmed the accreted nature of r-I and r-II stars. In particular, Shank et al. (2023) reported that only 17% of the r-I stars and 8% of the r-II stars have disk-like kinematics. With the use of an unsupervised learning algorithm, Shank et al. (2023) identified 36 chemo-dynamically tagged groups (CDTGs), and ∼1% of the r-I and r-II stars in their sample were identified as belonging to the metal-weak thick disk (MWTD), while ∼2.1% were traced as members of the splashed disk (SD). The SD is described as a part of the MW primordial disk that was kinematically heated by the Gaia-Sausage-Enceladus (GSE) merger event (Belokurov et al. 2018, 2020; Helmi et al. 2018; Di Matteo et al. 2019).
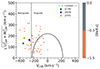 |
Fig. 8. Toomre diagram for the rlim stars. The velocities depicted were calculated with respect to the LSR. The points are designated as in Fig. 7. The dashed black line is VLSR = −233.1 km s−1 (McMillan 2016), and stars to the left of it are on retrograde orbits. The solid black line designates the area in which all stars have vtot < 220 km s−1, where |
We further examined the rlim stars that appear to be disk-like, that is, their  . Several studies (e.g., Beers et al. 2014; Sestito et al. 2019, 2020; Cordoni et al. 2020) used the maximum distance of the stars from the Galactic plane, Zmax, to separate disk from halo stars, often in combination with another orbital parameter. Cordoni et al. (2020) used Zmax and the eccentricity of the orbit, e, in order to identify disk stars. Specifically, they considered stars on prograde orbits with |Zmax|≤3 kpc and e < 0.75 to belong to the thick disk. In Fig. 9 we plot e versus Zmax of the disk-like rlim stars. Based on these criteria, it appears that ∼39% of the disk-like rlim stars belong to the MWTD, which is ∼15% of all the identified rlim stars (7 stars) to date. Another route to identify disk stars was introduced by Haywood et al. (2018), who studied stars with high transverse velocities (vt > 200 km s−1), and used a Zmax − Rmax plane, where Rmax is the apocenter of the orbit projected on the Galactic plane, and discrete wedges appeared. These wedges were also clearly visible in the distribution of the angles arctan(Zmax/Rmax). Recently, Hong et al. (2024) followed Haywood et al. (2018) and assigned ranges to the inclination angle (IA) – IA = arctan(Zmax/Rmax) to distinguish thin- and thick-disk and halo stars. Specifically, they identified stars on prograde orbits as being members of the disk if |Zmax|≤3 kpc, or IA ≤ 0.65. The results following this selection procedure are presented in Fig. 10. The use of the IA doubles the percentage of rlim disk stars from ∼15% to ∼30% (14 stars). However, 5 out of the 14 stars with these criteria are identified as thin-disk stars (IA ≤ 0.25), while the rest are attributed to the MWTD 0.25 < IA ≤ 0.65. The significant difference between the rlim and r-I, r-II stars from the aspect of disk membership still remains, considering that even though Shank et al. (2023) found 17% of the r-I stars to have disk-like kinematics, only ∼1% of the r-I and r-II stars could be chemo-dynamically traced back to the MWTD.
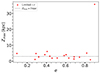 |
Fig. 9. Eccentricity vs. Zmax of the disk-like rlim stars. The dotted black line designates Zmax = 3 kpc. Stars that have Zmax < 3 kpc and e ≤ 0.75 are very likely MWTD stars (Cordoni et al. 2020). The star with the highest eccentricity, e > 0.9, also has the largest Zmax > 30 kpc. |
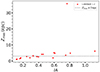 |
Fig. 10. Inclination angle vs. Zmax of the disk-like rlim stars. As in Fig. 9, the dotted black line designates Zmax = 3 kpc. Stars that have Zmax < 3 kpc or 0.25 < IA ≤ 0.65 are very likely thick-disk stars, and those with IA ≤ 0.25 are probably thin-disk members (Hong et al. 2024). The IA is in radians. |
Finally, as our three sample stars all have retrograde orbits, which might indicate that they are accreted by the MW from a satellite galaxy, we investigated their possible association with known structures. The Gaia mission (Gaia Collaboration 2016) has provided astrometric information for more than a billion stars so far, enabling astronomers to unravel parts of the hierarchical assembly history of the MW (Helmi 2020). In this context, several accretion events have been identified. However, no definitive way for selecting members of an accretion event exists so far, in the sense that different kinematic or dynamic selection criteria from different studies can favor different stars as members of the same event, with a significant overlap. Gudin et al. (2021) found that 20% of the r-I and r-II stars are connected to the GSE event, while Shank et al. (2023) reported that 9% of their sample stars were associated with this event. We used the dynamic selection criteria from Myeong et al. (2019) and Feuillet et al. (2021) for the GSE and Sequoia (Myeong et al. 2019) accretion events. The dynamic criteria of Myeong et al. (2019) are −0.07 < Jϕ/Jtot < 0.07 and −1.0 < (Jz − JR)/Jtot < −0.3 for the GSE event and −1.0 < Jϕ/Jtot < −0.5 and −1.0 < (Jz − JR)/Jtot < 0.1 for the Sequoia event. Those from Feuillet et al. (2021) are −500 ≤ Lz ≤ 500 and  , and −1.0 < Jϕ/Jtot < −0.4 and −1.0 < (Jz − JR)/Jtot < 0.1 for the GSE and Sequoia events, respectively. According to these criteria, star J2140 was probably accreted during the Sequoia accretion event. In total, two rlim stars seem to be accreted from Gaia Sequoia, while two to four others were accreted from GSE, depending on the selection criteria. Cumulatively, we find 4–9% for the rlim stars associated with the GSE, depending on the dynamic criteria employed. The results are shown in Table A.2.
6. Summary
We studied a sample of three r-process stars that were observed by the RPA and were classified as rlim stars. With the updated stellar parameters used for this study, one of the stars, J2031, is an r-I star, while the other two, J0038 and J2140, qualify as rlim stars. The abundances of non-neutron-capture elements for J0038 and J2031 resemble those of normal MW halo stars, while J2140 exhibits higher abundances of the iron-peak elements Cr, Mn, Co, Ni, Cu, and Zn and is also enhanced in C, N and Na. This suggests that it underwent a different chemical-enrichment history than stars J0038, J2031, and other typical MW halo stars.
We compared the neutron-capture element abundance patterns of our stars to the baseline pattern of Roederer et al. (2023). For the two rlim stars we find that the pattern of J0038, which has [Ba/Eu] < −0.3, agrees very well with the pattern, while that of J2140, which has [Ba/Eu] > −0.3, does not. This implies that rlim stars with [Ba/Eu]< − 0.3 have been enriched by an r-process similar to that which enriched r-I and r-II stars, while another or multiple nuclear processes caused the abundance pattern seen in rlim stars with [Ba/Eu] ≥ −0.3. Furthermore, the comparison of the r-I star, J2031, with the baseline pattern suggests that the abundances of this star have been affected by fission-fragment deposition.
Next, we calculated XLa of our stars, as well as those of the rlim stars in the literature. We compared it to that of the KN of the NSM GW170817. We find that the XLa of the KN is in the transition region between rlim stars and r-I, r-II stars. This could suggest that NSMs such as GW170817 could be the r-process site that causes the abundance signatures observed in rlim stars. However, because we do not know the time delay between NSMs and the onset of star formation, it is important to assess whether the rlim stars could have been accreted onto the MW from an environment with a low star-formation rate. To investigate this, we studied the kinematics of the rlim stars. We find that unlike r-I and r-II stars that were mostly accreted (Gudin et al. 2021), 65% of rlim stars are on prograde orbits, suggesting they were probably born in situ. Furthermore, 38% of the rlim stars present disk-like kinematics, which conveys another distinct difference between these and r-I, r-II stars, as reported by Shank et al. (2023), who find that 17% of the r-I stars and 8% of the r-II stars have such kinematics. Last, we find that 15% of the rlim stars are simultaneously on prograde orbits, have Zmax ≤ 3 kpc, and have e ≤ 0.75, indicating that they belong to the MWTD, unlike the r-I, r-II stars, only ∼1% of which were chemo-dynamically attributed to the MWTD (Shank et al. 2023).
The discovery and detailed abundance analysis of more rlim stars is vital to further explore the kinematic signature of these stars and assess the difference between those with [Ba/Eu] above and below −0.3. The measurement of additional neutron-capture elements for these stars will either reinforce the fact that the latter seems to have been enriched by an r-process similar to that enriching r-I and r-II stars or provide new insight. Future analysis of snapshot stellar spectra, already obtained by the RPA, is expected to double the number of identified rlim stars.
Acknowledgments
We thank the anonymous referee for helpful comments, which helped improve this manuscript. This work was funded by the Deutsche Forschungsgemeinschaft (DFG, German Research Foundation) – Project-ID 138713538 – SFB 881 (“The Milky Way System”, subproject A04). T.X. acknowledges support from the Heidelberg Graduate School for Physics (HGSFP). T.T.H. acknowledges support from the Swedish Research Council (VR 2021-05556). T.C.B. acknowledges partial support for this work from grant PHY 14-30152; Physics Frontier Center/JINA Center for the Evolution of the Elements (JINA-CEE), and OISE-1927130: The International Research Network for Nuclear Astrophysics (IReNA), awarded by the US National Science Foundation. R.E. acknowledges support from NSF grant AST-2206263. A.F. acknowledges support from NSF grants AST-1716251 and 2307436. The work of V.M.P. is supported by NOIRLab, which is managed by the Association of Universities for Research in Astronomy (AURA) under a cooperative agreement with the National Science Foundation. I.U.R. acknowledges support from the U.S. National Science Foundation (NSF), grants PHY 14-30152 (Physics Frontier Center/JINA-CEE), AST 1815403, and AST 2205847, as well as support from the NASA Astrophysics Data Analysis Program, grant 80NSSC21K0627. This paper includes data gathered with the 6.5 m Magellan Telescopes located at Las Campanas Observatory, Chile, and data taken at The McDonald Observatory of The University of Texas at Austin. This research made extensive use of the SIMBAD database operated at CDS, Strasbourg, France (Wenger et al. 2000), arXiv.org, and NASA’s Astrophysics Data System for bibliographic information.
References
- Abbott, B. P., Abbott, R., Abbott, T. D., et al. 2017a, Phys. Rev. Lett., 119, 161101 [Google Scholar]
- Abbott, B. P., Abbott, R., Abbott, T. D., Acernese, F., & South Africa/MeerKAT 2017b, ApJ, 848, L12 [NASA ADS] [CrossRef] [Google Scholar]
- Andrievsky, S. M., Spite, M., Korotin, S. A., et al. 2010, A&A, 509, A88 [NASA ADS] [CrossRef] [EDP Sciences] [Google Scholar]
- Aoki, W., Beers, T. C., Christlieb, N., et al. 2007, ApJ, 655, 492 [NASA ADS] [CrossRef] [Google Scholar]
- Asplund, M., Grevesse, N., Sauval, A. J., & Scott, P. 2009, ARA&A, 47, 481 [NASA ADS] [CrossRef] [Google Scholar]
- Bailer-Jones, C. A. L., Rybizki, J., Fouesneau, M., Mantelet, G., & Andrae, R. 2018, AJ, 156, 58 [Google Scholar]
- Bailer-Jones, C. A. L., Rybizki, J., Fouesneau, M., Demleitner, M., & Andrae, R. 2021, VizieR Online Data Catalog: I/352 [Google Scholar]
- Barklem, P. S., Christlieb, N., Beers, T. C., et al. 2005, A&A, 439, 129 [NASA ADS] [CrossRef] [EDP Sciences] [Google Scholar]
- Beers, T. C., & Christlieb, N. 2005, ARA&A, 43, 531 [NASA ADS] [CrossRef] [Google Scholar]
- Beers, T. C., Norris, J. E., Placco, V. M., et al. 2014, ApJ, 794, 58 [NASA ADS] [CrossRef] [Google Scholar]
- Beers, T. C., Placco, V. M., Carollo, D., et al. 2017, ApJ, 835, 81 [NASA ADS] [CrossRef] [Google Scholar]
- Belmonte, M. T., Pickering, J. C., Ruffoni, M. P., et al. 2017, ApJ, 848, 125 [NASA ADS] [CrossRef] [Google Scholar]
- Belokurov, V., Erkal, D., Evans, N. W., Koposov, S. E., & Deason, A. J. 2018, MNRAS, 478, 611 [Google Scholar]
- Belokurov, V., Sanders, J. L., Fattahi, A., et al. 2020, MNRAS, 494, 3880 [Google Scholar]
- Bergemann, M., & Cescutti, G. 2010, A&A, 522, A9 [NASA ADS] [CrossRef] [EDP Sciences] [Google Scholar]
- Bergemann, M., Pickering, J. C., & Gehren, T. 2010, MNRAS, 401, 1334 [CrossRef] [Google Scholar]
- Bergemann, M., Gallagher, A. J., Eitner, P., et al. 2019, A&A, 631, A80 [NASA ADS] [CrossRef] [EDP Sciences] [Google Scholar]
- Bergemann, M., Hoppe, R., Semenova, E., et al. 2021, MNRAS, 508, 2236 [NASA ADS] [CrossRef] [Google Scholar]
- Bernstein, R., Shectman, S. A., Gunnels, S. M., Mochnacki, S., & Athey, A. E. 2003, in Instrument Design and Performance for Optical/Infrared Ground-based Telescopes, eds. M. Iye, & A. F. M. Moorwood, SPIE Conf. Ser., 4841, 1694 [NASA ADS] [CrossRef] [Google Scholar]
- Biémont, É., Blagoev, K., Engström, L., et al. 2011, MNRAS, 414, 3350 [Google Scholar]
- Bovy, J. 2015, ApJS, 216, 29 [NASA ADS] [CrossRef] [Google Scholar]
- Brauer, K., Ji, A. P., Drout, M. R., & Frebel, A. 2021, ApJ, 915, 81 [NASA ADS] [CrossRef] [Google Scholar]
- Burbidge, E. M., Burbidge, G. R., Fowler, W. A., & Hoyle, F. 1957, Rev. Mod. Phys., 29, 547 [NASA ADS] [CrossRef] [Google Scholar]
- Cameron, A. G. W. 1957, PASP, 69, 201 [NASA ADS] [CrossRef] [Google Scholar]
- Carollo, D., Beers, T. C., Bovy, J., et al. 2011, ApJ, 744, 195 [Google Scholar]
- Casagrande, L., & VandenBerg, D. A. 2014, MNRAS, 444, 392 [Google Scholar]
- Casagrande, L., Ramírez, I., Meléndez, J., Bessell, M., & Asplund, M. 2010, A&A, 512, A54 [NASA ADS] [CrossRef] [EDP Sciences] [Google Scholar]
- Casey, A. R. 2014, PhD Thesis, Australian National Univ., Australia [Google Scholar]
- Castelli, F., & Kurucz, R. L. 2003, in Modelling of Stellar Atmospheres, eds. N. Piskunov, W. W. Weiss, & D. F. Gray, IAU Symp., 210, A20 [Google Scholar]
- Chornock, R., Berger, E., Kasen, D., et al. 2017, ApJ, 848, L19 [NASA ADS] [CrossRef] [Google Scholar]
- Christlieb, N., Beers, T. C., Barklem, P. S., et al. 2004, A&A, 428, 1027 [NASA ADS] [CrossRef] [EDP Sciences] [Google Scholar]
- Cohen, J. G., Christlieb, N., Thompson, I., et al. 2013, ApJ, 778, 56 [Google Scholar]
- Cordoni, G., Da Costa, G. S., Yong, D., et al. 2020, MNRAS, 503, 2539 [Google Scholar]
- Côté, B., Eichler, M., Arcones, A., et al. 2019, ApJ, 875, 106 [Google Scholar]
- Coulter, D. A., Foley, R. J., Kilpatrick, C. D., et al. 2017, Science, 358, 1556 [NASA ADS] [CrossRef] [Google Scholar]
- Cowan, J. J., & Rose, W. K. 1977, ApJ, 212, 149 [Google Scholar]
- Cowan, J. J., Sneden, C., Lawler, J. E., et al. 2021, Rev. Mod. Phys., 93 [CrossRef] [Google Scholar]
- Cutri, R. M., Skrutskie, M. F., van Dyk, S., et al. 2003, VizieR Online Data Catalog: II/246 [Google Scholar]
- Den Hartog, E. A., Lawler, J. E., Sneden, C., & Cowan, J. J. 2003, ApJS, 148, 543 [Google Scholar]
- Den Hartog, E. A., Lawler, J. E., Sobeck, J. S., Sneden, C., & Cowan, J. J. 2011, ApJS, 194, 35 [NASA ADS] [CrossRef] [Google Scholar]
- Den Hartog, E. A., Ruffoni, M. P., Lawler, J. E., et al. 2014, ApJS, 215, 23 [NASA ADS] [CrossRef] [Google Scholar]
- Den Hartog, E. A., Lawler, J. E., Sneden, C., Cowan, J. J., & Brukhovesky, A. 2019, ApJS, 243, 33 [NASA ADS] [CrossRef] [Google Scholar]
- Di Matteo, P., Haywood, M., Lehnert, M. D., et al. 2019, A&A, 632, A4 [NASA ADS] [CrossRef] [EDP Sciences] [Google Scholar]
- Drout, M. R., Piro, A. L., Shappee, B. J., et al. 2017, Science, 358, 1570 [NASA ADS] [CrossRef] [Google Scholar]
- Ezzeddine, R., Rasmussen, K., Frebel, A., et al. 2020, ApJ, 898, 150 [NASA ADS] [CrossRef] [Google Scholar]
- Feuillet, D. K., Sahlholdt, C. L., Feltzing, S., & Casagrande, L. 2021, MNRAS, 508, 1489 [NASA ADS] [CrossRef] [Google Scholar]
- Fischer, T., Bastian, N.-U. F., Wu, M.-R., et al. 2018, Nat. Astron., 2, 980 [NASA ADS] [CrossRef] [Google Scholar]
- Fischer, T., Wu, M.-R., Wehmeyer, B., et al. 2020, ApJ, 894, 9 [NASA ADS] [CrossRef] [Google Scholar]
- François, P., Depagne, E., Hill, V., et al. 2007, A&A, 476, 935 [Google Scholar]
- Frebel, A. 2018, Ann. Rev. Nucl. Part. Sci., 68, 237 [Google Scholar]
- Frischknecht, U., Hirschi, R., Pignatari, M., et al. 2015, MNRAS, 456, 1803 [Google Scholar]
- Gaia Collaboration (Prusti, T., et al.) 2016, A&A, 595, A1 [NASA ADS] [CrossRef] [EDP Sciences] [Google Scholar]
- Gaia Collaboration 2018, VizieR Online Data Catalog: I/345 [Google Scholar]
- Gaia Collaboration (Vallenari, A., et al.) 2023, A&A, 674, A1 [NASA ADS] [CrossRef] [EDP Sciences] [Google Scholar]
- Gudin, D., Shank, D., Beers, T. C., et al. 2021, ApJ, 908, 79 [NASA ADS] [CrossRef] [Google Scholar]
- Halbwachs, J.-L., Pourbaix, D., Arenou, F., et al. 2023, A&A, 674, A9 [NASA ADS] [CrossRef] [EDP Sciences] [Google Scholar]
- Hansen, C. J., Primas, F., Hartman, H., et al. 2012, A&A, 545, A31 [NASA ADS] [CrossRef] [EDP Sciences] [Google Scholar]
- Hansen, T. T., Holmbeck, E. M., Beers, T. C., et al. 2018, ApJ, 858, 92 [Google Scholar]
- Haywood, M., Di Matteo, P., Lehnert, M. D., et al. 2018, ApJ, 863, 113 [Google Scholar]
- Helmi, A. 2020, ARA&A, 58, 205 [Google Scholar]
- Helmi, A., Babusiaux, C., Koppelman, H. H., et al. 2018, Nature, 563, 85 [Google Scholar]
- Henden, A. A., Levine, S., Terrell, D., et al. 2018, Am. Astron. Soc. Meet. Abstr., 232, 223.06 [Google Scholar]
- Holmbeck, E. M., Hansen, T. T., Beers, T. C., et al. 2020, ApJS, 249, 30 [NASA ADS] [CrossRef] [Google Scholar]
- Honda, S., Aoki, W., Ishimaru, Y., Wanajo, S., & Ryan, S. G. 2006, ApJ, 643, 1180 [NASA ADS] [CrossRef] [Google Scholar]
- Honda, S., Aoki, W., Ishimaru, Y., & Wanajo, S. 2007, ApJ, 666, 1189 [NASA ADS] [CrossRef] [Google Scholar]
- Hong, J., Beers, T. C., Lee, Y. S., et al. 2024, ApJS, 273, 12 [NASA ADS] [CrossRef] [Google Scholar]
- Ishigaki, M. N., Aoki, W., & Chiba, M. 2013, ApJ, 771, 67 [NASA ADS] [CrossRef] [Google Scholar]
- Ivans, I. I., Simmerer, J., Sneden, C., et al. 2006, ApJ, 645, 613 [NASA ADS] [CrossRef] [Google Scholar]
- Ji, A. P., Drout, M. R., & Hansen, T. T. 2019, ApJ, 882, 40 [NASA ADS] [CrossRef] [Google Scholar]
- Ji, A. P., Li, T. S., Hansen, T. T., et al. 2020, AJ, 160, 181 [NASA ADS] [CrossRef] [Google Scholar]
- Kasen, D., Metzger, B., Barnes, J., Quataert, E., & Ramirez-Ruiz, E. 2017, Nature, 551, 80 [Google Scholar]
- Kelson, D. D. 2003, PASP, 115, 688 [NASA ADS] [CrossRef] [Google Scholar]
- Kelson, D. D., Illingworth, G. D., van Dokkum, P. G., & Franx, M. 2000, ApJ, 531, 184 [NASA ADS] [CrossRef] [Google Scholar]
- Kilpatrick, C. D., Foley, R. J., Kasen, D., et al. 2017, Science, 358, 1583 [NASA ADS] [CrossRef] [Google Scholar]
- Kobayashi, C., Mandel, I., Belczynski, K., et al. 2023, ApJ, 943, L12 [NASA ADS] [CrossRef] [Google Scholar]
- Kramida, A., & Ralchenko, Y. 1999, NIST Atomic Spectra Database, NIST Standard Reference Database 78 [Google Scholar]
- Kramida, A., Ralchenko, Y., Nave, G., & Reader, J. 2018a, 49th Annual Meeting of the APS Division of Atomic, Molecular and Optical Physics Meeting (College Park, MD: APS) M01.00004, http://meetings.aps.org/link/BAPS.2018.DAMOP.M01.4 [Google Scholar]
- Kramida, A., Ralchenko, Y., Reader, J., & NIST Atomic Spectra Database 2018b (ver. 5.5.6), Available: https://physics.nist.gov/asd National Institute of Standards and Technology, Gaithersburg, MD [Google Scholar]
- Kunder, A., Kordopatis, G., Steinmetz, M., et al. 2017, AJ, 153, 75 [Google Scholar]
- Kurucz, R., & Bell, B. 1995, Atomic Line List (Cambridge, MA: Smithsonian Astrophysical Observatory) [Google Scholar]
- Lai, D. K., Bolte, M., Johnson, J. A., et al. 2008, ApJ, 681, 1524 [NASA ADS] [CrossRef] [Google Scholar]
- Lawler, J. E., & Dakin, J. T. 1989, J. Opt. Soc. Am. B Opt. Phys., 6, 1457 [NASA ADS] [CrossRef] [Google Scholar]
- Lawler, J. E., Bonvallet, G., & Sneden, C. 2001a, ApJ, 556, 452 [NASA ADS] [CrossRef] [Google Scholar]
- Lawler, J. E., Wickliffe, M. E., Hartog, E. A. D., & Sneden, C. 2001b, ApJ, 563, 1075 [CrossRef] [Google Scholar]
- Lawler, J. E., Sneden, C., Cowan, J. J., et al. 2008, ApJS, 178, 71 [Google Scholar]
- Lawler, J. E., Guzman, A., Wood, M. P., Sneden, C., & Cowan, J. J. 2013, ApJS, 205, 11 [Google Scholar]
- Lawler, J. E., Wood, M. P., Hartog, E. A. D., et al. 2014, ApJS, 215, 20 [CrossRef] [Google Scholar]
- Lawler, J. E., Sneden, C., & Cowan, J. J. 2015, ApJS, 220, 13 [NASA ADS] [CrossRef] [Google Scholar]
- Lawler, J. E., Sneden, C., Nave, G., et al. 2017, ApJS, 228, 10 [CrossRef] [Google Scholar]
- Lemaître, J.-F., Goriely, S., Bauswein, A., & Janka, H.-T. 2021, Phys. Rev. C, 103, 025806 [CrossRef] [Google Scholar]
- Limongi, M., & Chieffi, A. 2018, ApJS, 237, 13 [NASA ADS] [CrossRef] [Google Scholar]
- Ljung, G., Nilsson, H., Asplund, M., & Johansson, S. 2006, A&A, 456, 1181 [NASA ADS] [CrossRef] [EDP Sciences] [Google Scholar]
- McCall, M. L. 2004, AJ, 128, 2144 [Google Scholar]
- McMillan, P. J. 2016, MNRAS, 465, 76 [Google Scholar]
- McWilliam, A. 1998, AJ, 115, 1640 [NASA ADS] [CrossRef] [Google Scholar]
- Meléndez, J., & Barbuy, B. 2009, A&A, 497, 611 [NASA ADS] [CrossRef] [EDP Sciences] [Google Scholar]
- Meynet, G., Ekström, S., & Maeder, A. 2006, A&A, 447, 623 [NASA ADS] [CrossRef] [EDP Sciences] [Google Scholar]
- Mumpower, M. R., Jaffke, P., Verriere, M., & Randrup, J. 2020, Phys. Rev. C, 101, 054607 [CrossRef] [Google Scholar]
- Myeong, G. C., Vasiliev, E., Iorio, G., Evans, N. W., & Belokurov, V. 2019, MNRAS, 488, 1235 [Google Scholar]
- Nishimura, N., Takiwaki, T., & Thielemann, F.-K. 2015, ApJ, 810, 109 [Google Scholar]
- Nishimura, N., Sawai, H., Takiwaki, T., Yamada, S., & Thielemann, F. K. 2017, ApJ, 836, L21 [CrossRef] [Google Scholar]
- Norris, J. E., Yong, D., Bessell, M. S., et al. 2013, ApJ, 762, 28 [NASA ADS] [CrossRef] [Google Scholar]
- O’Brian, T. R., Wickliffe, M. E., Lawler, J. E., Whaling, W., & Brault, J. W. 1991, J. Opt. Soc. Am. B Opt. Phys., 8, 1185 [Google Scholar]
- Pehlivan Rhodin, A., Belmonte, M. T., Engstrom, L., et al. 2017, MNRAS, 472, 337 [Google Scholar]
- Perego, A., Radice, D., & Bernuzzi, S. 2017, ApJ, 850, L37 [NASA ADS] [CrossRef] [Google Scholar]
- Pickering, J. C., Thorne, A. P., & Perez, R. 2001, ApJS, 132, 403 [Google Scholar]
- Pickering, J. C., Thorne, A. P., & Perez, R. 2002, ApJS, 138, 247 [NASA ADS] [CrossRef] [Google Scholar]
- Placco, V. M., Frebel, A., Beers, T. C., & Stancliffe, R. J. 2014, ApJ, 797, 21 [Google Scholar]
- Placco, V. M., Sneden, C., Roederer, I. U., et al. 2021, Res. Notes Am. Astron. Soc., 5, 92 [Google Scholar]
- Preston, G. W., Sneden, C., Thompson, I. B., Shectman, S. A., & Burley, G. S. 2006, AJ, 132, 85 [CrossRef] [Google Scholar]
- Roederer, I. U., & Lawler, J. E. 2012, ApJ, 750, 76 [NASA ADS] [CrossRef] [Google Scholar]
- Roederer, I. U., Lawler, J. E., Sneden, C., et al. 2008, ApJ, 675, 723 [Google Scholar]
- Roederer, I. U., Preston, G. W., Thompson, I. B., et al. 2014, AJ, 147, 136 [Google Scholar]
- Roederer, I. U., Karakas, A. I., Pignatari, M., & Herwig, F. 2016, ApJ, 821, 37 [Google Scholar]
- Roederer, I. U., Hattori, K., & Valluri, M. 2018a, AJ, 156, 179 [NASA ADS] [CrossRef] [Google Scholar]
- Roederer, I. U., Sakari, C. M., Placco, V. M., et al. 2018b, ApJ, 865, 129 [NASA ADS] [CrossRef] [Google Scholar]
- Roederer, I. U., Cowan, J. J., Pignatari, M., et al. 2022, ApJ, 936, 84 [CrossRef] [Google Scholar]
- Roederer, I. U., Vassh, N., Holmbeck, E. M., et al. 2023, Science, 382, 1177 [CrossRef] [PubMed] [Google Scholar]
- Rosswog, S., Sollerman, J., Feindt, U., et al. 2018, A&A, 615, A132 [NASA ADS] [CrossRef] [EDP Sciences] [Google Scholar]
- Ruffoni, M. P., Den Hartog, E. A., Lawler, J. E., et al. 2014, MNRAS, 441, 3127 [NASA ADS] [CrossRef] [Google Scholar]
- Sakari, C. M., Placco, V. M., Farrell, E. M., et al. 2018, ApJ, 868, 110 [Google Scholar]
- Schlafly, E. F., & Finkbeiner, D. P. 2011, ApJ, 737, 103 [Google Scholar]
- Sestito, F., Longeard, N., Martin, N. F., et al. 2019, MNRAS, 484, 2166 [NASA ADS] [CrossRef] [Google Scholar]
- Sestito, F., Buck, T., Starkenburg, E., et al. 2020, MNRAS, 500, 3750 [NASA ADS] [CrossRef] [Google Scholar]
- Shank, D., Beers, T. C., Placco, V. M., et al. 2023, ApJ, 943, 23 [NASA ADS] [CrossRef] [Google Scholar]
- Siegel, D. M., Barnes, J., & Metzger, B. D. 2019, Nature, 569, 241 [Google Scholar]
- Smith, V. V., Lambert, D. L., & Nissen, P. E. 1998, ApJ, 506, 405 [Google Scholar]
- Sneden, C. 1973, PhD Thesis, Univ. Texas, USA [Google Scholar]
- Sneden, C., & Parthasarathy, M. 1983, ApJ, 267, 757 [NASA ADS] [CrossRef] [Google Scholar]
- Sneden, C., Cowan, J. J., & Gallino, R. 2008, ARA&A, 46, 241 [Google Scholar]
- Sneden, C., Lawler, J. E., Cowan, J. J., Ivans, I. I., & Den Hartog, E. A. 2009, ApJS, 182, 80 [Google Scholar]
- Sobeck, J. S., Lawler, J. E., & Sneden, C. 2007, ApJ, 667, 1267 [NASA ADS] [CrossRef] [Google Scholar]
- Sobeck, J. S., Kraft, R. P., Sneden, C., et al. 2011, AJ, 141, 175 [NASA ADS] [CrossRef] [Google Scholar]
- Steinmetz, M., Guiglion, G., McMillan, P. J., et al. 2020, AJ, 160, 83 [NASA ADS] [CrossRef] [Google Scholar]
- Suda, T., Katsuta, Y., Yamada, S., et al. 2008, PASJ, 60, 1159 [NASA ADS] [Google Scholar]
- Suda, T., Yamada, S., Katsuta, Y., et al. 2011, MNRAS, 412, 843 [NASA ADS] [Google Scholar]
- Suda, T., Hidaka, J., Aoki, W., et al. 2017, PASJ, 69, 76 [Google Scholar]
- Tanaka, M., Utsumi, Y., Mazzali, P. A., et al. 2017, PASJ, 69, 102 [NASA ADS] [Google Scholar]
- Tanvir, N. R., Levan, A. J., González-Fernández, C., et al. 2017, ApJ, 848, L27 [CrossRef] [Google Scholar]
- Tody, D. 1986, in Instrumentation in Astronomy VI, ed. D. L. Crawford, SPIE Conf. Ser., 627, 733 [NASA ADS] [CrossRef] [Google Scholar]
- Tody, D. 1993, in Astronomical Data Analysis Software and Systems II, eds. R. J. Hanisch, R. J. V. Brissenden, & J. Barnes, ASP Conf. Ser., 52, 173 [Google Scholar]
- Travaglio, C., Gallino, R., Arnone, E., et al. 2004, ApJ, 601, 864 [Google Scholar]
- Troja, E., Piro, L., van Eerten, H., et al. 2017, Nature, 551, 71 [NASA ADS] [CrossRef] [Google Scholar]
- Truran, J. W. 1981, A&A, 97, 391 [NASA ADS] [Google Scholar]
- Tull, R. G., MacQueen, P. J., Sneden, C., & Lambert, D. L. 1995, PASP, 107, 251 [NASA ADS] [CrossRef] [Google Scholar]
- Vassh, N., Mumpower, M. R., McLaughlin, G. C., Sprouse, T. M., & Surman, R. 2020, ApJ, 896, 28 [CrossRef] [Google Scholar]
- Voronov, Y. V., Yakovleva, S. A., & Belyaev, A. K. 2022, ApJ, 926, 173 [NASA ADS] [CrossRef] [Google Scholar]
- Wenger, M., Ochsenbein, F., Egret, D., et al. 2000, A&AS, 143, 9 [NASA ADS] [CrossRef] [EDP Sciences] [Google Scholar]
- Wickliffe, M. E., Lawler, J. E., & Nave, G. 2000, J. Quant. Spectr. Rad. Transf., 66, 363 [CrossRef] [Google Scholar]
- Winteler, C., Käppeli, R., Perego, A., et al. 2012, ApJ, 750, L22 [Google Scholar]
- Wood, M. P., Lawler, J. E., Sneden, C., & Cowan, J. J. 2013, ApJS, 208, 27 [NASA ADS] [CrossRef] [Google Scholar]
- Wood, M. P., Lawler, J. E., Sneden, C., & Cowan, J. J. 2014, ApJS, 211, 20 [NASA ADS] [CrossRef] [Google Scholar]
- Yamada, S., Suda, T., Komiya, Y., Aoki, W., & Fujimoto, M. Y. 2013, MNRAS, 436, 1362 [Google Scholar]
- Yu, Y., & Derevianko, A. 2018, Atomic Data and Nuclear Data Tables, 119, 263 [NASA ADS] [CrossRef] [Google Scholar]
Appendix A: Additional tables.
We present a table showing the uncertainty arising in the abundance estimation from the uncertainty in the stellar parameter determination. Furthermore, a table contains information about the likely accreted rlim stars based on the dynamic selection criteria from Myeong et al. (2019) and Feuillet et al. (2021). Last, we include a table that lists the lanthanide fractions and the uncertainties that were computed for the rlim stars.
Uncertainties in the abundances determination due to the uncertainties in stellar parameters for star J0038.
Accreted rlim stars based on dynamic selection criteria.
Lanthanide mass fractions of rlim stars.
All Tables
Uncertainties in the abundances determination due to the uncertainties in stellar parameters for star J0038.
All Figures
|
Fig. 1. Snippet of the spectra for our three stars. Stars are offset in the direction of the y-axis to avoid overlap. |
| In the text | |
|
Fig. 2. Derived abundances for the three sample stars (blue, yellow, and green dots) compared to abundances of normal MW halo stars (black dots) from Roederer et al. (2014) and from the literature rlim stars (red stars). The error bars of our three stars, when not visible, are the size of the dots. |
| In the text | |
|
Fig. 3. Comparison of spectral lines between J2140 and stars CS 29502−092 and CS 22948−066. We show the spectral lines of Zn I at 4722.16 Å (top left panel), of Co I at 4118.77 Å and 4121.32 Å (top right panel), of Ni I and Cr I (bottom left panel) at 4604.99 Å and 4648.65 Å, and 4646.15 Å and 4651.28 Å, respectively, and of Mn I at 4754.04 Å (bottom right panel). |
| In the text | |
|
Fig. 4. Comparison of the synthesis and observed spectra (black dots) for an Y II line in J2031 (left panel), a Zr II line in J0038 (middle panel), and an Er II line in J2140 (right panel). The blue line is the best-fit synthesis, the blue band shows the uncertainty, and the dotted line is a synthesis without the given element. |
| In the text | |
|
Fig. 5. Comparison to the baseline pattern. We plot the abundances of neutron-capture elements for stars J0038, J2031, and J2140 and overplot the scaled baseline pattern (Roederer et al. 2023). The light elements (Z < 56) are scaled to Zr, while the heavy (Z ≥ 56) elements are scaled to Ba. |
| In the text | |
|
Fig. 6. [Ba/Eu] abundance ratios of our sample of stars and of rlim stars in the literature. The markers are the same as in Fig. 2. The dotted black line indicates [Ba/Eu] = −0.3. |
| In the text | |
|
Fig. 7. Lanthanide fraction of our sample of stars and of the literature rlim, r-I, and r-II stars. The symbols are the same as in Fig. 2). The points are coral when [Ba/Eu] < −0.3 and gray when [Ba/Eu] ≥ −0.3. The dotted line is the lanthanide fraction of the KN of the neutron star merger GW170817 (Kilpatrick et al. 2017; Chornock et al. 2017; Tanaka et al. 2017; Tanvir et al. 2017; Troja et al. 2017). The error bar shows the mean uncertainty of the [Sr/Ba] abundances and the derived log XLas. |
| In the text | |
|
Fig. 8. Toomre diagram for the rlim stars. The velocities depicted were calculated with respect to the LSR. The points are designated as in Fig. 7. The dashed black line is VLSR = −233.1 km s−1 (McMillan 2016), and stars to the left of it are on retrograde orbits. The solid black line designates the area in which all stars have vtot < 220 km s−1, where |
| In the text | |
|
Fig. 9. Eccentricity vs. Zmax of the disk-like rlim stars. The dotted black line designates Zmax = 3 kpc. Stars that have Zmax < 3 kpc and e ≤ 0.75 are very likely MWTD stars (Cordoni et al. 2020). The star with the highest eccentricity, e > 0.9, also has the largest Zmax > 30 kpc. |
| In the text | |
|
Fig. 10. Inclination angle vs. Zmax of the disk-like rlim stars. As in Fig. 9, the dotted black line designates Zmax = 3 kpc. Stars that have Zmax < 3 kpc or 0.25 < IA ≤ 0.65 are very likely thick-disk stars, and those with IA ≤ 0.25 are probably thin-disk members (Hong et al. 2024). The IA is in radians. |
| In the text | |
Current usage metrics show cumulative count of Article Views (full-text article views including HTML views, PDF and ePub downloads, according to the available data) and Abstracts Views on Vision4Press platform.
Data correspond to usage on the plateform after 2015. The current usage metrics is available 48-96 hours after online publication and is updated daily on week days.
Initial download of the metrics may take a while.