| Issue |
A&A
Volume 689, September 2024
|
|
|---|---|---|
| Article Number | A242 | |
| Number of page(s) | 13 | |
| Section | Stellar structure and evolution | |
| DOI | https://doi.org/10.1051/0004-6361/202449292 | |
| Published online | 20 September 2024 | |
Unified neutron star equations of state calibrated to nuclear properties
CFisUC, University of Coimbra, 3004-516 Coimbra, Portugal
Received:
19
January
2024
Accepted:
19
May
2024
Abstract
Context. Recently, a dataset of several equations of state (EOSs) for purely nucleonic stellar matter based on a nonlinear relativistic mean-field model prescription and constrained to properties of nuclear matter, state-of-the-art chiral effective-field theory calculations for low-density neutron matter, and astrophysical data were proposed.
Aims. In this work, 21 unified neutron star EOSs were chosen from that dataset in such a way that a large range of values of the slope of the symmetry energy at saturation is covered. Several quantities are calculated and discussed, such as the proton fraction and the direct Urca behavior, the density dependence of the speed of sound and the trace anomaly, the crust-core transition properties, the compatibility with astrophysical observations, and the neutron matter properties from chiral effective-field theory calculations and pQCD constraints.
Methods. We construct unified EOSs where the outer crust is given by the BSk22 functional and the inner crust is calculated from a compressible liquid drop approximation. The core is purely nucleonic; made of protons, neutrons, electrons, and muons; under charge neutrality; and in β-equilibrium conditions.
Results. The correlation of the slope of the symmetry energy at saturation with the crust-core transition density and proton fraction is analyzed, and equations that translate these relations are proposed. Moreover, the spectral representation for all the EOSs is given, which is a convenient representation to study quasi-periodic oscillations with realistic EOSs. We show that several of these EOSs have in the center of the most massive neutron star a speed of sound squared on the order of ≲0.5. Most of the EOSs predict a maximum central density on the order of about six times the nuclear saturation density. Three of the EOSs satisfy all of the constraints imposed. The 21 unified EOSs are available in the zenodo platform.
Key words: dense matter / equation of state / stars: neutron
Corresponding authors; This email address is being protected from spambots. You need JavaScript enabled to view it. ; This email address is being protected from spambots. You need JavaScript enabled to view it. ; This email address is being protected from spambots. You need JavaScript enabled to view it. .
© The Authors 2024
 Open Access article, published by EDP Sciences, under the terms of the Creative Commons Attribution License (https://creativecommons.org/licenses/by/4.0), which permits unrestricted use, distribution, and reproduction in any medium, provided the original work is properly cited.
This article is published in open access under the Subscribe to Open model. This email address is being protected from spambots. You need JavaScript enabled to view it. to support open access publication.
1. Introduction
The macro and microscopic properties of neutron stars (NSs) are still under study at present. However, with the current class of instrumentation, astrophysical measurements of both the mass and radius of pulsars (Riley et al. 2019; Miller et al. 2019, 2021; Riley et al. 2021; Raaijmakers et al. 2021) as well as the detection of gravitational wave (GW) signals from the merger of two NSs, such as GW170817 (Abbott et al. 2017a) or the GW190425 (Abbott et al. 2020), have been possible, and this has allowed the nuclear physics community working on the equation of state (EOS) for stellar matter to further constrain their calculations. Microscopic calculations, such as ab-initio neutron matter calculations from chiral effective-field theory (χEFT) models (Hebeler et al. 2013; Drischler et al. 2019, 2020) have also been used to constrain the nuclear matter EOS in the low-density regime, that is, at sub-saturation densities.
In the inner crust, heavy clusters (“nuclear pasta”) are expected to form due to the competition between the strong and Coulomb forces (Ravenhall et al. 1983). These geometries have an effect on the transport properties and cooling of the star because of the possible modification of the neutrino mean-free path (Arcones et al. 2008). This layer of the star plays a big role in the determination of the radius of the star (see, e.g., Pais & Providência 2016 or Fortin et al. 2016) since this quantity is affected by the determination of the crust-core transition. However, the nuclear clusters that form may pose a problem for its numerical calculation, so polytropic mechanisms that mimic the crust of the star, such as the one used in Carriere et al. (2003), Malik & Providência (2022), are often employed.
Another quantity associated with the inner crust and that has an effect not only on R but also on the slope of the symmetry energy, L, is the density at which the nuclear clusters melt and the core starts, which is composed of a homogeneous gas of protons, neutrons, and electrons and muons. This is called the crust-core transition density, ρt. Previous studies (see, e.g., Pais & Providência 2016; Ducoin et al. 2010; Newton et al. 2013; Providência et al. 2014) have observed an anticorrelation between this quantity and L. Other studies have also tested other correlations (and combinations of correlations) between nuclear matter parameters and EOS properties, such as ρt or the associated pressure, Pt (see, e.g., Ducoin et al. 2011 or Alam et al. 2016).
Apart from the numerical computation of the inner crust, the lack of knowledge of the nuclear EOS at high densities together with the fact that the whole range of the star spans several orders of magnitude in density makes the computation of a fully unified EOS a difficult task. Different prescriptions have been proposed to contour this problem, such as metamodeling techniques (Margueron et al. 2018a, 2018b; Ferreira et al. 2020; Xie & Li 2019, 2020; Ferreira & Providência 2021; Thi et al. 2021), which make a series expansion of the energy per nucleon to generate a realistic EOS, and nonparametric methods (Landry & Essick 2019; Essick et al. 2020; Gorda et al. 2022; Zhou et al. 2023), which infer the EOS directly from GW data. However, the NS composition is not determined within these kinds of methods.
The density dependence of the symmetry energy and its effect on the macroscopic properties of the star has been explored in several works (see, e.g., Pais & Providência 2016; Cavagnoli et al. 2011; Providencia & Rabhi 2013; Bao et al. 2014; Ji et al. 2019), where relativistic mean-field (RMF) models with nonlinear meson terms have been used. In particular, the larger the Λω parameter associated with the vector-isovector ωρ mixing term is, the smaller the symmetry energy at saturation (Cavagnoli et al. 2011). Moreover, it has been shown that there exists a correlation between the nonlinear vector meson ω term (ω4 term) and the macroscopic properties of the star, such as the radius (Fattoyev & Piekarewicz 2010). This term seems to also affect the speed of sound, and a correlation between this term and the symmetry energy has also been observed (Malik et al. 2023). The symmetry energy is known to play an important role in the composition of the star and, consequently, on the nucleonic direct Urca processes (Yakovlev et al. 2001; Yakovlev & Pethick 2004; Fortin et al. 2020; Providência et al. 2019). If the symmetry energy is very low, very asymmetric matter is favored, and this will not allow for such kinds of processes in the interior of the NS (see, e.g., Providência et al. 2023 and references therein).
The behavior of the speed of sound has also recently been used to check when other exotic degrees of freedom set in, such as hyperons (Malik & Providência 2022) or even deconfined quark matter (Annala et al. 2020; Altiparmak et al. 2022; Somasundaram et al. 2023a). Another quantity that has been used to test deconfinement is the trace anomaly, renormalized in Fujimoto et al. (2023) as Δ = 1/3 − P/ϵ, meaning that it should tend to zero in the conformal limit. In Annala et al. (2023), another related quantity was proposed based also on the speed of sound:  , where Δ′=cs2 (1/γ−1) is the logarithmic derivative of Δ with respect to the energy density, which should also approach zero in the conformal limit.
In this work, we present 21 unified nucleonic EOSs based on the RMF approach used in Malik et al. (2023), including the constraints imposed in this work, and discuss their properties. In the high-density limit, the conversion to other degrees of freedom may be energetically favorable, such as hyperons (see, e.g., Glendenning 1996; Chatterjee & Vidaña 2016; see also the Bayesian inference studies including hyperons; Malik & Providência 2022; Malik et al. 2023) or deconfined quark matter (Glendenning 1996; Rezzolla et al. 2018). However, in order to be able to identify the presence of hyperons or other non-nucleonic degrees of freedom, it is essential to understand which are the characteristics of nucleonic matter and which are new signatures that may distinguish nuclear from hyperonic matter. The criterion to select the EOS is the slope of the symmetry energy at saturation; in particular, we consider values between 22 MeV and 70 MeV. The inner crust is built considering a compressible liquid drop (CLD) approximation (Pais et al. 2015). Regarding the crust-core transition properties, we compare the values obtained from such a calculation with the ones obtained from a dynamical spinodal one (Pais & Providência 2016). Neutron star properties, such as mass-radius curve, tidal deformability, crust-core transition density, proton fraction, speed of sound, and trace anomaly, among others, are given. A comparison between the performance of the different EOSs and the NS observations and the neutron matter EOS from a χEFT calculation is discussed. We also give the spectral representation for all the EOSs according to the format proposed in Lindblom (2010), which is a convenient representation to study quasi-periodic oscillations with realistic EOSs. A discussion of the error introduced when the unified inner crust is not used, as in Malik et al. (2023), is also presented.
2. Formalism
The 21 EOSs were obtained within an RMF approach. The Lagrangian density that generates these models is written in terms of the fermionic fields that describe the nucleons, and the mesonic fields, the scalar isoscalar σ field, the vector-isoscalar ω field, and the vector-isovector ρ field are responsible for the description of the nuclear interaction. In the present formalism, nonlinear meson terms are included to allow for a realistic modulation of the density dependence of both the symmetric nuclear matter and the symmetry energy. There are also density-dependent RMF models, where the couplings of the mesons to the nucleons depend on the density. When comparing both formalisms, we saw that they give similar results (Providência et al. 2023), but the restriction on the range of certain NS properties may depend on the density-dependent functional chosen (Scurto et al. 2024) and, in particular, the number of parameters defining the couplings.
The role of these nonlinear terms has been discussed in several seminal works Boguta & Bodmer (1977), Horowitz & Piekarewicz (2001), Mueller & Serot (1996), Sugahara & Toki (1994) and explored within a Bayesian inference study in Malik et al. (2023). The couplings of the mesons to the nucleons, gσ, gω, and gρ, and the parameters of the non-linear terms, b, c, ξ, and Λω are listed in Table 1.
2.1. The model
The Lagrangian describing the nuclear matter system is given by
 (1)
(1)
with
![Mathematical equation: $$ \begin{aligned} \begin{aligned} \mathcal{L} _{N}=&\bar{\Psi }\Big [\gamma ^{\mu }\left(i \partial _{\mu }-g_{\omega } \omega _{\mu }- g_{\varrho } {\boldsymbol{t}} \cdot \boldsymbol{\varrho }_{\mu }\right) \\&-\left(m-g_{\sigma } \sigma \right)\Big ] \Psi \\ \mathcal{L} _{M}=&\frac{1}{2}\left[\partial _{\mu } \sigma \partial ^{\mu } \sigma -m_{\sigma }^{2} \sigma ^{2} \right] \\&-\frac{1}{4} F_{\mu \nu }^{(\omega )} F^{(\omega ) \mu \nu } +\frac{1}{2}m_{\omega }^{2} \omega _{\mu } \omega ^{\mu } \nonumber \\&-\frac{1}{4} \boldsymbol{F}_{\mu \nu }^{(\varrho )} \cdot \boldsymbol{F}^{(\varrho ) \mu \nu } + \frac{1}{2} m_{\varrho }^{2} \boldsymbol{\varrho }_{\mu } \cdot \boldsymbol{\varrho }^{\mu }.\\ \mathcal{L} _{NL}=&-\frac{1}{3} b ~m~ g_\sigma ^3 (\sigma )^{3}-\frac{1}{4} c g_\sigma ^4 (\sigma )^{4}+\frac{\xi }{4!}g_{\omega }^4(\omega _{\mu }\omega ^{\mu })^{2} \nonumber \\ &+\Lambda _{\omega }g_{\varrho }^{2}\boldsymbol{\varrho }_{\mu } \cdot \boldsymbol{\varrho }^{\mu } g_{\omega }^{2}\omega _{\mu }\omega ^{\mu }, \end{aligned} \end{aligned} $$](/articles/aa/full_html/2024/09/aa49292-24/aa49292-24-eq3.gif) (2)
(2)
where Ψ are the Dirac spinors that describe the nucleons, protons, and neutrons, with a bare mass m. In the above expression, γμ are the Dirac matrices, t is the isospin operator. We have introduced the following vector meson tensors F(ω, 𝜚)μν = ∂μA(ω, 𝜚)ν − ∂νA(ω, 𝜚)μ. The parameters gσ, gω, and g𝜚 designate the couplings of the nucleons to the meson fields σ, ω, and 𝜚 with masses, respectively, mσ, mω, and m𝜚.
The coupling parameters of the nonlinear terms b, c, ξ, and Λω together with the couplings gi have been calculated imposing a set of constraints that we later discuss. Here, we briefly summarize the role of the nonlinear terms: The nonlinear σ terms introduced by Boguta & Bodmer (1977) control the nuclear matter incompressibility at saturation. The ω4 term was introduced in Sugahara & Toki (1994) and softens the EOS at high densities. The ωρ term allows the density dependence of the symmetry energy to be controlled. The meson fields were taken as static classical fields and replaced by their expectation values determined from the equations
 (3)
(3)
 (4)
(4)
 (5)
(5)
with ρis and ρi, respectively, the scalar density and the number density of nucleon i, and
 (6)
(6)
 (7)
(7)
 (8)
(8)
In order to describe β-equilibrium matter, electrons and muons were introduced in the Lagrangian density:
Electric charge neutrality and β-equilibrium were imposed, which are respectively defined by the relations
In order to determine the NS properties and, in particular, to integrate the Tolmann-Oppenheimer-Volkoff equations Tolman (1939), Oppenheimer & Volkoff (1939) to obtain the mass and radius of spherical static NSs, the pressure and energy density must be calculated. The energy density is given by
 (9)
(9)
where mi* = mi − gsσ for protons and neutrons, mi* = mi for electrons and muons, and kFi is the Fermi moment of particle i. The pressure was determined from the thermodynamic relation
 (10)
(10)
2.2. The outer crust
The outer crust region of the star is composed of a neutral lattice of nuclei and electrons. Even though there are several EOSs in the literature for this layer of the star, in what concerns its macroscopic properties, such as the mass and radius, the outer crust does not affect any of them, and, in principle, any EOS can be used. A few of these EOSs are available in the CompOSE website, a free online public database of EOSs for compact objects.
For this region, we chose the BSk22 EOS (Pearson et al. 2018) taken from the CompOSE website (Typel et al. 2015; CompOSE Core Team 2022; CompOSE 2024). This EOS was calculated using the Hartree-Fock-Bogoliubov atomic mass table HFB-22 and the 2016 Atomic Mass Evaluation (Audi et al. 2017) when the former had no available masses (see Fantina 2023 and references therein).
2.3. The inner crust
In the inner crust, heavy clusters are expected to form. Due to the competition between the strong and Coulomb forces, they form geometrical structures, called the “nuclear pasta phase” due to their resemblance to the Italian food. These clusters may affect the cooling of the proton-neutron star, as the neutrino mean-free path may be affected, and they may also have a consequence on the dynamics of the object, namely on the transport properties. Eventually these geometries will melt, and the core of the star is reached. This is denoted as the crust-core transition.
In this work, this region of the star is calculated within the CLD model (Pais et al. 2015) considering β-equilibrium and zero-temperature stellar matter. In this approximation, the system is composed of two distinct regions: the low-density one (denoted by II), that is, the gas composed of free neutrons, protons, and electrons, and the high-density one (denoted by I), that is, the clusters. The total energy density of the system, the conditions for electrical neutrality, and β-equilibrium are respectively given by
 (11)
(11)
 (12)
(12)
 (13)
(13)
where Fi, i = I, II is the free energy density of the homogeneous neutral nuclear matter and the Coulomb and surface terms are respectively given by
 (14)
(14)
 (15)
(15)
To find the stable solutions, the total energy was minimized against the variables of the system: the proton and neutron densities in both phases, I and II; the radius of the geometry, rd; and the fraction of the phase I, f. From this minimization, we obtained the following equilibrium relations:
 (16)
(16)
with the radius of the geometry given by
 (17)
(17)
In these equations, α = f for droplets, rods, and slabs, and α = 1 − f for tubes and bubbles; σ is the surface energy coefficient, D is the dimension of the geometry (three for droplets), and Φ is given by
 (18)
(18)
3. Results
A collection of 21 EOSs based on RMF models featuring a range of nuclear saturation properties was created to explore the characteristics of NSs. The significance and implications of these 21 EOS models as well as their intricate properties is discussed in this section.
A significant feature of NSs is their inner crust, which consists of nonhomogeneous clustered matter. We used a CLD calculation for the inner crust. As this calculation is not fully self-consistent since the surface tension was chosen to be the same for all the models, we also performed a dynamical spinodal calculation to calculate the transition density. These two approaches are discussed in the following. In all the figures, we highlight the three EOSs that have passed all the constraints discussed in Section 3.3, namely, EOSs 8, 18, and 19.
3.1. Properties of the equations of state
In Table 2, the properties of the 21 EOSs are summarized. These include the nuclear matter parameters defined from the usual approximation for the energy per nucleon
 (19)
(19)
Nuclear saturation properties for all EOS models.
where ε(ρ, 0) is the symmetric nuclear matter (SNM) EOS, S(ρ) is the symmetry energy, and δ = (ρp − ρn)/(ρp + ρn) is the asymmetry. The SNM parameters defined at saturation are the energy per nucleon ε0 = ε(ρ0, 0) (n = 0), the incompressibility coefficient K0 (n = 2), the skewness Q0 (n = 3), and the kurtosis Z0 (n = 4), which are respectively given by
 (20)
(20)
The symmetry energy parameters at saturation are the symmetry energy at saturation Jsym, 0 (n = 0),
 (21)
(21)
the slope Lsym, 0 (n = 1), the curvature Ksym, 0 (n = 2), the skewness Qsym, 0 (n = 3), and the kurtosis Zsym, 0 (n = 4), respectively defined as
 (22)
(22)
Looking at Table 2, the binding energy per nucleon, denoted as ϵ0, displays a median value of −16.16 MeV, with its values spanning from −16.40 MeV to −15.72 MeV. The incompressibility of nuclear matter, represented by K0, had a median of 233 MeV, and its value varies between 190 MeV and 290 MeV. The skewness of the data, indicated by Q0, had a median of −339 MeV, with an extensive range from −491 MeV to 375 MeV. Regarding the transition density, symbolized as ρt, the median was calculated at 0.0944 fm−3, with its range stretching from 0.067 fm−3 to 0.127 fm−3. Lastly, the nuclear saturation density, ρ0, shows a more consistent agreement among the EOS models, with a median of 0.155 fm−3 and values ranging from 0.144 fm−3 to 0.165 fm−3.
3.2. Equation of state
In Figure 1, the 21 EOS models considered in this work are shown. The pressure is plotted as a function of the energy density for homogeneous stellar matter, with an inner crust calculated using the CLD method. This figure highlights the crust part, where the first branch, up to ϵ ∼ 10 MeV fm−3, represents the BSk22 outer crust, and the following branch, up to ϵ ∼ 100 MeV fm−3, represents the inner crust, as the value ∼150 MeV fm−3 roughly corresponds to the nuclear saturation density, 0.15 fm−3. At the transition to the core, the EOS that has the lowest pressure value is EOS 5, with Pt = 0.318 MeV fm−3, and the one that has the highest value is EOS 7, with Pt = 0.7956 MeV fm−3. These values are written in the previous Table 2.
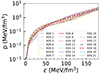 |
Fig. 1. Pressure versus energy density for NS matter in β-equilibrium using our EOS set. |
Figure 2 illustrates the intricate relationship between the proton fraction and density within NSs. This is a fundamental link to the symmetry energy of the model. The direct Urca (dUrca) threshold value of the proton fraction is particularly important. At this density the dUrca processes, which are a major factor in the cooling of NSs, are triggered. The internal chemical composition of NSs is established through the weak interaction, specifically the β-equilibrium condition. The composition has a major impact on the cooling efficiency of both middle-aged isolated NSs and accreting NSs. The dUrca process, which involves the weak interaction-based conversion of neutrons into protons and vice versa, is much more efficient – approximately a million times more so – than the modified Urca process, which is mediated by several nucleons when it occurs, as highlighted in the research conducted by Yakovlev and collaborators Yakovlev et al. (2001), Yakovlev & Pethick (2004). The onset of the dUrca process requires a certain threshold in the proton fraction, specifically a minimum of one-ninth if no muons or other charged species are considered, as pointed out by Lattimer et al. (1991). This threshold proton fraction increases slightly after the onset of muons. The proton fraction within NSs, denoted as yp, increases with baryonic density. Therefore, in massive NSs, if yp surpasses the critical threshold for the proton fraction, dUrca processes can potentially start. Recent studies, such as those by Beznogov & Yakovlev (2015), have used statistical approaches to describe the thermal evolution of isolated and accreting NSs. These studies suggest that a successful description of cooling curves is achievable by considering the onset of the dUrca processes in stars with masses on the order of 1.6 to 1.8 solar masses. Table 3 provides the dUrca threshold density ρdUrca and the corresponding NS mass where the dUrca sets in at the center, MdUrca, for all models. Some models do not predict the occurrence of nucleonic dUrca in the NS interior. In this case, a slower but still quite efficient process may occur if hyperons set in. Several models present the onset of the nucleonic dUrca inside stars with masses ∼1.6 to 1.8 M⊙, but for most of the NSs that allow nucleonic dUrca, it only occurs inside stars with a mass on the order of 2 M⊙ or larger. We note, however, that if hyperonic degrees of freedom are allowed, hyperonic dUrca processes may occur inside NSs with smaller masses since the hyperonic dUrca processes open for densities close to the onset hyperon density.
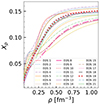 |
Fig. 2. Proton fraction as a function of baryon density for all 21 EOSs considered. |
List of several NS properties for all 21 EOS models.
Astrophysicists often opt for the functional form of the EOS instead of using tabulated data for computationally expensive calculations (Abbott et al. 2018; Miller et al. 2019; Raaijmakers et al. 2020). Having that in mind, we also present our set of 21 EOSs in the spectral representation of realistic EOSs, which offers a precise and efficient method to approximate any realistic EOS with an error of less than 0.5% Lindblom (2010). In Table 4, we show the parameters obtained from a spectral decomposition fit to the RMF EOS.
Spectral representation of all the employed RMF EOS.
3.3. Constraints from the low-density regime
In this section, we analyze the symmetric nuclear and neutron matter properties of the 21 EOSs. We also compare these properties with constraints available in the literature.
Figure 3 displays the pressure of the pure neutron matter as a function of the baryon density for the 21 EOSs we analyzed. We have included the theoretical constraints derived from a state-of-the-art N3LO calculation within a χEFT (dark blue) and twice its uncertainty, 2×N3LO (light blue). All the EOSs in our dataset are affected by N3LO uncertainty. We note that some microscopic calculations, such as Brueckner-Hartree-Fock (BHF), can go to higher densities than chiral EFT calculations for neutron matter, which go to densities of ∼0.2 fm−3. However, BHF calculations generally do not give an estimate of the uncertainty associated with each point, and the three-body force introduces large uncertainties in the high density limit, either phenomenological or microscopic (see section 3.3 of Burgio et al. 2021).
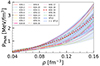 |
Fig. 3. Pure neutron matter pressure as a function of the baryonic density. The dark (light) blue band denotes the pure neutron matter calculated within a χEFT description Hebeler et al. (2013) considering the uncertainty (twice the uncertainty) indicated. |
If the pure neutron energy per particle obtained in Huth et al. (2022) is imposed with the given uncertainties instead of the pure neutron matter pressure given in Hebeler et al. (2013), several EOSs are completely out of the calculated range. This is shown in the top panel of Figure 4, where the energy per neutron is plotted as a function of density and compared with a band that corresponds to several χEFT calculations. Five EOSs (EOS 1,8, 18, 19, and 21) are inside the total density range 0.04–0.16 fm−3, and 11 EOSs are inside the range 0.08–0.16 fm−3 (see Table 5 for a complete list of all satisfied constraints). We compared the energy per particle of symmetric matter of our 21 EOSs with the results of N3LO ChEFT calculations for symmetric matter from Drischler et al. (2016). We considered the whole region of the calculations presented in Fig. 4 of that article, taking a band that goes from the bottom gray dashed line up to the top band, corresponding to different approximations. We observed that nearly all of our models fall within this band; EOSs 14 and 16 are marginally out of it in the density range below 0.07 fm−3.
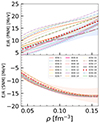 |
Fig. 4. Energy per particle as a function of the baryonic density for pure neutron matter (top) and symmetric nuclear matter (bottom). The light blue band in the top panel represents the enclosed region of several χEFT calculations taken from Huth et al. (2022), and the orange band in the bottom panel represents the region given by all calculations in Fig. 4 of Drischler et al. (2016). |
List of constraints that each EOS pass/does not pass.
In Figure 5, the symmetry energy is shown and compared with the band extracted in Danielewicz & Lee (2014) from isobaric analog states (IAS). Twelve EOS satisfy this constraint, see Table 5 for a complete list.
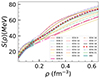 |
Fig. 5. Symmetry energy S(ρ) as a function of density ρ for all EOSs. The constraints on the symmetry energy from IAS Danielewicz & Lee (2014) is also displayed. |
3.4. Neutron star properties
In Figure 6, we show the mass-radius relations for all the models considered. In this figure, several observational constraints are reported, as identified in the caption. In particular, we concluded that nearly all EOSs satisfy the constraints from the GW event GW170817 at a 90% credible interval (CI), with the exception being EOS1. Also almost all EOSs satisfy the constraints coming from NICER, both for the PSR J0030 + 0451 and PSR J0740 + 6620, at a 68% CI. Only EOS 6 does not fall inside the 1σ distribution obtained for PSR J0740 + 6620. We have also included the 1σ and 2σ 2D distributions for the low-mass compact object J1731-347 recently detected by the High Energy Stereoscopic System (HESS) collaboration. Of all the EOSs, only EOS 6 and EOS 19 fall inside the 2σ CI.
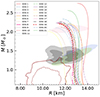 |
Fig. 6. Neutron star mass-radius curves for all 21 models with unified crust. The gray regions indicate the 90% (light) and 50% (dark) CI constraints from the binary components of GW170817. The 1σ (68%) CI for the 2D posterior distribution in the mass-radii domain for the millisecond pulsar PSR J0030 + 0451 (cyan and green) Riley et al. (2019), Miller et al. (2019) as well as the PSR J0740 + 6620 (pink) Riley et al. (2021), Miller et al. (2021) from the NICER X-ray data are also shown. Additionally, we show the constraint obtained from HESS J1731-347 for 68.3% (95.4%) CIs in dashed dark red (solid dark red) Doroshenko et al. (2022). |
The GW170817 event (Abbott et al. 2018) also set constraints on the tidal deformability of stars with a mass on the order of 1.4M⊙. In Figs. 7 and 8, the combined tidal deformability and dimensionless tidal deformabilities are shown and compared with the values from the GW170817 event. The blue band in Fig. 7 identifies the constraint deduced from the tidal deformability of a 1.36M⊙ NS corresponding to the mass ratio of q = 1 between the masses of the binary NS, which within 90% CI is below 720. We concluded that only six EOSs do not satisfy this constraint: EOSs 1, 2, 3, 4, 5, and 21. In Fig. 8, the dimensionless tidal deformability parameters of both stars of the binary NS merger of the GW170817 event, Λ1 and Λ2, are plotted for all the 21 RMF EOSs, taking into account the observed chirp mass Mchirp = 1.186 M⊙, and compared with the data from the GW170817 event. The orange line (solid for 90% confidence and dashed for 50% confidence) indicates the CIs obtained in Abbott et al. (2017b), while the blue shaded area highlights the marginalized posterior derived from a parameterized EOS imposing a maximum mass stipulation of 1.97 M⊙ by the LVC Abbott et al. (2019). Within the blue region, the solid and dashed lines depict 90% and 50% CIs, respectively (see Abbott et al. 2019). Considering the marginalized posterior at 90% CI, only two EOSs do not satisfy the constraints: EOSs 1 and 5.
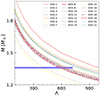 |
Fig. 7. Mass-tidal deformability relationship of NSs determined by taking into account all equations of state with a unified crust. The blue band indicates the tidal deformability for a mass ratio of q = 1 or for a NS of 1.36M⊙ that was part of the binary NS event GW170817 Abbott et al. (2018). |
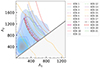 |
Fig. 8. Dimensionless tidal deformability parameters, denoted as Λ1 and Λ2, derived from the binary NS merger of the GW170817 event. These values were evaluated based on all 21 RMF EOSs, taking into account the observed chirp mass Mchirp = 1.186 M⊙. The orange line (solid for 90% confidence and dashed for 50% confidence) indicates the confidence intervals, while the blue shaded area highlights the marginalized posterior derived from a parameterized EOS. This EOS has a maximum mass stipulation of 1.97 M⊙, and within this blue region, the solid and dashed lines again depict 90% and 50% confidence intervals, respectively. |
In Table 3, we summarize the NS properties of the 21 EOSs. In particular, we give the maximum mass, Mmax ; the radius of the maximum mass star, Rmax; the radius for a 1.4 solar mass NS, R1.4; the radius for a 2.08 solar mass NS, R2.08; the dimensionless tidal deformability for a 1.4 solar mass NS, Λ1.4; the square of the speed of sound, cs2; the central baryonic density, ρc; the dUrca onset density, ρdUrca; and the NS mass where nucleonic dUrca processes open, MdUrca. We concluded that except for EOSs 1 and 21, the remaining EOSs predict a central baryonic density ρc ≳ 6ρ0. Concerning the speed of sound, five EOSs predict cs2 < 0.5, and ten EOSs have cs2 > 0.6 but never above 0.8.
3.5. Crust-core transition properties and correlations
In this subsection, we discuss some crust-core transition properties. We have considered two different calculations to determine the transition density: the CLD (Pais et al. 2015) and the dynamical spinodal (Pais & Providência 2016) calculation. In the first, we determined the nonhomogeneous matter inside the inner crust considering for the heavy clusters a CLD description within a Wigner-Seitz approximation. In the second approach, the transition density was defined by the zero eigenmode obtained when density fluctuations in infinite nuclear matter in β-equilibrium are considered. In Table 2, we show the density, the correspondent pressure, and the proton fraction (respectively ρt, Pt, yp, t) along with the saturation properties at the crust-core transition. In principle, if the calculation of the nonhomogeneous matter had been carried out in a self-consistent calculation as in the Thomas Fermi description in Avancini et al. (2010), we would expect the prediction from the dynamical spinodal to be slightly below the CLD one. However, the CLD calculation is not totally self-consistent due to the surface tension considered. There are six EOSs for which the spinodal transition is above the CLD, but the difference is ≲2%. The values predicted are on the order of ρ0/2 − 2ρ0/3, with the smallest being ∼0.07fm−3 and the largest ∼0.13fm−3. At the transition, the pressure varies between ∼0.35 and 0.70 MeV/fm3. Another quantity that is also interesting is the proton fraction at the crust core transition. For the 21 EOSs, it is generally above 0.03 (except for three EOSs) and can be as high as 0.065. This is a quantity that defines the behavior of the crust in the presence of a strong magnetic field, and as discussed in Fang et al. (2016, 2017), Wang et al. (2022), a low value of yp may imply a larger inner crust.
In Ducoin et al. (2010, 2011), it was shown that the crust-core transition density is well correlated with the slope of the symmetry energy at saturation Lsym, 0. Since the 21 EOSs have been precisely chosen by the value of this parameter, they span quite a large range: 22 ≤ Lsym, 0 ≤ 70 MeV. In Figure 9, we plot the transition density, pressure, and proton fraction, respectively, ρt, Pt and yp, t in terms of the symmetry energy slope Lsym, 0. As discussed in Ducoin et al. (2010, 2011), the transition density ρt is very well correlated with Lsym, 0. Also, the proton fraction yp, t shows a quite good correlation with Lsym, 0 but not with the pressure Pt.
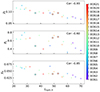 |
Fig. 9. From top to bottom, dependencies of the transition density (ρt), β-equilibrium pressure (pt), and proton fraction (yp) at core crust transition density over the symmetry energy slope parameter (Lsym, 0). |
In Table 6, we present a fit of these correlations in terms of the symmetry energy parameters Jsym, 0, Lsym, 0 (ρt and yp, t). For the pressure, we also consider the two higher-order parameters Ksym, 0 and Qsym, 0. The absolute Pearson correlation coefficient rx, y for each relationship is also listed with the relative mean square error (RMSE). The stronger correlations with the smallest RMSE are precisely the ones obtained for the transition density.
Relations among core-crust transitional properties.
Before finishing this sub-section, we comment on the approximation implemented in Malik et al. (2023) for the inner crust. In that work, the BPS EOS was used for the outer crust, and for the inner crust, a polytropic EOS was used. It was matched to the core EOS at 0.04 fm−3. Although this density is well below the crust-core transition, it was assumed that the error introduced when considering the outer core EOS already above this density would be small because the energy difference between the homogeneous matter EOS and the nonhomogeneous EOS is small in this range of densities (see Avancini et al. 2008). In Table 7 we list the NS radius of stars with masses between 1.4 and 2.0 solar masses for the 21 EOSs based on the unified crust (CLD approach; as described in section 2.3) and the BPS + polytropic crust (as outlined in Malik et al. 2023) as well as the corresponding percentage error. The maximum error introduced with the BPS + polytropic crust + core EOS at 0.04 fm−3 is on the order of 1%–1.5%, but in most cases it is well below 1%.
Neutron star radius for masses between 1.4 and 2.0 solar masses.
3.6. Trace anomaly and speed of sound
The identification of a phase transition to deconfined matter inside the NS has been the topic of many recent studies and has been developed within different frameworks (see, for instance, Annala et al. 2020; Tews et al. 2018; Altiparmak et al. 2022; Gorda et al. 2022; Somasundaram et al. 2023b, 2023a). In Kurkela (2022), using a Gaussian process description of the EOS, the authors estimated the potential effect of the EOS obtained in the perturbative QCD (pQCD) regime (i.e., above ∼40ρ0) on the EOS of NS matter. In particular, the authors analyzed the effect on the speed of sound.
In Fig. 10, we have plotted the speed of sound squared as a function of the baryonic density for our 21 EOSs. In that figure, we also include the two regions calculated in Kurkela (2022), which define the 90% CI for the square of the speed of sound, imposing only astrophysical constraints (the blue band denominated Astro) and astrophysical plus pQCD constraints (the brown band denominated Astro + pQCD). One consequence of imposing the pQCD constraints is the speed of sound being pushed to lower values at high densities, which gives rise to a peak at a baryonic density on the order of ∼0.5 fm−3. The 21 EOSs presented in our study are nucleonic EOSs without any kind of phase transition. No EOS shows a peak on the speed of sound at 0.5 fm−3, but a large number of them flatten above this density, and some even stay inside the Astro + pQCD band for the whole range of densities, which may imply that the identification of the presence of a quark phase may be more difficult than expected.
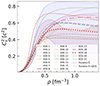 |
Fig. 10. Square of the speed of sound cs2 as a function of density for the EOS set considered. We also compare the posteriors obtained with “astro” and the “astro” + pQCD constraint in Ref. Kurkela (2022). |
Besides the speed of sound, other quantities have been proposed to identify the presence of quark matter inside NSs: the polytropic index γ = dlnP/dlnϵ, where p is the pressure and ϵ is the energy density of the EOS (Annala et al. 2020), the trace anomaly Δ = 1/3 − P/ϵ (Fujimoto et al. 2022), or a composition of these quantities, dc, as defined in Annala et al. (2023). Within a pQCD calculation, these quantities take the values cs2 ≲ 1/3, γ ∈ [1 : 1.7] and Δ ∈ [1 : 0.15] (Annala et al. 2023) at densities above 40ρ0. In the conformal limit, γ = 1 and Δ = 0.
Since these quantities can characterize properties of pure nucleonic EOS built from an RMF description, we calculated them with the 21 EOSs discussed in the present work. We have plotted cs2, γ and Δ in Fig. 11 for all the EOSs. We plotted these quantities up to a density on the order of 1 fm−3, which is approximately the central density of our maximum mass star, that is, of stars with a mass MTOV. At these densities, γ takes values between one and 1.5, and Δ may be slightly positive, but in general it takes negative values that can be as low as −0.2, in agreement with the NS data plotted in Fig. 2 of Fujimoto et al. (2022) with results from Fujimoto et al. (2018, 2020).
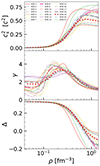 |
Fig. 11. Speed of sound squared cs2, the polytropic index γ = dlnP/dlnϵ, and the trace anomaly Δ = 1/3 − P/ϵ for all EOSs. |
Finally, in Fig. 12, we have also plotted the quantity proposed in Annala et al. (2023) as identifying the presence of quark matter,  with Δ′=cs2(1/γ − 1). We note that dc = 0.2 would represent the threshold limit for the presence of quark matter, dc > 0.2 would imply purely hadronic matter, and dc < 0.2 would imply only quark matter. For some EOSs, dc stays well above 0.2, and there are some for which in the center of the star, dc < 0.2. The idea is that Δ and Δ′ should be small when γ and cs2 are close to the conformal limit. This would identify a phase transition to deconfined quark matter, which should have approximate conformal symmetry. We were able to obtain small values for dc because the polytropic index γ takes quite small values, even though the speed of sound squared never comes below 0.4. The models that predict a small dc are the ones with the smallest speed of sound squared in the center of the maximum mass star, cs2 ≲ 0.5, and these are the models with the largest contribution from the ω4 term, which is responsible for softening the EOS at high densities.
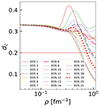 |
Fig. 12. Relationship between dc and ρ for all EOSs. (See text for details.) |
3.7. Discussion
In Table 5, we summarize the behavior of the 21 EOSs with respect to several constraints that were discussed in previous subsections. These constraints include the NS mass-radius from GW170817 within 50% CI and 90% CI as well as the tidal deformability from the same event for the mass ratio q = 1 or NS mass 1.36 M⊙; the symmetry energy constraints from IAS; the pQCD constraints at 5  and 7
and 7  (ns = 0.16 fm−3; for the renormalization scale, X = 2) from Komoltsev & Kurkela (2022); and the pure neutron matter constraint derived from χEFT calculations of the energy per particle from Huth et al. (2022) between 0.04–0.08 fm−3 and 0.08–0.16 fm−3 density. Regarding the pQCD constraint, we followed the same arguments as given in Komoltsev & Kurkela (2022), and we applied causality and thermodynamic relations. Satisfying this constraint means that the EOS at the baryonic density occurring at the center of the maximum mass star and all densities below falls inside the region defined by causality and the thermodynamic relations that connect the pQCD pressure at very high density and the pure neutron matter chEFT pressure at saturation density.
In the table, tick marks are used to indicate the EOSs that satisfy the criteria, and those that do not meet the criteria have a cross mark. Only EOSs 8, 18, and 19 satisfy all constraints. The EOSs 11, 13, 14, and 17 do not satisfy the χEFT in the range 0.04–0.08 fm−3, and EOS 16 fails the χEFT in all the ranges considered. EOSs 6, 7, 9, 10, 12, and 15 do not fall inside the E/N PNM envelop, and they do not satisfy the IAS constraint. EOS 21 fails the tidal deformability and the pQCD at 7 ns constraints. Nearly all of our models fall within the E/A band for ChEFT symmetric matter calculations, except for EOSs 14 and 16, which are marginally out of it in the density range below 0.07 fm−3.
4. Conclusions
We have presented 21 EOSs from the dataset generated in Malik et al. (2023), which were constrained to a few properties of nuclear matter (binding energy at saturation, saturation density, incompressibility), the neutron matter pressure calculated within a χEFT approach, and a minimum 2M⊙ NS maximum mass. The EOSs were chosen in such a way that a large range of values of the slope of the symmetry energy at saturation were covered.
We built the unified inner-crust core EOS of β-equilibrium matter expected inside NSs, and we have discussed several properties. The EOSs satisfy the presently available NS observations, such as those from the GW170817 event Abbott et al. (2018), NICER observations of the pulsar PSR J0030 + 0451 Riley et al. (2019), Miller et al. (2019), and radio and NICER observations of pulsar PSR J0740 + 6620 Fonseca et al. (2021), Riley et al. (2021), Miller et al. (2021). We showed that although they are constrained by the χEFT pure neutron matter pressure calculations in the range 0.08–0.16 fm−3, only half of the EOSs satisfy the pure energy per particle χEFT calculation of Huth et al. (2022) in the same range of densities, and not all of these EOSs simultaneously satisfy the IAS constraints proposed in Danielewicz & Lee (2014).
Special attention has been placed on the determination of the crust-core transition and the matching of the crust to the core. We have analyzed the correlation of the slope of the symmetry energy at saturation with the crust-core transition density and proton fraction and proposed equations that translate these relations, giving the corresponding absolute Pearson correlation coefficient.
Finally, we have also discussed the behavior of the speed of sound, trace anomaly, and polytropic index, which are quantities frequently used to identify the possible existence of deconfined quark matter inside NSs. We have shown that several of these EOSs have in the center of the most massive NS a speed of sound squared on the order of ≲0.5. Most of the EOSs predict a maximum central density on the order of 6ns, with ns being a reference saturation density of nuclear matter. Only three of the EOSs do not satisfy the pQCD constraints discussed in Komoltsev & Kurkela (2022) at 7ns.
Three of the EOSs (8, 18, and 19) satisfy all the constraints discussed, and four EOSs only fail the χEFT in the range 0.04–0.08 fm−3 (EOSs 11, 13, 14, and 17). The set that meets all the constraints is referred to as UCIa to UCIc, and the one that fails only the lower part of the χEFT PNM constraints is referred to as UCIIa to UCIId (see Table 5). The designation “UC” stands for Universidade de Coimbra. We note that although the M-R curves of these seven EOSs are similar, predicting similar NS properties, the high density properties, and the NMP vary; in particular, the larger values of the incompressibility are associated with smaller symmetry energy properties. EOS 16 fails the χEFT in all the ranges of densities considered. Six EOSs (6, 7, 9, 10, 12, and 15), besides failing the χEFT constraint, also fail the IAS constraint in the complete range of densities given in Danielewicz & Lee (2014). EOS 21 only fails two constraints: the tidal deformability for NS having mass 1.36 M⊙ and pQCD at 7ns.
Data availability
All the calculated unified EOSs are available in the zenodo platform https://doi.org/10.5281/zenodo.10950421
Acknowledgments
This work was partially supported by national funds from FCT (Fundação para a Ciência e a Tecnologia, I.P, Portugal) under projects UIDB/04564/2020 and UIDP/04564/2020, with DOI identifiers 10.54499/UIDB/04564/2020 and 10.54499/UIDP/04564/2020, respectively, and the project 2022.06460.PTDC with the associated DOI identifier 10.54499/2022.06460.PTDC. HP acknowledges the grant 2022.03966.CEECIND (FCT, Portugal) with DOI identifier 10.54499/2022.03966.CEECIND/CP1714/CT0004. The authors acknowledge the Laboratory for Advanced Computing at the University of Coimbra for providing HPC resources that have contributed to the research results reported within this paper, URL: https://www.uc.pt/lca.
References
- Abbott, B. P., Abbott, R., Abbott, T. D., et al. 2017a, Phys. Rev. Lett., 119, 161101 [Google Scholar]
- Abbott, B. P., Abbott, R., Abbott, T. D., et al. 2017b, ApJ, 848, L12 [Google Scholar]
- Abbott, B. P., Abbott, R., Abbott, T. D., et al. 2018, Phys. Rev. Lett., 121, 161101 [Google Scholar]
- Abbott, B. P., Abbott, R., Abbott, T. D., et al. 2019, Phys. Rev. X, 9, 011001 [Google Scholar]
- Abbott, B. P., Abbott, R., Abbott, T. D., et al. 2020, ApJ, 892, L3 [NASA ADS] [CrossRef] [Google Scholar]
- Alam, N., Agrawal, B. K., Fortin, M., et al. 2016, Phys. Rev. C, 94, 052801 [NASA ADS] [CrossRef] [Google Scholar]
- Altiparmak, S., Ecker, C., & Rezzolla, L. 2022, ApJ, 939, L34 [NASA ADS] [CrossRef] [Google Scholar]
- Annala, E., Gorda, T., Kurkela, A., Nättilä, J., & Vuorinen, A. 2020, Nat. Phys., 16, 907 [NASA ADS] [CrossRef] [Google Scholar]
- Annala, E., Gorda, T., Hirvonen, J., et al. 2023, Nat. Commun., 14, 8451 [NASA ADS] [CrossRef] [Google Scholar]
- Arcones, A., Martinez-Pinedo, G., O’Connor, E., et al. 2008, Phys. Rev. C, 78, 015806 [NASA ADS] [CrossRef] [Google Scholar]
- Audi, G., Kondev, F., Meng, W., Huang, W., & Naimi, S. 2017, Chin. Phys. C, 41, 030001 [NASA ADS] [CrossRef] [Google Scholar]
- Avancini, S. S., Menezes, D. P., Alloy, M. D., et al. 2008, Phys. Rev. C, 78, 015802 [NASA ADS] [CrossRef] [Google Scholar]
- Avancini, S. S., Chiacchiera, S., Menezes, D. P., & Providencia, C. 2010, Phys. Rev. C, 82, 055807 [Erratum: Phys.Rev.C 85, 059904 (2012)] [CrossRef] [Google Scholar]
- Bao, S. S., Hu, J. N., Zhang, Z. W., & Shen, H. 2014, Phys. Rev. C, 90, 045802 [NASA ADS] [CrossRef] [Google Scholar]
- Beznogov, M. V., & Yakovlev, D. G. 2015, MNRAS, 452, 540 [NASA ADS] [CrossRef] [Google Scholar]
- Boguta, J., & Bodmer, A. R. 1977, Nucl. Phys. A, 292, 413 [NASA ADS] [CrossRef] [Google Scholar]
- Burgio, G. F., Schulze, H. J., Vidana, I., & Wei, J. B. 2021, Prog. Part. Nucl. Phys., 120, 103879 [CrossRef] [Google Scholar]
- Carriere, J., Horowitz, C. J., & Piekarewicz, J. 2003, ApJ, 593, 463 [NASA ADS] [CrossRef] [Google Scholar]
- Cavagnoli, R., Menezes, D. P., & Providencia, C. 2011, Phys. Rev. C, 84, 065810 [CrossRef] [Google Scholar]
- Chatterjee, D., & Vidaña, I. 2016, Eur. Phys. J. A, 52, 29 [NASA ADS] [CrossRef] [Google Scholar]
- CompOSE 2024, https://compose.obspm.fr [Google Scholar]
- CompOSE Core Team (Typel, S., et al.) 2022, Eur. Phys. J. A, 58, 221 [NASA ADS] [CrossRef] [Google Scholar]
- Danielewicz, P., & Lee, J. 2014, Nucl. Phys. A, 922, 1 [NASA ADS] [CrossRef] [Google Scholar]
- Doroshenko, V., Suleimanov, V., Pühlhofer, G., & Santangelo, A. 2022, Nat. Astron., 6, 1444 [NASA ADS] [CrossRef] [Google Scholar]
- Drischler, C., Hebeler, K., & Schwenk, A. 2016, Phys. Rev. C, 93, 054314 [Google Scholar]
- Drischler, C., Hebeler, K., & Schwenk, A. 2019, Phys. Rev. Lett., 122, 042501 [Google Scholar]
- Drischler, C., Melendez, J. A., Furnstahl, R. J., & Phillips, D. R. 2020, Phys. Rev. C, 102, 054315 [NASA ADS] [CrossRef] [Google Scholar]
- Ducoin, C., Margueron, J., & Providencia, C. 2010, EPL, 91, 32001 [NASA ADS] [CrossRef] [EDP Sciences] [Google Scholar]
- Ducoin, C., Margueron, J., Providencia, C., & Vidana, I. 2011, Phys. Rev. C, 83, 045810 [NASA ADS] [CrossRef] [Google Scholar]
- Essick, R., Landry, P., & Holz, D. E. 2020, Phys. Rev. D, 101, 063007 [CrossRef] [Google Scholar]
- Fang, J., Avancini, S., Pais, H., & Providência, C. 2016, Phys. Rev. C, 94, 062801 [CrossRef] [Google Scholar]
- Fang, J., Pais, H., Pratapsi, S., et al. 2017, Phys. Rev. C, 95, 045802 [NASA ADS] [CrossRef] [Google Scholar]
- Fantina, A. 2023, Brussels-Montreal BSk22, https://compose.obspm.fr/eos/256 [Google Scholar]
- Fattoyev, F. J., & Piekarewicz, J. 2010, Phys. Rev. C, 82, 025805 [CrossRef] [Google Scholar]
- Ferreira, M., & Providência, C. 2021, Phys. Rev. D, 104, 063006 [NASA ADS] [CrossRef] [Google Scholar]
- Ferreira, M., Fortin, M., Malik, T., Agrawal, B. K., & Providência, C. 2020, Phys. Rev. D, 101, 043021 [NASA ADS] [CrossRef] [Google Scholar]
- Fonseca, E., Cromartie, H. T., Pennucci, T. T., et al. 2021, ApJ, 915, L12 [NASA ADS] [CrossRef] [Google Scholar]
- Fortin, M., Providencia, C., Raduta, A. R., et al. 2016, Phys. Rev. C, 94, 035804 [NASA ADS] [CrossRef] [Google Scholar]
- Fortin, M., Raduta, A. R., Avancini, S., & Providência, C. 2020, Phys. Rev. D, 101, 034017 [NASA ADS] [CrossRef] [Google Scholar]
- Fujimoto, Y., Fukushima, K., & Murase, K. 2018, Phys. Rev. D, 98, 023019 [NASA ADS] [CrossRef] [Google Scholar]
- Fujimoto, Y., Fukushima, K., & Murase, K. 2020, Phys. Rev. D, 101, 054016 [CrossRef] [Google Scholar]
- Fujimoto, Y., Fukushima, K., McLerran, L. D., & Praszalowicz, M. 2022, Phys. Rev. Lett., 129, 252702 [CrossRef] [PubMed] [Google Scholar]
- Fujimoto, Y., Fukushima, K., Hotokezaka, K., & Kyutoku, K. 2023, Phys. Rev. Lett., 130, 091404 [NASA ADS] [CrossRef] [Google Scholar]
- Glendenning, N. K. 1996, Nuclear Physics, Particle Physics and General Relativity, XIV (New York: Springer-Verlag) [Google Scholar]
- Gorda, T., Komoltsev, O., & Kurkela, A. 2022, ApJ, 950, 107 [Google Scholar]
- Hebeler, K., Lattimer, J. M., Pethick, C. J., & Schwenk, A. 2013, ApJ, 773, 11 [CrossRef] [Google Scholar]
- Horowitz, C. J., & Piekarewicz, J. 2001, Phys. Rev. Lett., 86, 5647 [NASA ADS] [CrossRef] [Google Scholar]
- Huth, S., Pang, P. T. H., Tews, I., et al. 2022, Nature, 606, 276 [CrossRef] [PubMed] [Google Scholar]
- Ji, F., Hu, J., Bao, S., & Shen, H. 2019, Phys. Rev. C, 100, 045801 [NASA ADS] [CrossRef] [Google Scholar]
- Komoltsev, O., & Kurkela, A. 2022, Phys. Rev. Lett., 128, 202701 [CrossRef] [PubMed] [Google Scholar]
- Kurkela, A. 2022, EPJ Web Conf., 274, 07008 [NASA ADS] [CrossRef] [EDP Sciences] [Google Scholar]
- Landry, P., & Essick, R. 2019, Phys. Rev. D, 99, 084049 [CrossRef] [Google Scholar]
- Lattimer, J. M., Prakash, M., Pethick, C. J., & Haensel, P. 1991, Phys. Rev. Lett., 66, 2701 [NASA ADS] [CrossRef] [Google Scholar]
- Lindblom, L. 2010, Phys. Rev. D, 82, 103011 [CrossRef] [Google Scholar]
- Malik, T., & Providência, C. 2022, Phys. Rev. D, 106, 063024 [NASA ADS] [CrossRef] [Google Scholar]
- Malik, T., Ferreira, M., Albino, M. B., & Providência, C. 2023, Phys. Rev. D, 107, 103018 [NASA ADS] [CrossRef] [Google Scholar]
- Margueron, J., Hoffmann Casali, R., & Gulminelli, F. 2018a, Phys. Rev. C, 97, 025805 [NASA ADS] [CrossRef] [Google Scholar]
- Margueron, J., Hoffmann Casali, R., & Gulminelli, F. 2018b, Phys. Rev. C, 97, 025806 [NASA ADS] [CrossRef] [Google Scholar]
- Miller, M. C., Lamb, F. K., Dittmann, A. J., et al. 2019, ApJ, 887, L24 [Google Scholar]
- Miller, M. C., Lamb, F. K., Dittmann, A. J., et al. 2021, ApJ, 918, L28 [NASA ADS] [CrossRef] [Google Scholar]
- Mueller, H., & Serot, B. D. 1996, Nucl. Phys. A, 606, 508 [CrossRef] [Google Scholar]
- Newton, W. G., Gearheart, M., & Li, B.-A. 2013, ApJS, 204, 9 [NASA ADS] [CrossRef] [Google Scholar]
- Oppenheimer, J. R., & Volkoff, G. M. 1939, Phys. Rev., 55, 374 [NASA ADS] [CrossRef] [Google Scholar]
- Pais, H., & Providência, C. 2016, Phys. Rev. C, 94, 015808 [NASA ADS] [CrossRef] [Google Scholar]
- Pais, H., Chiacchiera, S., & Providência, C. 2015, Phys. Rev. E, 91, 055801 [NASA ADS] [Google Scholar]
- Pearson, J. M., Chamel, N., Potekhin, A. Y., et al. 2018, MNRAS, 481, 2994 [Erratum: MNRAS, 486, 768 (2019)] [NASA ADS] [Google Scholar]
- Providencia, C., & Rabhi, A. 2013, Phys. Rev. C, 87, 055801 [CrossRef] [Google Scholar]
- Providência, C., Avancini, S. S., Cavagnoli, R., et al. 2014, Eur. Phys. J. A, 50, 44 [CrossRef] [Google Scholar]
- Providência, C., Malik, T., Albino, M. B., & Ferreira, M. 2023, ArXiv e-prints [arXiv:2307.05086] [Google Scholar]
- Providência, C., Fortin, M., Pais, H., & Rabhi, A. 2019, Front. Astron. Space Sci., 6, 13 [CrossRef] [Google Scholar]
- Raaijmakers, G., Greif, S. K., Riley, T. E., et al. 2020, ApJ, 893, L21 [NASA ADS] [CrossRef] [Google Scholar]
- Raaijmakers, G., Greif, S. K., Hebeler, K., et al. 2021, ApJ, 918, L29 [NASA ADS] [CrossRef] [Google Scholar]
- Ravenhall, D. G., Pethick, C. J., & Wilson, J. R. 1983, Phys. Rev. Lett., 50, 2066 [NASA ADS] [CrossRef] [Google Scholar]
- Rezzolla, L., Pizzochero, P., Jones, D. I., Rea, N., & Vidaña, I. 2018, The Physics and Astrophysics of Neutron Stars (Springer), 457 [CrossRef] [Google Scholar]
- Riley, T. E., Riley, T. E., Watts, A. L., et al. 2019, ApJ, 887, L21 [CrossRef] [Google Scholar]
- Riley, T. E., Watts, A. L., Ray, P. S., et al. 2021, ApJ, 918, L27 [CrossRef] [Google Scholar]
- Scurto, L., Pais, H., & Gulminelli, F. 2024, Phys. Rev. D., 109, 103015 [NASA ADS] [CrossRef] [Google Scholar]
- Somasundaram, R., Tews, I., & Margueron, J. 2023a, Phys. Rev. C, 107, L052801 [CrossRef] [Google Scholar]
- Somasundaram, R., Tews, I., & Margueron, J. 2023b, Phys. Rev. C, 107, 025801 [CrossRef] [Google Scholar]
- Sugahara, Y., & Toki, H. 1994, Nucl. Phys. A, 579, 557 [Google Scholar]
- Tews, I., Carlson, J., Gandolfi, S., & Reddy, S. 2018, ApJ, 860, 149 [NASA ADS] [CrossRef] [Google Scholar]
- Thi, H. D., Mondal, C., & Gulminelli, F. 2021, Universe, 7, 373 [NASA ADS] [CrossRef] [Google Scholar]
- Tolman, R. C. 1939, Phys. Rev., 55, 364 [NASA ADS] [CrossRef] [Google Scholar]
- Typel, S., Oertel, M., & Klähn, T. 2015, Phys. Part. Nucl., 46, 633 [CrossRef] [Google Scholar]
- Wang, X., Li, J., Fang, J., Pais, H., & Providência, C. 2022, Phys. Rev. D, 105, 063004 [NASA ADS] [CrossRef] [Google Scholar]
- Xie, W.-J., & Li, B.-A. 2019, ApJ, 883, 174 [NASA ADS] [CrossRef] [Google Scholar]
- Xie, W.-J., & Li, B.-A. 2020, ApJ, 899, 4 [CrossRef] [Google Scholar]
- Yakovlev, D. G., & Pethick, C. J. 2004, ARA&A, 42, 169 [NASA ADS] [CrossRef] [Google Scholar]
- Yakovlev, D. G., Kaminker, A. D., Gnedin, O. Y., & Haensel, P. 2001, Phys. Rept., 354, 1 [NASA ADS] [CrossRef] [Google Scholar]
- Zhou, W., Hu, J., Zhang, Y., & Shen, H. 2023, ApJ, 950, 186 [NASA ADS] [CrossRef] [Google Scholar]
All Tables
All Figures
|
Fig. 1. Pressure versus energy density for NS matter in β-equilibrium using our EOS set. |
| In the text | |
|
Fig. 2. Proton fraction as a function of baryon density for all 21 EOSs considered. |
| In the text | |
|
Fig. 3. Pure neutron matter pressure as a function of the baryonic density. The dark (light) blue band denotes the pure neutron matter calculated within a χEFT description Hebeler et al. (2013) considering the uncertainty (twice the uncertainty) indicated. |
| In the text | |
|
Fig. 4. Energy per particle as a function of the baryonic density for pure neutron matter (top) and symmetric nuclear matter (bottom). The light blue band in the top panel represents the enclosed region of several χEFT calculations taken from Huth et al. (2022), and the orange band in the bottom panel represents the region given by all calculations in Fig. 4 of Drischler et al. (2016). |
| In the text | |
|
Fig. 5. Symmetry energy S(ρ) as a function of density ρ for all EOSs. The constraints on the symmetry energy from IAS Danielewicz & Lee (2014) is also displayed. |
| In the text | |
|
Fig. 6. Neutron star mass-radius curves for all 21 models with unified crust. The gray regions indicate the 90% (light) and 50% (dark) CI constraints from the binary components of GW170817. The 1σ (68%) CI for the 2D posterior distribution in the mass-radii domain for the millisecond pulsar PSR J0030 + 0451 (cyan and green) Riley et al. (2019), Miller et al. (2019) as well as the PSR J0740 + 6620 (pink) Riley et al. (2021), Miller et al. (2021) from the NICER X-ray data are also shown. Additionally, we show the constraint obtained from HESS J1731-347 for 68.3% (95.4%) CIs in dashed dark red (solid dark red) Doroshenko et al. (2022). |
| In the text | |
|
Fig. 7. Mass-tidal deformability relationship of NSs determined by taking into account all equations of state with a unified crust. The blue band indicates the tidal deformability for a mass ratio of q = 1 or for a NS of 1.36M⊙ that was part of the binary NS event GW170817 Abbott et al. (2018). |
| In the text | |
|
Fig. 8. Dimensionless tidal deformability parameters, denoted as Λ1 and Λ2, derived from the binary NS merger of the GW170817 event. These values were evaluated based on all 21 RMF EOSs, taking into account the observed chirp mass Mchirp = 1.186 M⊙. The orange line (solid for 90% confidence and dashed for 50% confidence) indicates the confidence intervals, while the blue shaded area highlights the marginalized posterior derived from a parameterized EOS. This EOS has a maximum mass stipulation of 1.97 M⊙, and within this blue region, the solid and dashed lines again depict 90% and 50% confidence intervals, respectively. |
| In the text | |
|
Fig. 9. From top to bottom, dependencies of the transition density (ρt), β-equilibrium pressure (pt), and proton fraction (yp) at core crust transition density over the symmetry energy slope parameter (Lsym, 0). |
| In the text | |
|
Fig. 10. Square of the speed of sound cs2 as a function of density for the EOS set considered. We also compare the posteriors obtained with “astro” and the “astro” + pQCD constraint in Ref. Kurkela (2022). |
| In the text | |
|
Fig. 11. Speed of sound squared cs2, the polytropic index γ = dlnP/dlnϵ, and the trace anomaly Δ = 1/3 − P/ϵ for all EOSs. |
| In the text | |
|
Fig. 12. Relationship between dc and ρ for all EOSs. (See text for details.) |
| In the text | |
Current usage metrics show cumulative count of Article Views (full-text article views including HTML views, PDF and ePub downloads, according to the available data) and Abstracts Views on Vision4Press platform.
Data correspond to usage on the plateform after 2015. The current usage metrics is available 48-96 hours after online publication and is updated daily on week days.
Initial download of the metrics may take a while.