| Issue |
A&A
Volume 686, June 2024
|
|
|---|---|---|
| Article Number | A288 | |
| Number of page(s) | 11 | |
| Section | Astrophysical processes | |
| DOI | https://doi.org/10.1051/0004-6361/202449206 | |
| Published online | 20 June 2024 | |
Emission signatures from sub-parsec post-Newtonian binaries embedded in circumbinary discs
1
Institut für Astrophysik, Universität Zürich, Winterthurerstrasse 190, 8057 Zürich, Switzerland
e-mail: This email address is being protected from spambots. You need JavaScript enabled to view it.
2
Dipartimento di Fisica “G. Occhialini”, Università degli Studi di Milano-Bicocca, Piazza della Scienza 3, 20126 Milano, Italy
3
INFN, Sezione di Milano-Bicocca, Piazza della Scienza 3, 20126 Milano, Italy
4
INAF – Osservatorio Astronomico di Brera, Via Brera 20, 20121 Milano, Italy
5
DiSAT, Università degli Studi dell’Insubria, Via Valleggio 11, 22100 Como, Italy
Received:
11
January
2024
Accepted:
23
March
2024
Abstract
We studied the dynamical evolution of quasi-circular, equal-mass massive black hole binaries embedded in circumbinary discs from separations of ∼100 Rg down to the merger, following the post merger evolution. The binary orbit evolves owing to the presence of the gaseous disc and the addition of post-Newtonian (PN) corrections up to the 2.5 PN order, therefore including the dissipative gravitational wave back reaction. We investigated two cases of relatively cold and warm circumbinary discs, with aspect ratios of H/R = 0.03, 0.1, respectively, employing 3D hyper-Lagrangian resolution simulations with the GIZMO-MFM code. We extracted spectral energy distributions and light curves in different frequency bands (i.e. X-ray, optical, and UV) from the simulations. We find a clear two orders of magnitude drop in the X-ray flux right before merger if the disc is warm, while we identify a significant increase in the UV flux regardless of the disc temperature. The optical flux shows clear distinctive modulations on the binary orbital period and on the cavity edge period, regardless of the disc temperature. We find that the presence of a cold disc can accelerate the coalescence of the binary by up to 130 s over the last five days of inspiral, implying a phase shift accumulation of about 0.14 radians compared to the binary evolution in vacuum. These differences are triggered by the presence of the gaseous disc and might have implications on the waveforms that can be detected in principle. We discuss the implications that these distinctive signatures might have for existing and upcoming time domain surveys and for multi-messenger astronomy.
Key words: accretion, accretion disks / black hole physics / relativistic processes / galaxies: active / galaxies: nuclei / quasars: supermassive black holes
© The Authors 2024
 Open Access article, published by EDP Sciences, under the terms of the Creative Commons Attribution License (https://creativecommons.org/licenses/by/4.0), which permits unrestricted use, distribution, and reproduction in any medium, provided the original work is properly cited.
This article is published in open access under the Subscribe to Open model. This email address is being protected from spambots. You need JavaScript enabled to view it. to support open access publication.
1. Introduction
The vast majority of massive galaxies are known to host a massive black hole (MBH) at their centre (Kormendy & Ho 2013, and references therein). When two galaxies merge, dynamical friction causes the two hosted MBHs to sink to the centre of the merger remnant, where they form a bound binary (Begelman et al. 1980). Massive black hole binaries (MBHBs) then further evolve towards coalescence through interaction with the environment, that is stars and gas (Armitage & Natarajan 2002; Dotti et al. 2007; Lodato et al. 2009), before entering the regime where further orbital evolution is dominated by gravitational waves (GW) emission (Peters 1964).
The evolution of the binary through the interaction with stars has been investigated by several authors and has been found to efficiently shrink the binary to the GW emission stage and eventually to coalescence (Khan et al. 2011; Vasiliev 2016; Gualandris et al. 2017; Bortolas et al. 2021; Varisco et al. 2021). In gas rich environments, however, the sub-parsec evolution of an MBHB can be dominated by its interaction with a circumbinary accretion disc (Escala et al. 2005; Dotti et al. 2007; Cuadra et al. 2009).
The interaction between a binary and its circumbinary disc was recently extensively investigated, and the outcome strongly depends on the disc properties. Numerical studies employing 2D fixed binary orbit calculations have shown that warm discs can drive the binary apart through the torques exerted by the disc material that leaks into the cavity carved by the binary into the disc (Duffell et al. 2020; Muñoz et al. 2020; Tiede et al. 2020). However, it has also been shown, mainly through 3D live binary orbit calculations (Ragusa et al. 2016; Heath & Nixon 2020; Franchini et al. 2021, 2022, 2023), that when the disc is colder (and thinner), the central MBHB is much more effective in preventing material from entering the cavity, resulting in net binary hardening. Those studies employed scale-free simulations as they did not include any scale-dependent processes such as the evolution of the binary driven by GWs emission, which dominates the evolution towards the merger once the binary decouples from the disc (Armitage & Natarajan 2002). The investigation of the gaseous dynamics in the GW-driven regime is fundamental in order to unveil the possible electromagnetic (EM) counterparts of the merger (MacFadyen & Milosavljević 2008; Bogdanović et al. 2022).
When the two MBHs are at such close separations, Bowen et al. (2017) found that the quasi-periodic exchange of material between the two circumBH discs (also called mini discs), together with their periodic mass fluctuations caused by their inability to maintain equilibrium inflow, possibly provides an identifiable source of variability in their EM emission. Roedig & Sesana (2014) investigated the hotspots generated by shocks between the gaseous stream that feeds the circumBH discs onto the discs themselves, finding, however, that the total energy release in such shocks might not be sufficiently large for it to be detected. A number of studies in the literature have investigated the thermal spectrum from the circumbinary and circumBH discs and the imprint in it created by the cavity carved by the binary (Tanaka et al. 2012; Tang et al. 2018; d’Ascoli et al. 2018). In particular, Tanaka et al. (2012) showed that at separations of the order of 20 gravitational radii, the contribution from the circumBH discs is only 1% of that of the circumbinary disc. d’Ascoli et al. (2018) investigated the emission on the same small scales assuming that circumBH discs, the streams, and the circumbinary disc are sources of both thermal and coronal emission. Their model produces thermal radiation with a spectrum that differs only modestly from ordinary single MBH systems.
A proper characterisation of possibly distinctive EM signals coming from these systems is of paramount importance for the identification of counterparts to the MBHBs that will be targeted by the Laser Interferometer Space Antenna (LISA, Amaro-Seoane et al. 2023). Moreover, the EM identification of extremely massive MBHBs might aid the interpretation of the GW signal recently detected by pulsar timing array (PTA) collaborations around the globe; namely the EPTA (Antoniadis et al. 2023a,b,c,d; EPTA Collaboration and InPTA Collaboration 2024; Smarra et al. 2023), NANOGrav (Agazie et al. 2023a,b,c; Afzal et al. 2023), PPTA (Reardon et al. 2023), and CPTA (Xu et al. 2023).
A recent further attempt in this direction was made by two numerical studies that investigated the dynamics of the gas that surrounds an MBHB at ∼100 gravitational radii separation, evolving by means of GWs only (Dittmann et al. 2023; Major Krauth et al. 2023). In particular, Major Krauth et al. (2023) found a persistent thermal X-ray emission lasting until one to two days before the merger and then abruptly dropping by several orders of magnitude, which is consistent with the complete accretion of the material orbiting around each binary component (i.e. the mini discs). Dittmann et al. (2023) used a different numerical code and found the decoupling to occur in the LISA band only for very high disc viscosities (i.e. kinematic viscosity ν ≥ 0.03). These studies employ 2D hydrodynamics simulations where the binary orbit evolves only through GW emission according to an analytic prescription, without integrating the binary orbit over time. This implies that the modification of the binary orbit due to its interaction with the gas, which dominates the evolution before the decoupling, is neglected.
In this work, we took a step further by investigating the interaction between a gaseous circumbinary disc and an equal-mass binary whose dynamics is described with post-Newtonian (PN) correction up to the 2.5 PN order. This approach allows us to accurately assess possible EM signatures of merging MBHBs in a regime where the binary naturally evolves as a result of the interaction with both the gaseous circumbinary disc and via GW emission. The main aims of our work are to characterise the thermal emission coming from the gaseous disc and its changes as the binary evolves towards the merger and to identify possible EM precursors or signatures of merging MBHBs.
The paper is organised as follows. In Sect. 2, we describe our numerical setup. We then present our results in Sect. 3 and discuss their implications, while we draw our conclusions in Sect. 4.
2. Numerical setup
The initial conditions for this work consist of a binary surrounded by a quasi-steady state circumbinary gaseous disc. Specifically, we take the 1000th orbit of two Newtonian simulations we performed in Franchini et al. (2022) with a disc aspect ratio of H/R = 0.03, 0.1, and we then follow the evolution until merger applying PN corrections to the binary dynamics as outlined in Sect. 2.1.
The initial number of particles is different between the two simulations as the gas dynamics strongly depends on the disc aspect ratio, i.e. on its temperature. The cold disc simulation (H/R = 0.03) has roughly 4 × 10⁶ particles, while the warm disc is modelled using 2 × 10⁶ particles1. The number of particles is set by previous simulations (Franchini et al. 2022), where the initial number of particles was the same, regardless of the choice of disc aspect ratio, and the splitting scheme was identical. In this respect, the lower number of particles at the 1000th orbit of the warm disc simulation is simply due to the higher viscosity, which results in significantly more material entering the binary cavity and accreting on the two MBHs compared to the cold disc case.
The circumbinary discs initially extended from Rin = 2a to Rout = 10a. The radial extension is however slightly modified by the interaction with the binary over the first 1000 orbits, resulting in a cavity radius around 3a (slightly larger in the colder disc simulation). The gas is described by a locally isothermal equation of state with the sound speed cs defined by Eq. (4) in Farris et al. (2014), and an initial surface density profile scaling as Σ ∝ R−3/2, normalised to obtain a total mass of Mdisc = 100 M⊙ in both simulations. We also include the effect of gas viscosity entering the Navier-Stokes fluid equations as described in Hopkins (2016), assuming a shear viscosity in the disc ν = αcsH, parametrised using a viscosity parameter of α = 0.1 (Shakura & Sunyaev 1973) and no bulk viscosity.
The equal-mass binary has an initial mass of M = M1 + M2 = 106 M⊙, and we choose the initial separation to be twice the expected decoupling radius (Armitage & Natarajan 2002). Below this separation, the dynamics of the binary is governed by GW emission, while at larger distances the gaseous interaction is predominant with respect to GWs. Assuming the viscosity coefficient α = 0.1, the decoupling radius for H/R = 0.03 is 56 Rg, while for H/R = 0.1 is 22 Rg, where Rg = GM/c2 (Armitage & Natarajan 2002). We therefore start the cold and warm disc simulations with separations of a = 120 Rg and a = 60 Rg, respectively. The initial binary orbital period Pb = 2π(a3/GM)1/2 is therefore 0.47 days for the cold disc and 0.17 days for the warm one. This corresponds to an initial GW frequency of 5 × 10⁻⁵ Hz and 1.4 × 10⁻⁴ Hz, respectively, which is at the lower end of the frequency range covered by LISA.
For the simulations, we employed the code GIZMO (Hopkins 2015) in its 3D meshless finite mass (MFM) mode. In order to increase the resolution when and where necessary, without globally slowing down our simulations, we employed an on-the-fly adaptive particle-splitting approach, which is similar in spirit to the adaptive mesh refinement of grid-based codes. Such a technique represents a natural generalisation of the refinement scheme exploited by AREPO (Springel 2010) and GIZMO (Hopkins 2015) to maintain an almost constant mass per cell during a simulation in a finite-volume scheme. In this work, we exploited the particle splitting algorithm in GIZMO to split gas particles that enter a sphere of radius rref = 4a centred on the centre of mass of the binary-disc system. The refinement scheme is the same as the one adopted in Franchini et al. (2022), with a maximum refinement of a factor of 32.
Every time a gas particle approaches one of the sinks by entering its sink radius rsink = 0.05a, we flag it as eligible to be accreted. As the binary orbit is allowed to vary (Franchini et al. 2023), conservation of mass and linear and angular momentum are ensured during each accretion event, in the same way it is done in the PHANTOM code (Bate et al. 1995).
In this work, we neglected the disc self-gravity (see Franchini et al. 2021 for self-gravity treatment) and used the version of the code described in details in Franchini et al. (2022). The reason for this choice is that the inclusion of the disc self-gravity would make the evolution more complex, as other processes would come into play (e.g. cooling, gravitational instabilities), and we wanted to investigate the effect of PN corrections on the gas dynamics in the simplest possible scenario. In addition, self-gravity can be neglected for sufficiently compact binaries, for which the disc mass is negligible (see Franchini et al. 2021 for a discussion). The extension of this work to the self-gravity regime will be performed in a future study. We highlight the fact that we evolved the binary orbit (Franchini et al. 2023) considering both the interaction with the gas and the PN corrections to the binary dynamics.
2.1. Post-Newtonian corrections
We integrated the equations of motion of the binary system considering PN corrections up to the 2.5 PN order. This includes the conservative 1 PN and 2 PN terms as well as the GW emission encoded in the 2.5 PN term. We assume the MBHs that form the binary to be non-spinning. We defer the investigation of spin effects to a future work. We consider the equations of motion derived using the Lagrangian formalism of Blanchet (2014). Practically, we evolve the positions and velocities of the two particles with mass m1, m2 forward in time according to the PN accelerations only retaining terms up to 1/c5, i.e.:
 (1)
(1)
where n12 = (r1 − r2)/|r1 − r2|, v12 = (v1 − v2), while r = |r1 − r2|. We defer the reader to Eq. (203) of Blanchet (2014) for the expressions of the coefficients 𝒜xPN and ℬxPN, with the convention that the acceleration for particle 2 can be readily obtained by exchanging all the particle labels 1 ↔ 2.
The dependence of the above accelerations on the particle velocities complicates the numerical time evolution of the system, implying that a standard leap-frog integration algorithm (“kick-drift-kick”) is not well suited for integrating the PN corrections. We therefore implemented an intermediate predictor step to update the particle velocities at the end of the time step, accounting for the PN corrections, and re-enforcing the numerical stability of the integration algorithm. Our approach is similar to the one outlined in Sect. 6.2 of Liptai & Price (2019), except that we use a predictor-corrector approach instead of implementing the implicit kick-drift-kick one. We tested our numerical integration by running a simulation without the gaseous disc and comparing the merger timescale with the theoretical expectation, finding almost perfect agreement.
2.2. Spectral energy distribution
Since we are ultimately interested in understanding the potentially observable binary features in the EM emission, we compute the spectral energy distribution (SED) and the luminosity in different bands assuming black-body emission from each resolution element. In this work, we used the same method we used in Cocchiararo et al. (2024).
Although we do not explicitly include radiation pressure in our simulations, as this is quite costly, we do assume both discs to be radiation pressure dominated and therefore calculate the disc temperature from the gas pressure according to
 (2)
(2)
where σSB is the Stefan-Boltzmann constant and Tc is the disc mid-plane temperature. We calculated Tc by averaging the temperature of each particle within 0.5 H/R from the midplane (i.e. z = 0), weighting it on the local density ρ. The effective disc temperature is related with the mid-plane temperature through
 (3)
(3)
where κ = 0.4 cm2 g−1 is the electron scattering opacity and Σ is the disc surface density. We assume that only the optically thick (i.e. those with τ = κΣ ≥ 1) regions of the domain emit thermal black-body radiation. We note that we did not compute the emission coming from regions where our numerical resolution is low, i.e. we set a minimum threshold for the surface density. The main reason is that there is spurious, non-physical emission coming from the boundary between the particle’s kernel and the cavity in both the circumBH disc outer edges and the cavity wall. This might have some impact on the magnitude of the X-ray flux, but we can confidently capture variations of the X-ray flux due to the gas dynamics during the inspiral.
We assume the observer to be looking the disc face-on, neglecting any Doppler effect. We extract temperature maps from the simulation snapshots and divide the x − y plane in a grid of 800 × 800 pixels. We then calculate the luminosity produced at each frequency within the range 1014 − 1019 Hz by dividing the simulation domain into three regions: the circumBH disc region r < a, the stream region a < r < 3a, and the circumbinary disc r > 3a. We note that as a evolves the contribution to the spectrum coming from these regions changes in time.
We then produce light curves in different bands by integrating the SED over the optical (1.8 − 3.1 eV), UV (3.1 − 124.0 eV), and X-ray (124.0 eV−124 keV) bands. We finally compute the luminosity emitted by an element with a surface dS in each frequency band as
 (4)
(4)
where ν1, ν2 delimit the frequency interval. We note here that we do not model the emission coming from the corona that is supposed to form in these systems. In fact, the physics of the hot electrons constituting the corona is not captured by our simulations. Coronal emissions can be added in post-processing, assuming that a fraction of the circumBH disc’s luminosity is up-scattered by hot electrons, in analogy with standard AGNs. However, it is unclear whether such a population of diffused electrons can efficiently build up in the presence of a cavity and possibly intermittent formation of circumBH discs in MBHB systems. We therefore decided to conservatively omit this component from the emerging spectrum.
2.3. Merger and post-merger kicks
We evolve our thin and thick disc simulations through the decoupling stage until merger. The two MBHs merge into one when they reach a separation of 6 Rg, which corresponds to the Innermost Stable Circular Orbit (ISCO) for a Schwarzschild black hole. After merger, we evolve the remnant only in the thin disc case. The newly formed sink particle has a radius of 6 Rg, and we simulated two kick scenarios: one in the plane of the disc and one off plane, i.e. parallel to the disc angular momentum. For the off-plane kick velocity we chose the average of the values reported in the last column of Table 2 in Baker et al. (2008), i.e. vkick = (0, 0, vz) with vz = 530 km s−1. The in-plane kick velocity vector is instead vkick = (v0 cos ϕ, v0 sin ϕ, 0) with v0 = 94 km s−1 and ϕ = π/2; that is, we assumed MBHs to have anti-aligned spins with a magnitude of χ = 0.2 and then used the expression for vz in Eq. (4) of Baker et al. (2008).
3. Results
In this section, we present our results and discuss the effects of the disc temperature and of the PN corrections on the dynamics of the MBHB. Furthermore, we discuss the scenario where the merger remnant experiences a kick in the plane of the disc and perpendicular to it. We refer to the simulation with H/R = 0.03 as cold disc and to the H/R = 0.1 case as warm disc.
3.1. Warm disc
A fairly large number of numerical studies have recently shown that warm discs (i.e. discs with an aspect ratio of H/R ∼ 0.1) drive circular equal-mass binaries to outspiral in the Newtonian regime (Duffell et al. 2020; Muñoz et al. 2020; Tiede et al. 2020; Heath & Nixon 2020; Franchini et al. 2022). GW emission at ∼100 Rg separation scales dominates over any viscous torque, inevitably driving the binary to coalescence. Still, the presence of a positive net torque from a circumbinary disc can affect the dynamics by delaying the merger, thus introducing some modification to the phasing of the gravitational waveform.
We show the evolution of the binary semi-major axis in Fig. 1. The orange line shows the evolution of the binary in the purely Newtonian regime (Franchini et al. 2022), while the dot-dashed blue line shows the evolution obtained through the time integration of the PN terms only, i.e. neglecting the gas contribution. The cyan line shows instead the evolution that we obtain in our simulation, which includes both the gas torque and PN corrections. The effect of the gas in this regime of disc aspect ratios is that it drives the binary apart, effectively extending the inspiral phase. We note that the semi-major axis in the Newtonian simulation (orange line in Fig. 1) expands to 1.001 in 35 days. However, with a disc mass as small as 100 M⊙, we find this effect not to be strong enough to significantly delay the merger of the two MBHs. We note, however, that a tiny deviation from the evolution driven by the PN corrections can still be observed, as shown in the inset, as the cyan line departs slightly from the blue line.
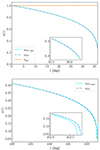 |
Fig. 1. Evolution of binary semi-major axis. The orange line shows the evolution caused by the mere interaction with the gaseous disc with H/R = 0.1 in the Newtonian simulation (see right panel of Fig. 2 in Franchini et al. 2022). The cyan line shows the evolution including both the PN corrections and the gaseous torque, while the blue dot-dashed line shows the evolution caused by PN corrections only. The inset shows the deviation due to the gas torque on the binary. The upper panel refers to the warm disc simulation, where the gas is expanding the binary, while the lower panel shows the cold disc case, where the binary inspiral is aided by the gaseous disc. |
Even though the effect of gas on the binary semi-major axis evolution is not significant in this case, there might be a non-negligible effect in terms of the orbital phase of the binary. We traced the evolution of the orbital phase over time in the warm disc simulation to infer whether the presence of the gaseous disc induces identifiable phase shifts with respect to the PN-only evolution. The results are shown in the upper panel of Fig. 2, where the cyan and dot-dashed lines show the phase in the simulation with and without the gaseous disc, respectively. Although the effect is small, the presence of a warm disc causes a delay in the coalescence of the binary. As an illustrative example, we consider the delay accumulated starting from five days prior to merger. At this point, an equal-mass binary with a total mass of 106 M⊙ is emitting at a frequency of ≈1.6 × 10⁻⁴ Hz, and starts to be resolvable by LISA. Within these last five days, the torques from the warm disc cause a delay in the merger of about ten seconds. Considering the binary orbital frequency five days prior to the merger, this implies a phase shift of 0.005 rad.
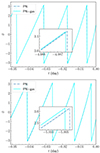 |
Fig. 2. Orbital phase shift between run with warm (upper panel) and cold (lower panel) gaseous disc contribution to the binary evolution (cyan line) and the one where we only integrate the PN binary orbit (blue dot-dashed line). The inset shows a zoomed-in view of the dephasing five days prior to merger. |
Figure 3 shows column-density maps of the circumbinary disc surrounding the MBHB starting from 30.4 days (upper left panel) prior to merger all the way down to the instant right before merger (lower right panel). The decoupling should occur at around ten days but we find the gaseous disc to be able to feed material to the binary down to ∼1 day from the merger. We can clearly see from the last panel of Fig. 3 that the discs around the binary components disappear within the last day prior to the merger, as the disc is not able to follow the inspiral any longer. We can therefore possibly expect some sort of EM precursor, at least in the case of warm discs, as the X-ray emission coming from the material inside r = a disappears.
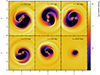 |
Fig. 3. Column-density maps of the warm disc simulation. The disc has an aspect ratio of H/R = 0.1. The six panels show the system starting from 30.4 days prior to the merger. The dashed green circle shows the initial binary orbit. |
3.2. Cold disc
Previous numerical investigations of the interaction between a MBHB and a cold disc have shown that the disc torque is negative and therefore contributes to the inspiral of the binary (Tiede et al. 2020; Heath & Nixon 2020; Franchini et al. 2022). We therefore expect the presence of the circumbinary disc to speed-up the coalescence process compared to pure PN dynamics in this case.
The binary takes about 450 days to coalesce from an initial separation of 120 Rg (bottom panel inset of Fig. 1). The difference in the merger timescale owing to the presence of the gas, computed comparing the cold disc simulation to a simple integration of the binary orbit without the gaseous disc, is around 0.02%, meaning that the presence of the gas brings the two MBHs to coalescence about two hours earlier compared to pure PN dynamics. Thus, the presence of the gas has a more significant impact on the evolution of the system with respect to the warm disc case. In particular, the lower panel of Fig. 2 shows that the disc torques anticipate the merger by about 130 s in the last five days prior to the merger. This corresponds to a difference of about 0.14 rad in the phasing of the waveform, as shown in the inset of the bottom panel in Fig. 2.
Figure 4 shows the column-density maps of the circumbinary disc surrounding the MBHB starting from 30.4 days prior to merger, which corresponds to a phase where the binary should have already decoupled from the gaseous disc. The last panel shows the disc right before merger. The over-density, or “lump” (Shi et al. 2012; Farris et al. 2014; Ragusa et al. 2016), persists down to the very last stages of the merger, even though the gaseous disc is expected to have decoupled from the binary. The circumBH discs are not present, because in this regime of disc aspect ratios there is not enough material that flows inside the cavity to be able to resolve the disc’s structures in the case of constant α discs, as the ones that are treated in this work.
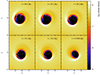 |
Fig. 4. Column-density maps of the cold disc simulation. The disc has an aspect ratio of H/R = 0.03. The six panels show the system starting from 30.4 days prior to the merger. The dashed green circle shows the initial binary orbit. |
3.3. Post-merger kicks
We investigated the accretion onto the merger remnant, considering that it may be subject to post-merger kicks (Baker et al. 2008; Rossi et al. 2010). We present the results of the in-plane and off-plane kicks in the cold disc simulation only as this is possibly the most interesting case due to the highly eccentric cavity.
In the case of an in-plane kick along the y-axis, the remnant moves towards the cavity pericentre, i.e. upwards with respect to the plane centre in the bottom right panel of Fig. 4. We find the cavity becomes more circular and progressively smaller, although on a slower timescale compared to the motion of the remnant. The kick along the z-axis instead causes the disc to fill the cavity on a slightly shorter timescale and then to follow the remnant dynamics, starting from the inner parts.
Figure 5 shows the accretion rate, traced over the entire duration of the cold disc simulation, for both the in-plane (green line) and off-plane (purple line) kick scenarios. This is scaled by the initial accretion rate in the Newtonian simulation. However, when scaled to physical values, the accretion rate is ∼ 10 ṀEdd and ∼ 103 ṀEdd in the cold and warm disc simulations, respectively. The accretion rate in the off-plane kick case increases more rapidly as, once the remnant starts moving rapidly along the z-axis, the inner parts of the disc quickly follow its off-plane motion. The in-plane kick, however, is along the y-axis and has a smaller velocity. The merger remnant then moves slowly towards the cavity pericentre (see bottom right panel of Fig. 4) and accretes at a much slower rate because of the cavity remaining eccentric and wider for longer. We note that we find the cavity eccentricity to increase with time, reaching its peak (edisc = 0.6) at the merger.
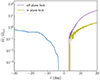 |
Fig. 5. Accretion rate in units of binary accretion rate at t = 0 (corresponding to a = 100 Rg) as a function of time. The blue curve represents the binary accretion rate until merger, while the purple and green lines show the accretion rate of the MBH remnant following the off-plane and in-plane kick, respectively. |
Furthermore, we can clearly see from Fig. 5 that the binary accretion rate drops by several orders of magnitude, consistently with the results presented in Farris et al. (2015a), at merger (as expected), to increase again by several orders of magnitude after the merger, the slope depending on whether the kick experienced by the remnant is in plane or perpendicular to the disc plane. We find that there is an ∼1 day delay in the onset of the accretion onto the remnant between the off-plane and in-plane kick cases.
3.4. Electromagnetic signatures
In this section, we discuss the possible EM signatures of MBHBs before their merger.
3.4.1. Spectral energy distribution
We show the SEDs obtained from the warm and cold disc simulations in the left and right panel of Fig. 6, respectively. The black dot-dashed line shows the SED 30.4 days before merger for the warm and cold disc simulation, while the solid grey lines show the total SED at the last stage before merger (i.e. bottom right panels of Figs. 3 and 4). The blue dashed, purple dot-dashed, and pink dotted lines show the contribution to the SED from radii r < a, a < r < 3a and r > 3a, respectively, right before merger. We note that the circumBH disc’s contribution (blue dashed line) is absent in both cases as prior to merger there is no material close enough to the binary to emit in the X-rays.
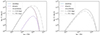 |
Fig. 6. Spectrum of black-body emission from warm (left panel) and cold (right panel) disc. The dot-dashed black line shows the SED 30.4 days prior to merger for both simulations. The straight grey line shows the total SED right before merger. The blue dashed, purple dot-dashed, and pink dotted lines show the contribution from different regions of the disc 0.03 days before merger. The dashed blue line shows the contribution of the disc inside r = a, which is absent in the pre-merger spectra, while it contributes significantly to the X-ray flux of the initial (i.e. t = 30.4 days) warm disc spectrum. The purple dot-dashed line shows the contribution from the gas at radii a < r < 3a, while the dotted pink line shows the circumbinary disc contribution. |
We show the effective temperature we used to compute the SEDs −30.4 days prior to merger and 0.03 days before merger- in Fig. 7. The upper panels refer to the warm disc case, while the lower panels show the temperature map in the cold disc case. These maps reflect the characteristics of the spectra shown in Fig. 6.
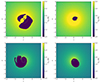 |
Fig. 7. Maps of effective temperature Teff for warm (upper panels) and cold (bottom panels) disc simulation. The dashed circle encloses the binary orbit, following the binary inspiral. |
In the warm disc case (left panel of Fig. 6), the emission becomes dominated by the gas outside r = 3a within the last 0.03 days as the circumBH discs are accreted onto the binary components and the circumbinary disc has decoupled from the binary without being able to supply more material into the cavity. The pre-merger spectrum therefore peaks in the optical-UV and shows no X-ray tail. We can indeed see from the upper right panel of Fig. 7 that the X-ray emission region is significantly reduced right before merger.
In the cold disc case (right panel of Fig. 6) the cavity remains very eccentric even at the merger. As the cavity closes around the binary, the over-density at the cavity edge becomes warmer, leading to an increase in the UV flux by a factor of two in ten days following the merger. The optical flux remains roughly constant.
The bottom right panel of Fig. 7 shows that the slight increase in the UV flux in the spectrum (i.e. grey line in the right panel of Fig. 6) is caused by a slightly more extended warm region at the cavity edge right before merger, as the cavity is closing around the coalescing binary.
We note that our SEDs are somewhat different compared to the previously calculated spectra in Farris et al. (2015b) as we do not predict emission in the hard X-ray band. This might be due to the different choices of the equation of state (locally isothermal vs. adiabatic). Furthermore, the 3D nature of our simulations might also have an impact on the spectra compared to previous 2D numerical simulations.
3.4.2. Emission at different wavelengths
Since the variations in the SED of these systems might be difficult to detect, it is important to investigate the EM emission at different wavelengths and how this changes approaching the merger. In particular, as the gaseous disc decouples from the binary, we expect the high-energy emission to decrease as the spectrum peak shifts towards lower frequencies.
Figure 8 shows the luminosity emitted in each frequency band: optical (1.8 − 3.1 eV), UV (3.1 − 124 eV), and X-rays (124 eV−124 keV) for the warm (left panel) and cold (right panel) disc simulations as a function of time. The negative times refer to the pre-merger evolution.
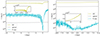 |
Fig. 8. Fraction of total luminosity emitted by the whole simulation domain in different bands, for the warm (upper) and cold (lower) disc simulation. |
The first clear difference between the warm and cold disc cases, i.e. between the left and right panel of Fig. 8, respectively, is that initially (i.e. 30.4 days prior to merger) the flux in the X-ray band is more prominent in the warm disc case, while in the cold disc simulation it is essentially negligible. The reason for such low values of X-ray fluxes in the cold disc case is that the cavity optical depth is extremely small, and we therefore cannot apply our black-body approximation to compute the emitted flux. The UV emission is, however, predominant in both cases, which is consistent with the spectra in Fig. 6 that shows the peak to be shifted towards UV-optical frequencies. This emission increases by roughly a factor of two in both cases but on a shorter timescale, i.e., within two days following the merger, in the warm disc case. This difference is likely due to the fact that the cavity in the warm disc case is significantly less eccentric and smaller, and therefore it is closer to the merger remnant. In the cold disc case, instead, the cavity is very eccentric and takes longer to close around the merger remnant, therefore delaying the rise in the UV flux.
In the warm disc case, we can see that roughly one day before merger the X-ray flux drops by at least two orders of magnitude, consistently with the drop in the accretion rate onto the binary, while the increase in UV and optical flux is milder. The optical flux remains roughly constant and significantly subdominant compared to the UV emission.
The cold disc case shows a different behaviour, where the UV flux increases at merger, together with the X-ray flux (see right panel of Fig. 8) as the cavity closes around the remnant. We note that we tested the dependence of our results on the resolution inside the cavity in this case, increasing the refinement by a factor of four in order to better resolve the emission from the circumBH discs. We find the X-ray flux to change by at most an order of magnitude, therefore remaining much lower than the UV/optical flux. We therefore caution that the magnitude of the X-ray flux is sensitive to our resolution inside the cavity. We can, however, capture variations in the X-ray flux, which is ultimately one of the possible EM imprints of the presence of a MBHB, regardless of the resolution inside the cavity.
Finally, we identified two periodic modulations of the flux: one on the orbital period of the binary and the other on the period associated with the motion of the over-density located at the cavity edge (i.e. around five times the orbital period). These are both expected in equal-mass binaries fed from a circumbinary disc (Duffell et al. 2020; Muñoz et al. 2019). We find these modulations to be more evident in the UV and X-ray bands. However, we find that they can also be identified in the optical band, which is targeted by the current ZTF (Bellm et al. 2019) survey and by the upcoming Vera Rubin Observatory (Ivezić et al. 2019). Figure 9 shows the spectrogram of the optical flux for the warm disc simulation. The binary orbital period modulation is slightly stronger in the UV and X-ray band than in the optical. The over-density modulation is also stronger in the UV and in the X-rays than in the optical. However, we show the optical periodogram as this is the most interesting frequency band for current surveys such as ZTF and the Vera Rubin Observatory (see Cocchiararo et al. 2024 for more details). We note that the strength of the modulation on the orbital period decreases with time towards the merger as our time-sampling rate becomes too sparse to resolve the binary orbital period. The cold disc simulation shows similar features that do not evolve with time as the cavity is further away from the binary orbit, and therefore the gas motion is not strongly influenced by its inspiral.
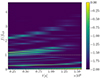 |
Fig. 9. Spectrogram of flux in the optical band for the warm disc simulation. The dashed grey line marks the initial binary orbital frequency. |
4. Conclusions
In this work, we investigated the dynamics and emission properties of a coalescing 106 M⊙ MBHB embedded in a 100 M⊙ circumbinary disc following the inspiral with up to 2.5 PN correction to the binary dynamics. We ran two numerical simulations with different disc temperatures (i.e. different disc aspect ratio) in order to understand the type of emission that we could expect to detect in the two cases. We used the 3D hydrodynamics code GIZMO in MFM mode with hyper-Largangian refinement in order to properly resolve the circumBH discs and therefore their emission. We also follow the dynamics of the MBH remnant after merger and investigate the effect that an off-plane and in-plane kicks have on the accretion rate.
We compared the evolution of the binary semi-major axis in both simulations to the evolution due solely to the PN terms, without the gas contribution. We find the difference to be negligible in the warm disc case, while in the cold disc case the binary merges on a timescale shorter by ∼2 h in the presence of the gaseous, cold circumbinary disc.
We also compared the evolution of the orbital phase of the binary in the warm and cold disc simulation, finding a phase shift, caused by the presence of the gaseous disc, of about 0.005 rad and 0.14 rad, respectively (see insets of both panels in Fig. 2). We might be able to obtain a more precise estimate of the observability of this phase shift by calculating the useful cycles, which is a signal-to-noise-ratio-dependent quantity (Sampson et al. 2014). The detailed investigation of the detectability of this effect is the subject of a future work, but our simulation suggests that the presence of a dense, cold circumbinary disc might leave appreciable imprints in the GW waveform also beyond decoupling.
We computed SEDs from the optically thick regions of the domain. We then integrated the flux over the whole radial domain and obtained the light curves in different bands: optical, UV, and X-rays. We find the shape of the SED to change significantly towards the merger, with the X-ray flux disappearing in the warm disc case and the UV flux moderately rising in the cold disc case. Consistently, we find the same behaviour in the light curves, where the decrease in the X-ray flux at the merger by two orders of magnitude is accompanied by a factor of two increase in the UV flux. The decrease in the X-ray flux is likely associated with the disappearing of the circumBH discs. We note that the drop in the X-ray flux we find is similar to the one reported by Major Krauth et al. (2023) and Dittmann et al. (2023). Since we continue to evolve the system after the merger, the cavity closes around the merger remnant quite rapidly as the disc is viscous, therefore restoring the X-ray emission. The cold disc case, on the other hand, shows a very mild variation in the subdominant X-ray flux and a corresponding increase by a factor of two in the UV flux after the merger. In this case, the rise in UV flux is slower compared to the warm disc case, and it is due to the cavity being wider and the disc being colder and hence less viscous, which results in a longer time needed to fill the cavity around the remnant. We also note that, in the warm disc case, our initial spectrum peaks at a lower frequency compared to the spectrum presented in Tang et al. (2018). This is possibly due to the different choice of the equation of state, i.e. locally isothermal (this work) or adiabatic (Tang et al. 2018). However, pinpointing the cause for this discrepancy is not straightforward as our simulations are 3D and therefore not directly comparable with 2D runs (Duffell et al. 2024).
Finally, we looked into periodicities in the UV, optical, and X-ray fluxes, finding two characteristic modulations in all bands: one on the binary orbital period and one on the timescale of the precession of the over-density at the cavity edge. The first is more important in the warm disc simulation as there is significantly more material in the circumBH discs with respect to the cold disc simulation. The latter super-orbital modulation is instead slightly more prominent in the cold disc case. Even though these modulations are more easily detectable in the high-energy bands (UV and X-rays), they also appear in the optical band, making it possible for surveys such as ZTF and the Legacy Survey of Space and Time (with the Vera Rubin Observatory) to identify MBHB candidates prior to their merger.
We note that since we performed convergence tests in our previous work (Franchini et al. 2022), we do not repeat those tests with PN corrections as we reached a sufficient resolution for the torque’s value to converge.
Acknowledgments
We are grateful to the anonymous referee for providing useful comments that allowed to significantly improve the quality of the manuscript. We thank Fabiola Cocchiararo for useful discussions. A.F. and A.S. acknowledge financial support provided under the European Union’s H2020 ERC Consolidator Grant “Binary Massive Black Hole Astrophysics” (B Massive, Grant Agreement: 818691). M.B. acknowledges support provided by MUR under grant “PNRR – Missione 4 Istruzione e Ricerca – Componente 2 Dalla Ricerca all’Impresa – Investimento 1.2 Finanziamento di progetti presentati da giovani ricercatori ID:SOE_0163” and by University of Milano-Bicocca under grant “2022-NAZ-0482/B”.
References
- Afzal, A., Agazie, G., Anumarlapudi, A., et al. 2023, ApJ, 951, L11 [NASA ADS] [CrossRef] [Google Scholar]
- Agazie, G., Anumarlapudi, A., Archibald, A. M., et al. 2023a, ApJ, 951, L8 [NASA ADS] [CrossRef] [Google Scholar]
- Agazie, G., Alam, M. F., Anumarlapudi, A., et al. 2023b, ApJ, 951, L9 [CrossRef] [Google Scholar]
- Agazie, G., Anumarlapudi, A., Archibald, A. M., et al. 2023c, ApJ, 951, L10 [CrossRef] [Google Scholar]
- Amaro-Seoane, P., Andrews, J., Arca Sedda, M., et al. 2023, Liv. Rev. Relat., 26, 2 [NASA ADS] [CrossRef] [Google Scholar]
- Antoniadis, J., Arumugam, P., Arumugam, S., et al. 2023a, A&A, 678, A50 [CrossRef] [EDP Sciences] [Google Scholar]
- Antoniadis, J., Babak, S., Bak Nielsen, A. S., et al. 2023b, A&A, 678, A48 [Google Scholar]
- Antoniadis, J., Arumugam, P., Arumugam, S., et al. 2023c, A&A, 678, A49 [Google Scholar]
- Antoniadis, J., Arumugam, P., Arumugam, S., et al. 2023d, arXiv e-prints [arXiv:2306.16226] [Google Scholar]
- Armitage, P. J., & Natarajan, P. 2002, ApJ, 567, L9 [NASA ADS] [CrossRef] [Google Scholar]
- Baker, J. G., Boggs, W. D., Centrella, J., et al. 2008, ApJ, 682, L29 [NASA ADS] [CrossRef] [Google Scholar]
- Bate, M. R., Bonnell, I. A., & Price, N. M. 1995, MNRAS, 277, 362 [Google Scholar]
- Begelman, M. C., Blandford, R. D., & Rees, M. J. 1980, Nature, 287, 307 [Google Scholar]
- Bellm, E. C., Kulkarni, S. R., Graham, M. J., et al. 2019, PASP, 131, 018002 [Google Scholar]
- Blanchet, L. 2014, Liv. Rev. Relat., 17, 2 [NASA ADS] [CrossRef] [Google Scholar]
- Bogdanović, T., Miller, M. C., & Blecha, L. 2022, Liv. Rev. Relat., 25, 3 [Google Scholar]
- Bortolas, E., Franchini, A., Bonetti, M., & Sesana, A. 2021, ApJ, 918, L15 [NASA ADS] [CrossRef] [Google Scholar]
- Bowen, D. B., Campanelli, M., Krolik, J. H., Mewes, V., & Noble, S. C. 2017, ApJ, 838, 42 [CrossRef] [Google Scholar]
- Cocchiararo, F., Franchini, A., Lupi, A., & Sesana, A. 2024, A&A, submitted [arXiv:2402.05175] [Google Scholar]
- Cuadra, J., Armitage, P. J., Alexander, R. D., & Begelman, M. C. 2009, MNRAS, 393, 1423 [Google Scholar]
- d’Ascoli, S., Noble, S. C., Bowen, D. B., et al. 2018, ApJ, 865, 140 [CrossRef] [Google Scholar]
- Dittmann, A. J., Ryan, G., & Miller, M. C. 2023, ApJ, 949, L30 [NASA ADS] [CrossRef] [Google Scholar]
- Dotti, M., Colpi, M., Haardt, F., & Mayer, L. 2007, MNRAS, 379, 956 [NASA ADS] [CrossRef] [Google Scholar]
- Duffell, P. C., D’Orazio, D., Derdzinski, A., et al. 2020, ApJ, 901, 25 [NASA ADS] [CrossRef] [Google Scholar]
- Duffell, P. C., Dittmann, A. J., D’Orazio, D. J., et al. 2024, ApJ, submitted [arXiv:2402.13039] [Google Scholar]
- EPTA Collaboration and InPTA Collaboration (Antoniadis, J., et al.) 2024, A&A, 685, A94 [NASA ADS] [CrossRef] [EDP Sciences] [Google Scholar]
- Escala, A., Larson, R. B., Coppi, P. S., & Mardones, D. 2005, ApJ, 630, 152 [Google Scholar]
- Farris, B. D., Duffell, P., MacFadyen, A. I., & Haiman, Z. 2014, ApJ, 783, 134 [NASA ADS] [CrossRef] [Google Scholar]
- Farris, B. D., Duffell, P., MacFadyen, A. I., & Haiman, Z. 2015a, MNRAS, 447, L80 [NASA ADS] [CrossRef] [Google Scholar]
- Farris, B. D., Duffell, P., MacFadyen, A. I., & Haiman, Z. 2015b, MNRAS, 446, L36 [NASA ADS] [CrossRef] [Google Scholar]
- Franchini, A., Sesana, A., & Dotti, M. 2021, MNRAS, 507, 1458 [NASA ADS] [Google Scholar]
- Franchini, A., Lupi, A., & Sesana, A. 2022, ApJ, 929, L13 [NASA ADS] [CrossRef] [Google Scholar]
- Franchini, A., Lupi, A., Sesana, A., & Haiman, Z. 2023, MNRAS, 522, 1569 [NASA ADS] [CrossRef] [Google Scholar]
- Gualandris, A., Read, J. I., Dehnen, W., & Bortolas, E. 2017, MNRAS, 464, 2301 [Google Scholar]
- Heath, R. M., & Nixon, C. J. 2020, A&A, 641, A64 [NASA ADS] [CrossRef] [EDP Sciences] [Google Scholar]
- Hopkins, P. F. 2015, MNRAS, 450, 53 [Google Scholar]
- Hopkins, P. F. 2016, MNRAS, 462, 576 [NASA ADS] [CrossRef] [Google Scholar]
- Ivezić, Ž., Kahn, S. M., Tyson, J. A., et al. 2019, ApJ, 873, 111 [Google Scholar]
- Khan, F. M., Just, A., & Merritt, D. 2011, ApJ, 732, 89 [Google Scholar]
- Kormendy, J., & Ho, L. C. 2013, ARA&A, 51, 511 [Google Scholar]
- Liptai, D., & Price, D. J. 2019, MNRAS, 485, 819 [NASA ADS] [CrossRef] [Google Scholar]
- Lodato, G., Nayakshin, S., King, A. R., & Pringle, J. E. 2009, MNRAS, 398, 1392 [NASA ADS] [CrossRef] [Google Scholar]
- MacFadyen, A. I., & Milosavljević, M. 2008, ApJ, 672, 83 [Google Scholar]
- Major Krauth, L., Davelaar, J., Haiman, Z., et al. 2023, MNRAS, 526, 5441 [NASA ADS] [CrossRef] [Google Scholar]
- Muñoz, D. J., Miranda, R., & Lai, D. 2019, ApJ, 871, 84 [CrossRef] [Google Scholar]
- Muñoz, D. J., Lai, D., Kratter, K., & Miranda, R. 2020, ApJ, 889, 114 [Google Scholar]
- Peters, P. C. 1964, Phys. Rev., 136, 1224 [Google Scholar]
- Ragusa, E., Lodato, G., & Price, D. J. 2016, MNRAS, 460, 1243 [CrossRef] [Google Scholar]
- Reardon, D. J., Zic, A., Shannon, R. M., et al. 2023, ApJ, 951, L6 [NASA ADS] [CrossRef] [Google Scholar]
- Roedig, C., & Sesana, A. 2014, MNRAS, 439, 3476 [Google Scholar]
- Rossi, E. M., Lodato, G., Armitage, P. J., Pringle, J. E., & King, A. R. 2010, MNRAS, 401, 2021 [NASA ADS] [CrossRef] [Google Scholar]
- Sampson, L., Yunes, N., Cornish, N., et al. 2014, Phys. Rev. D, 90, 124091 [NASA ADS] [CrossRef] [Google Scholar]
- Shakura, N. I., & Sunyaev, R. A. 1973, A&A, 24, 337 [NASA ADS] [Google Scholar]
- Shi, J.-M., Krolik, J. H., Lubow, S. H., & Hawley, J. F. 2012, ApJ, 749, 118 [Google Scholar]
- Smarra, C., Goncharov, B., Barausse, E., et al. 2023, Phys. Rev. Lett., 131, 171001 [NASA ADS] [CrossRef] [Google Scholar]
- Springel, V. 2010, ARA&A, 48, 391 [NASA ADS] [CrossRef] [Google Scholar]
- Tanaka, T., Perna, R., & Haiman, Z. 2012, MNRAS, 425, 2974 [CrossRef] [Google Scholar]
- Tang, Y., Haiman, Z., & MacFadyen, A. 2018, MNRAS, 476, 2249 [NASA ADS] [CrossRef] [Google Scholar]
- Tiede, C., Zrake, J., MacFadyen, A., & Haiman, Z. 2020, ApJ, 900, 43 [NASA ADS] [CrossRef] [Google Scholar]
- Varisco, L., Bortolas, E., Dotti, M., & Sesana, A. 2021, MNRAS, 508, 1533 [NASA ADS] [CrossRef] [Google Scholar]
- Vasiliev, E. 2016, Star Clusters and Black Holes in Galaxies across Cosmic Time, Proceedings of the International Astronomical Union, IAU Symposium, 312, 92 [Google Scholar]
- Xu, H., Chen, S., Guo, Y., et al. 2023, Res. Astron. Astrophys., 23, 075024 [CrossRef] [Google Scholar]
All Figures
|
Fig. 1. Evolution of binary semi-major axis. The orange line shows the evolution caused by the mere interaction with the gaseous disc with H/R = 0.1 in the Newtonian simulation (see right panel of Fig. 2 in Franchini et al. 2022). The cyan line shows the evolution including both the PN corrections and the gaseous torque, while the blue dot-dashed line shows the evolution caused by PN corrections only. The inset shows the deviation due to the gas torque on the binary. The upper panel refers to the warm disc simulation, where the gas is expanding the binary, while the lower panel shows the cold disc case, where the binary inspiral is aided by the gaseous disc. |
| In the text | |
|
Fig. 2. Orbital phase shift between run with warm (upper panel) and cold (lower panel) gaseous disc contribution to the binary evolution (cyan line) and the one where we only integrate the PN binary orbit (blue dot-dashed line). The inset shows a zoomed-in view of the dephasing five days prior to merger. |
| In the text | |
|
Fig. 3. Column-density maps of the warm disc simulation. The disc has an aspect ratio of H/R = 0.1. The six panels show the system starting from 30.4 days prior to the merger. The dashed green circle shows the initial binary orbit. |
| In the text | |
|
Fig. 4. Column-density maps of the cold disc simulation. The disc has an aspect ratio of H/R = 0.03. The six panels show the system starting from 30.4 days prior to the merger. The dashed green circle shows the initial binary orbit. |
| In the text | |
|
Fig. 5. Accretion rate in units of binary accretion rate at t = 0 (corresponding to a = 100 Rg) as a function of time. The blue curve represents the binary accretion rate until merger, while the purple and green lines show the accretion rate of the MBH remnant following the off-plane and in-plane kick, respectively. |
| In the text | |
|
Fig. 6. Spectrum of black-body emission from warm (left panel) and cold (right panel) disc. The dot-dashed black line shows the SED 30.4 days prior to merger for both simulations. The straight grey line shows the total SED right before merger. The blue dashed, purple dot-dashed, and pink dotted lines show the contribution from different regions of the disc 0.03 days before merger. The dashed blue line shows the contribution of the disc inside r = a, which is absent in the pre-merger spectra, while it contributes significantly to the X-ray flux of the initial (i.e. t = 30.4 days) warm disc spectrum. The purple dot-dashed line shows the contribution from the gas at radii a < r < 3a, while the dotted pink line shows the circumbinary disc contribution. |
| In the text | |
|
Fig. 7. Maps of effective temperature Teff for warm (upper panels) and cold (bottom panels) disc simulation. The dashed circle encloses the binary orbit, following the binary inspiral. |
| In the text | |
|
Fig. 8. Fraction of total luminosity emitted by the whole simulation domain in different bands, for the warm (upper) and cold (lower) disc simulation. |
| In the text | |
|
Fig. 9. Spectrogram of flux in the optical band for the warm disc simulation. The dashed grey line marks the initial binary orbital frequency. |
| In the text | |
Current usage metrics show cumulative count of Article Views (full-text article views including HTML views, PDF and ePub downloads, according to the available data) and Abstracts Views on Vision4Press platform.
Data correspond to usage on the plateform after 2015. The current usage metrics is available 48-96 hours after online publication and is updated daily on week days.
Initial download of the metrics may take a while.