Open Access
Fig. 5.
Download original image
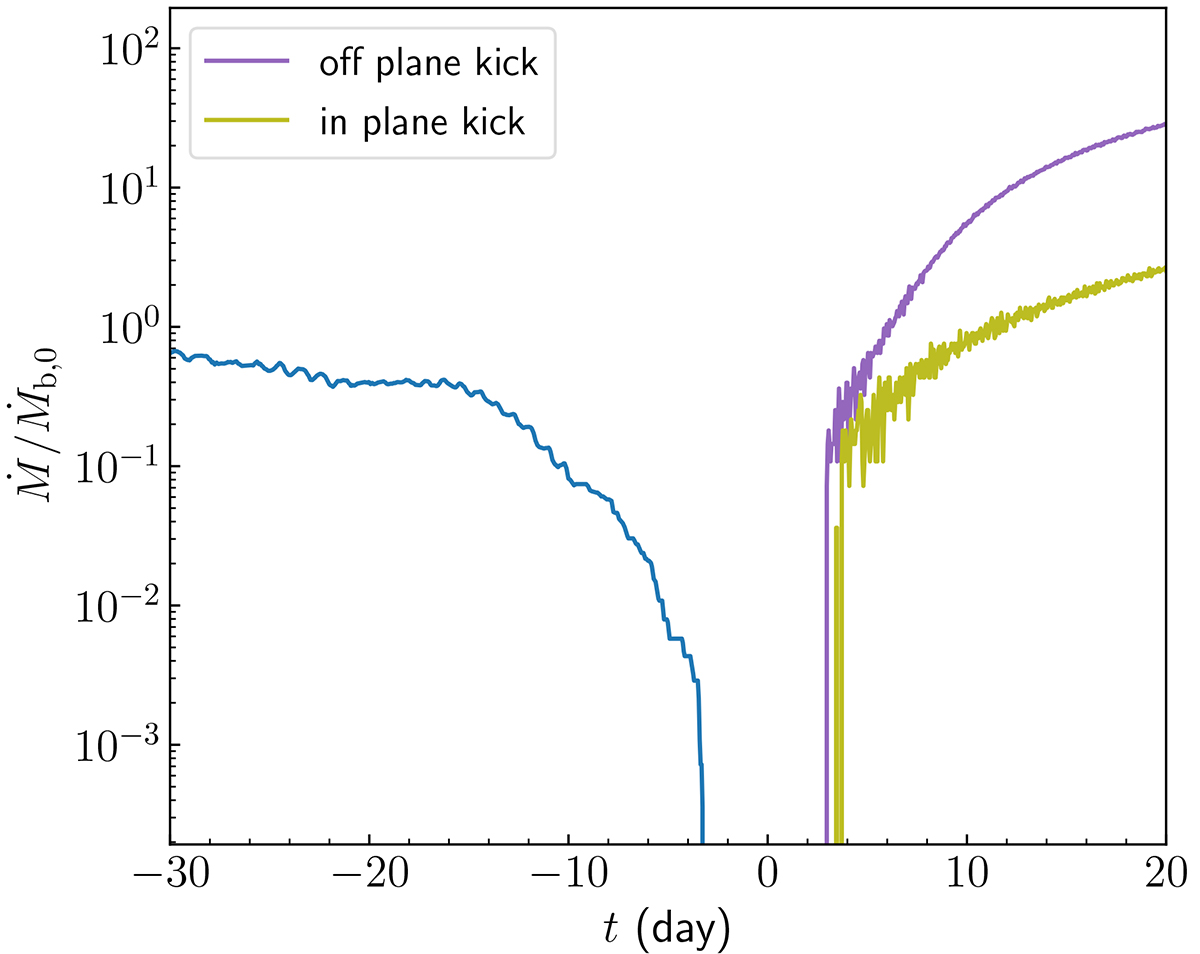
Accretion rate in units of binary accretion rate at t = 0 (corresponding to a = 100 Rg) as a function of time. The blue curve represents the binary accretion rate until merger, while the purple and green lines show the accretion rate of the MBH remnant following the off-plane and in-plane kick, respectively.
Current usage metrics show cumulative count of Article Views (full-text article views including HTML views, PDF and ePub downloads, according to the available data) and Abstracts Views on Vision4Press platform.
Data correspond to usage on the plateform after 2015. The current usage metrics is available 48-96 hours after online publication and is updated daily on week days.
Initial download of the metrics may take a while.