Fig. 6.
Download original image
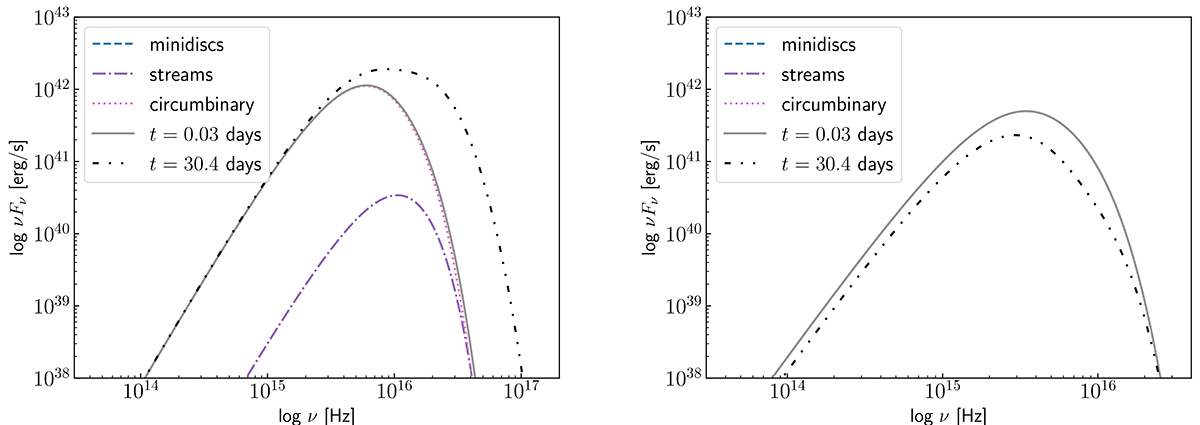
Spectrum of black-body emission from warm (left panel) and cold (right panel) disc. The dot-dashed black line shows the SED 30.4 days prior to merger for both simulations. The straight grey line shows the total SED right before merger. The blue dashed, purple dot-dashed, and pink dotted lines show the contribution from different regions of the disc 0.03 days before merger. The dashed blue line shows the contribution of the disc inside r = a, which is absent in the pre-merger spectra, while it contributes significantly to the X-ray flux of the initial (i.e. t = 30.4 days) warm disc spectrum. The purple dot-dashed line shows the contribution from the gas at radii a < r < 3a, while the dotted pink line shows the circumbinary disc contribution.
Current usage metrics show cumulative count of Article Views (full-text article views including HTML views, PDF and ePub downloads, according to the available data) and Abstracts Views on Vision4Press platform.
Data correspond to usage on the plateform after 2015. The current usage metrics is available 48-96 hours after online publication and is updated daily on week days.
Initial download of the metrics may take a while.