| Issue |
A&A
Volume 685, May 2024
|
|
|---|---|---|
| Article Number | A157 | |
| Number of page(s) | 20 | |
| Section | Extragalactic astronomy | |
| DOI | https://doi.org/10.1051/0004-6361/202348080 | |
| Published online | 20 May 2024 | |
Search for radio halos in starburst galaxies
1
Instituto Argentino de Radioastronomía (CONICET–CIC–UNLP), C.C.5, (1984) Villa Elisa, Buenos Aires, Argentina
e-mail: This email address is being protected from spambots. You need JavaScript enabled to view it.
2
Facultad de Ciencias Astronómicas y Geofísicas, Universidad Nacional de La Plata, Paseo del Bosque s/n, 1900 La Plata, Argentina
Received:
26
September
2023
Accepted:
26
February
2024
Abstract
Context. Starburst galaxies are undergoing intense episodes of star formation. In these galaxies, gas is ejected into the surrounding environment through winds created by the effect of hot stars and supernova explosions. When interacting with the intergalactic medium, these winds can produce strong shocks capable of accelerating cosmic rays. The radiation from these cosmic rays mainly occurs in radio and gamma rays. The radio halo can be characterized using the scale height, which is an important parameter for understanding cosmic ray acceleration and transport.
Aims. We searched for the presence of radio halos in a sample of edge-on starburst galaxies gathered from the MeerKAT 1.28 GHz Atlas of Southern Sources in the IRAS Revised Bright Galaxy Sample. The investigation of how the radio halos relate to the global properties of the galaxies can shed light on the understanding of the halo origin and the underlying cosmic ray population.
Methods. We selected a sample of 25 galaxies with inclinations i > 80° from the original sample and modeled their disk and halo contributions. We determined the scale heights and the radio luminosity of the halos when detected.
Results. We have detected and characterized 11 radio halos from a sample of 25 edge-on galaxies. Seven of them are reported here for the first time. The average radio scale height is ∼1 kpc. We found that the halo scale heights increase linearly with the radio diameters and this relation does not depend on the star formation rate. All galaxies in our sample follow the radio-infrared relation with a q parameter value of 2.5 ± 0.1. The halo luminosity linearly increases with the infrared luminosity and star formation rate.
Conclusions. The dependence of the halo luminosity on the star formation rate and the infrared luminosity supports the hypothesis that the radio halos are the result of synchrotron radiation produced by relativistic electrons and points toward the fact that the star formation activity plays a crucial role in halo creation. The average scale height of 1 kpc implies a dynamical range of 4 Myr, several orders of magnitude greater than the synchrotron losses for electrons of 10 TeV. This suggests that some process must exist to reaccelerate cosmic rays in the halo if gamma-ray emission of a leptonic origin is detected from the halo. According to the relation between the radio and gamma-ray luminosities, we found that NGC 4666 is a potential gamma-ray source for future observations.
Key words: galaxies: halos / galaxies: starburst / radio continuum: galaxies
© The Authors 2024
 Open Access article, published by EDP Sciences, under the terms of the Creative Commons Attribution License (https://creativecommons.org/licenses/by/4.0), which permits unrestricted use, distribution, and reproduction in any medium, provided the original work is properly cited.
This article is published in open access under the Subscribe to Open model. This email address is being protected from spambots. You need JavaScript enabled to view it. to support open access publication.
1. Introduction
Starburst galaxies are characterized by undergoing an intense and rapid burst of star formation in their disks. This rate can be several times or even hundreds of times higher than that of normal galaxies (e.g., Milky Way ∼1 M⊙ yr−1, Robitaille & Whitney 2010). The high star formation rates (SFRs) are only possible if abundant gas feeds the process. Dust heated by the young stars reprocesses the radiation, which is then reemitted in the infrared (IR). This is why these galaxies are very luminous in the IR, reaching values larger than 1010 L⊙.
Massive young stars eject hot gas through their winds into the surrounding medium, creating a hot bubble around the star-forming region. Supernova explosions also contribute to heating the gas and increasing the pressure inside the bubble. Cold gas is pushed away, and the bubble eventually bursts. The hot gas, heated to temperatures of T ∼ 108 K by supernova shocks, is unbound by the gravitational potential because its temperature is greater than the local escape temperature. The gas then expands adiabatically, becomes supersonic at the edge of the starburst region, and finally escapes from the disk, sweeping up cooler and denser gas. In the process, some of the cold gas and cosmic rays originally accelerated by the shocks within the starburst region are transported away from the disk, forming a galactic superwind (Chevalier & Clegg 1985).
The superwind produces several effects. It depletes the disk of gas, quenching star formation and transporting metals into extragalactic space (Bolatto et al. 2013). The hot gas expands outside the disk, creating an X-ray emitting region surrounded by swept warm (T ∼ 104 K) gas that produces Hα lines (e.g., Heckman et al. 1990; Strickland et al. 2002). The effects of the superwind can be detected up to distances of ∼10 kpc from the disk of some edge-on galaxies. Most local starburst galaxies, such as M 82 and NGC 253, show clear evidence of superwinds (e.g., Veilleux et al. 2005). The superwind region in the halo is filled with a multiphase gas with hot, warm, cool, and relativistic components, and each are observable at different ranges of the electromagnetic spectrum. The relativistic component can be formed by particles that are accelerated in the disk and transported to the halo and/or by locally accelerated particles in the shocks that are produced by gas collisions in the outflows.
Radio observations of nearby starbursts show extraplanar nonthermal emission on both sides of the galactic disks, which is produced by synchrotron radiation (e.g., Beck et al. 1994; Heesen et al. 2009a, 2011). From now on, we refer to this emission as radio halos. Such observations support the idea that relativistic particle acceleration and transport can be associated with the superwind. Radio halos require the coexistence of extraplanar cosmic rays and magnetic fields. As cosmic rays are injected and accelerated by shocks associated with supernova remnants and stellar winds in the star-forming region within the disk, they must be transported from the disk into the halo (Heesen et al. 2009b; Peretti et al. 2019). Due to adiabatic and radiative losses, the halos cannot extend very far unless there is some reacceleration of the particles. The natural place for such a process is the reverse shock at the terminal interaction region between the superwind and the intergalactic medium (e.g., Anchordoqui et al. 1999; Romero et al. 2018; Peretti et al. 2022). If some obstacles, such as large clouds or fragments from the disrupted disk, interact with the superwind, the bow shocks that formed around them can also be sites of particle acceleration (Müller et al. 2020).
Identifying the radio halos to probe galactic winds and the cosmic ray population outside the disk of starburst galaxies is complex. The galaxy plane can be described by considering at least two exponential functions or a Gaussian and exponential function: one with a small scale height representing the disk itself and another with a larger scale height representing the halo (Krause et al. 2018; Dahlem et al. 2001). Therefore, high-resolution imaging and very good sensitivity are required. Several surveys have been performed with different results. For example, Irwin et al. (1999) used the Very Large Array (VLA) in its C and D configurations to image 16 edge-on galaxies from the northern hemisphere at 20 cm. Only six of these galaxies were starbursts. They found that all but one galaxy (NGC 4517) of their sample showed some evidence of extraplanar emission and concluded that such radiation appears to be common in star-forming galaxies. Dahlem et al. (2001) made radio continuum observations with the VLA and the Australia Telescope Compact Array (ATCA) of a sample of 15 edge-on spiral galaxies, none of which had active galactic nuclei or nearby interacting partners. Radio halos were found in six of these galaxies. A trend was found that galaxies with radio halos have the highest IR 60 μm to 100 μm flux ratios, which is an indicator of galaxies with high SFRs. The measured exponential scale heights of these six detected radio halos range from about 1.4 to 3.1 kpc. More recently, Krause et al. (2018) determined the scale heights and radial scale lengths of the radio halos for a sample of 13 galaxies from the Continuum Halos in Nearby Galaxies – an EVLA Survey (CHANG-ES) radio continuum survey (Irwin et al. 2012) in two frequency bands. The average values they found for the radio scale heights of the halos are 1.1 ± 0.3 kpc in the C band and 1.4 ± 0.7 kpc in the L band.
Radio and IR emission are observed to be correlated, both in local star-forming late-type galaxies and even in merging galaxies (e.g., Condon et al. 1993, 2002; Murphy et al. 2013). The radio-IR correlation is characterized by the parameter q, defined as (Helou et al. 1985)
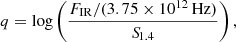 (1)
(1)
where FIR is the IR flux and S1.4 is the 1.4 GHz flux density. The typical values found for this parameter are q = 2.5, σq = 0.1 (Shao et al. 2018), q = 2.2, σq = 0.1 (Irwin et al. 1999), q = 2.3, σq = 0.2 (Condon 1992), and q = 2.1, σq = 0.16 (Helou et al. 1985). Looking into this relationship might be key to better understanding the origin of the radio continuum halos.
In this paper, we present an investigation of the radio halos of all galaxies with inclinations i > 80° in the recently published MeerKAT atlas of IRAS bright southern galaxies (Condon et al. 2021). The observations were carried out at 1.28 GHz with the South African radio interferometer MeerKAT, a precursor to the Square Kilometre Array (SKA). Our sample of 25 nearly edge-on galaxies is the largest one investigated to date.
In Sect. 2 we define our sample, while in Sect. 3 we describe the preparation of the images, the modeling of the galactic disks, and the subtraction method used to separate the extraplanar emission. In Sects. 4 and 5, we explain how we applied this method to the sample and present the results obtained. Section 6 presents an exploration of the correlations found in our results. In Sect. 7 we discuss some implications of the results for other wavelengths, and finally we close with a summary and some conclusions in Sect. 8.
2. Galaxy sample
Condon et al. (2021) published a MeerKAT atlas of 298 IRAS revised bright southern galaxies (δ < 0; IRAS, RBGS, Neugebauer et al. 1984; Sanders et al. 2003). The observations were performed at 1.28 GHz using the powerful MeerKAT radio interferometer. MeerKAT has 64 antennas with 13.5 m of diameter; 70% of the antennas form a dense inner component distributed in two dimensions with a Gaussian uv distribution with a dispersion of 300 m, a shortest baseline of 29 m and a longest baseline of 1 km. The maximum baseline of the array is 7.7 km.
We gathered the cropped MeerKAT images in FITS format available online1. The final Stokes I images have an angular resolution of 7.5″, and the rms is approximately 20 μJy beam−1. The high angular resolution and low rms of these images make it possible to reveal faint extended emission, study its morphology, and look for the presence of galactic winds.
The edge-on galaxies are the best targets to separate the emission originating in the galactic plane from the extraplanar one in a galaxy. In the case of lower inclinations, the emission from the disk overlaps with the extraplanar emission, and a fraction of it will be challenging to distinguish. The methods commonly used to estimate the inclinations of the galaxies present high uncertainties. We decided to use INCLINET2, an online application for determining the inclinations of spiral galaxies from their optical images, which uses neural networks to provide more reliable estimates of this parameter (Kourkchi et al. 2020). We used INCLINET to calculate the inclinations of all the galaxies in the MeerKAT Atlas and selected those with i ≳ 80°. Besides, we selected those with radio angular sizes more significant than five times the angular resolution. We carefully analyzed each image’s rms and quality (e.g., we discarded those images with reduction artifacts). Our final sample consists of 25 galaxies listed with their main properties in Table 1.
Galaxy sample.
3. Method
3.1. Preparation of the images
Before the analysis, a series of processes were applied to the selected MeerKAT images. To align the galaxies with the horizontal axis, we rotated the images using the position angle (PA) of each galaxy; PA values are shown in Table 1, column five. We estimated the rms noise of the background of each image, using as an initial estimation the average value given by Condon et al. (2021) of 20 μJy beam−1. We fit a normal distribution to all the pixels for which the intensity is below three times the initial rms. The new estimation was obtained as
 (2)
(2)
where σm and σs are the mean value and the standard deviation of the fitted normal distribution. Then, we selected only the pixels for which the intensity exceeds three times the new rms estimation. We estimated the radio diameter of each galaxy as the angular size of the radio intensity within three times the rms estimation. Since in the total image, there may be other sources than the galaxy in which we are interested, we cropped the images and kept only a rectangular section containing the emission from the galaxy. If, in that section, there were remaining non-related sources that could interfere with the analysis, they were removed by fitting a two-dimensional Gaussian function using the NOD-3 package (Müller et al. 2017). Finally, we analyzed the presence of strong nuclear sources that dominate the emission from the disk because they can create confusion when analyzing the presence of halos. The contribution Si of these sources to the total flux density S of the galaxies was calculated by Condon et al. (2021) by fitting a Gaussian function. We removed them in the cases in which the contribution Si/S showed in Table 1, Col. 10, was greater than 25% of the total.
3.2. Construction and modeling of the z profiles
The determination of the presence and size of the radio halos was performed using the z profiles, with z being the direction perpendicular to the galactic disk. The rectangular section of the image described in Sect. 3.1 was divided into rows of pixels in the z direction. These strips were averaged in the direction of the galaxy’s major axis, obtaining a single-row profile that describes the average intensity distribution in the z direction. The width of the resulting profile is given by the combination of the inclination i of the galactic disk with the line of sight, the intrinsic height of the disk, and the possible presence of extraplanar emission, that is, a radio halo, all convolved with the beam of the telescope.
To determine the presence and size of a radio halo, we adopted an approach similar to Dahlem et al. (2001). We consider that the disk is infinitesimally thin, and when we see it inclined and projected onto the sky, we assume that the corresponding z profile can be described either by a Gaussian
 (3)
(3)
or an exponential function
 (4)
(4)
where z0, d is the scale height of the disk. This parameter is usually considered to describe the halo size because it is a more physical quantity than the extent of a radio halo that simply depends on the sensitivity of the observations. To model the emission from the halo, a second exponential component with scale height z0, h was added only when a single component was not enough to describe the shape of the profile. These components were then convolved with a Gaussian-shaped beam described by
 (5)
(5)
with  . The convolutions can be obtained analytically, and the resulting convolved functions are
![Mathematical equation: $$ \begin{aligned} W_{\mathrm{exp}}(z) =&\frac{{ w}_{0}}{2}\exp \left(-z^{2}/2\sigma ^{2}\right) \nonumber \\&\times \Bigg [\Bigg . \exp \left(\frac{\sigma ^{2}+z\,z_{0}}{\sqrt{2}\,\sigma \,z_{0}}\right)^{2} \mathrm{erfc}\left(\frac{\sigma ^{2} +z\,z_{0}}{\sqrt{2}\,\sigma \,z_{0}}\right)\nonumber \\&+ \exp \left(\frac{\sigma ^{2}-z\,z_{0}}{\sqrt{2}\,\sigma \,z_{0}}\right)^{2} \mathrm{erfc}\left(\frac{\sigma ^{2}-z\,z_{0}}{\sqrt{2}\,\sigma \,z_{0}}\right)\Bigg .\Bigg ] \end{aligned} $$](/articles/aa/full_html/2024/05/aa48080-23/aa48080-23-eq7.gif) (6)
(6)
for the exponential, where erfc is the complementary error function defined as
 (7)
(7)
and
 (8)
(8)
for the Gaussian. As the z profiles can be asymmetric, we allow the scale heights on both sides of the disk to be different, with a common maximum.
When a radio halo is detected, we also calculate how much it contributes to the total flux density of the galaxy (hereafter, the halo contribution). To do this, we take the beam-convolved component of the fit corresponding to the disk and match its maximum with the maximum of the z profile. The halo contribution is then calculated as the area between the disk component and the total profile on each side of the disk separately. We assume the emission around z = 0 is from the disk, as we cannot separate the two components. For this reason, the contribution is only calculated for values of |z| greater than the FWHM of the beam-convolved component that describes the disk.
4. Results: General
In general, the disk component of the profiles was better fitted with exponential functions than with Gaussian functions. The disk scale heights  range between 0.6″ and 15″, except for the galaxies NGC 134 and NGC 2613, where the disk scale heights resulted larger, possibly due to their low inclination. These parameters are shown in Tables 2 and 3 together with the disk scale heights in kpc, that range between 0.1 and 2.5 kpc. We note that this value is the apparent height of the disk, which could be produced by an inclination i < 90°, intrinsic thickness, or a composition of both effects. Thus, the
  are not, in all cases, a direct measure of the intrinsic disk thickness. The errors of the scale heights of the disk were generally less than 20%, except for NGC 7090, which had an error of ∼24%. It is important to note that the magnitude of these errors is expected, given that the disk scale heights are sometimes much smaller than the angular resolution, which is ∼8″.
Parameters obtained from fitting a two-component function to the z profile of the sample galaxies with halos.
For the 11 galaxies listed in Sects. 5.1 and 5.2, a single-component function was not enough to fully describe the shape of their z profiles and a second component was added, what we interpret as the detection of a radio halo. We averaged the halo scale heights and halo contributions at the left and right sides of the disk to obtain the mean values. All these parameters, the rms obtained for each radio image, and the diameter of the radio emission dr, which were calculated according to the method described in Sect. 3, are shown in Table 2. The average halo scale heights range between 4″ and 20″, with a mean value of 11.5″ and errors lower than 19%. This is equivalent to scale heights between 0.7 and 1.5 kpc, with a mean value of 1 kpc. We found that sometimes, on one side of the z profile, the halo scale height resulted in the same order or lower than the disk scale height. This means the halo component was necessary only on one profile side. In these cases, we consider a positive detection of a halo only on the other side. Also, we found in some cases that the angular sizes of the halo scale heights are smaller than the angular resolution of the image. Thus, these results are preliminary and higher resolution data is needed to ensure a positive halo detection. For seven of these galaxies, listed in Sect. 5.1, extended radio emission had never been studied in the past. Therefore, in the present work, we report their radio halos for the first time. The radio halos of the four galaxies listed in Sect. 5.2 were already detected in the past by other authors. In this work, we confirm their results and obtain more accurate estimations of the halo scale heights.
For the remaining 14 galaxies in Sect. 5.3, a single-component function was enough to describe the z profiles fully. In some cases, a barely excess emission above the fitted function is observed, but it is insufficient for adding a second component to the fit. Thus, we conclude that no halo is detected. The disk scale heights  obtained for their fits are shown in Table 3, together with the obtained rms of the radio images and the diameter of the radio emission dr. Four of these galaxies – NGC 2613, NGC 3175, NGC 3717 and NGC 5073 – were already studied in the past by other authors, who also did not detect a radio halo except for NGC 3175.
Parameters obtained from fitting a single-component function to the z profile of the sample galaxies without halos.
As an example, we show in Fig. 1 the radio contour map over the optical Digital Sky Survey (DSS) image, the z profile and the fit for two galaxies: ESO 209-G009, one of the galaxies for which we detected a radio halo for the first time, and ESO 428-G028, for which we did not detect a radio halo. In Fig. 2 we show for comparison the one-component fit we obtained for ESO 209-G009. It can be seen that there are “wings” of emission above the fit on both sides of the profile. In addition, the residuals reach values greater than 3 rms, suggesting that a second component needs to be added to the fit. For visual references of the rest of the sample, please refer to Appendix A, where the corresponding images and fitted profiles can be found. In the following paragraphs and sections, we provide a description of the results, the main characteristics of the sample galaxies, and an overview of the analysis conducted.
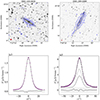 |
Fig. 1. Radio contour maps superimposed on a DSS image (top) and z profile (bottom). The horizontal axis of the profiles is the offset in arc-seconds from the galactic plane in z direction, and the vertical axis the average flux density in μJy beam−1. The shaded gray area extends from −3 rms to 3 rms, and the solid line within this area is the residual of the fit. Left panel: ESO 428-G028. The contour levels are −0.07, 0.07, 0.22, 0.37 and 0.52 mJy beam−1. The data is shown with dots and the exponential fitted function with dashed line. Right panel: ESO 209-G009. The contour levels are −0.12, 0.12, 0.36, 0.60 and 0.84 mJy beam−1. The synthesized beam of 7.5″ is shown in the bottom left corner of each image. The data are shown with dots, the fitted disk component in dashed line, the halo component in dotted line and the total fit in solid line. |
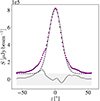 |
Fig. 2. One-component fit for the galaxy ESO 209-G009. The horizontal axis is the offset in arc-seconds from the galactic plane in z direction, and the vertical axis the average flux density in μJy beam−1. The data are shown with dots and the Gaussian fitted function with dashed line. The shaded gray area extends from −3 rms to 3 rms, and the solid line within this area is the residual of the fit. The “wings” of emission above the fit at both sides of the profile together with the residuals being greater than 3 rms suggest that a second component is needed to accurately fit the data. |
5. Results: Individual sources
5.1. First-time detected radio halos
ESO 005-G004. The radio map of this galaxy, which harbors a hidden Seyfert 2 nucleus (McKernan et al. 2010; García-Bernete et al. 2016), reveals an extended emission, centrally peaked, covering the entire optical disk. Two optical point sources are located nearly symmetrically on both sides of the disk center. Up to date, its is not determined if these sources are related or not with the galaxy.
We found that an exponential function provided the most accurate fit for the disk, and we also observed highly asymmetric extraplanar emission that could not be fully explained with a single component, suggesting the presence of a halo. No trace of a jet that might be associated with the Seyfert nucleus was found.
ESO 079-G003. The contour map of this galaxy shows that the radio emission is centrally peaked. It covers almost all the optical disk, thicker on one side and with several clumps and plumes along its extension.
We determined that a Gaussian function offered a good fit for the disk and found the presence of extraplanar emission that required the addition of a second component to achieve an accurate fit. However, the disk and halo scale heights resulted in smaller values than the angular resolution, making this a preliminary detection and indicating the need for even higher-resolution data.
ESO 163-G011. This galaxy is paired with ESO 163-G010. The contour map and profile exhibit an evident asymmetry; the left side of the profile displays greater emission, which corresponds to the side of the disk closer to its companion galaxy. For this reason, it was necessary to fit the profile with a two-component function: an exponential for modeling the disk and a second component to account for the asymmetric emission, which we interpret as a radio halo. However, the angular value of the average halo scale height was smaller than the angular resolution, making it another preliminary detection.
ESO 209-G009. Despite it having a significantly higher rms value than the other galaxy images, we could still thoroughly analyze this galaxy. To construct the z profile, we had to select a smaller rectangular region than the entire galaxy, excluding the disk’s outer regions that appeared as a tail on one side. The radio emission extends through the optical disk and is extended out of the galactic plane in z direction, showing a clumpy structure, more prominent near the tail. The z profile revealed that the galaxy exhibited emission beyond its disk, and a two-component model with a Gaussian disk was required to describe the profile accurately. However, as the halo scale height on the right side of the profile results in the same order as the disk scale height, we conclude that the radio halo is only detected on the left side. In the past, Rossa & Dettmar (2003) detected extraplanar ionized gas in this galaxy, while recently, Mosenkov et al. (2022) found extraplanar dust. However, the radio halo was studied and detected for the first time in the present work.
IC 3908. For this galaxy, we had to adjust the position angle provided by HYPERLEDA by a small margin. We observed that the major axis was not horizontal when rotating, indicating the need for a slightly different angle. Upon examining the radio contours, we observed that the galaxy exhibits emission extending far beyond the galactic disk on both sides, forming a somewhat rectangular shape. To obtain the best fit for the z profile, we utilized a Gaussian disk as well as a second component to account for the extraplanar emission. However, the halo scale height on the right side of the profile resulted in the same order as the angular resolution, making it a preliminary detection.
NGC 1532. Because this galaxy is part of an interacting pair with NGC 1531, its z profile was particularly difficult to fit. Its disk is highly distorted, and large plumes of extraplanar emission can be seen from the radio contour map. After removing the emission from NGC 1531, the best fit was found for a two-component function with a Gaussian disk. This galaxy has one of the most prominent radio halos in our sample, with an average scale height of 1.5 kpc.
NGC 2221. This is a dwarf irregular galaxy, part of an interacting pair together with NGC 2222. Some small sources in the vicinity had to be removed before the analysis. Despite being one of the sample galaxies with a smaller angular size and a low inclination angle, this galaxy exhibits prominent extraplanar emission, which requires fitting its profile using a two-component function. An exponential disk provided the best fit, but the disk and halo scale heights were found to be smaller than the angular resolution. Thus, higher-resolution data are needed to confirm these results.
5.2. Previously detected halos
NGC 1406. The strong nuclear source present in this galaxy had to be removed before the analysis. The radio contour map shows evidence of extraplanar emission, more intense at the central part on one side of the galactic disk. The emission covers almost the entire optical disk in the radial direction.
The best fit resulted from using a Gaussian disk and a component to account for the halo. As the left halo scale height resulted in the same order as the disk scale height, we conclude that the halo is detected only on the right side. The radio halo of this galaxy was detected for the first time by Dahlem et al. (2001), who found an average halo scale height of 1.66 kpc using 43″ resolution VLA observations. We correct this value to 1.06 ± 0.08 kpc.
NGC 1421. This galaxy has a relatively low inclination, allowing for clear visibility of its spiral arms and disk structure around the central source. We observed evidence of extraplanar emission in both the z profile and contour map after removing nearby sources. To accurately describe the profile, a two-component function with a Gaussian disk was necessary, but due to the high asymmetry of the profile, obtaining a good fit was challenging. The resulting disk scale height was found to be large, and the left halo scale height was near the size of the telescope beam, resulting in a negligible halo contribution to the flux density on that side. This suggests the possible presence of a radio halo on this side of the galactic plane, but it is masked by the disk emission. On the other side of the disk, the halo emission is more reliably detected, resulting in a highly asymmetric halo. The presence of a radio halo in this galaxy was first suggested by Irwin et al. (1999). Later, Dahlem et al. (2001) analyzed the profile of this galaxy, but they needed only one component function to describe it. Then, the present work is the first detection of a radio halo for this galaxy, so confirming Irwin et al. (1999) original suggestion. Also, this galaxy was observed in X-rays by the Einstein instrument (Fabbiano et al. 1992), showing extended emission with a very particular elongated shape beyond the stellar disk.
NGC 4666. This galaxy is known to host both a starburst and an AGN (Persic et al. 2004). Despite its low inclination, it exhibits a prominent wind, which has been studied by several authors in X-rays (Ehle & Dahlem 2004), Hα (Voigtländer et al. 2013), and also shows HI emission more extended than the optical disk, with spurs and tidal features which suggest that it is interacting with NGC 4668, located to its southeast (Zheng et al. 2022). This galaxy was studied in radio by Stein et al. (2019), who found a halo scale height of 2.16 kpc, almost twice the value found in this work. However, these two results are consistent if we take into account that they consider a distance of 27.5 Mpc, while in this work, we adopted the updated value of 12.82 Mpc.
Using our method, we initially attempted to fit the z profile with a single exponential function, but this resulted in an extremely large disk scale height. One possible explanation is that the relative intensity of the halo emission with respect to the disk emission is so high that it dominates the shape of the profile, making it impossible to separate the disk component. This effect could be amplified by the low inclination of the galaxy, which causes the disk emission to be more widespread. However, since the disk scale height resulting from a single-component fit was excessively large, and the existence of a radio halo produced by star formation activity in this galaxy has been well established (Heesen et al. 2018; Stein et al. 2019), we accurately fitted the z profile using a two-component function with a Gaussian fit.
NGC 7090. Several authors have also examined this nearby galaxy; Dahlem et al. (2001) detected for the first time a radio halo with an average scale height of 1.77 kpc. They used VLA observations at 1.43 GHz, with an angular resolution of 34.5″, and considered a galaxy distance of 11.7 Mpc. Later, Dahlem et al. (2005) found extraplanar HI emission. Rossa & Dettmar (2003) observed evidence of extraplanar Hα emission, and recently Jo et al. (2018) found extraplanar dust and Hα emission. As evidenced by both the z profile and the radio contours, this galaxy exhibits a prominent and highly asymmetric radio halo. To achieve the best fit, we utilized a two-component function with an exponential disk. We obtained an average halo scale height of 0.7 kpc, considering the distance listed in Table 1. The data we used has an angular resolution of ∼4 times better than the previously used in Dahlem et al. (2001).
5.3. Non-detections
ESO 428-G028. The radio emission of this galaxy is centrally peaked and extends over the entire disk. Despite its apparent thickness in the z direction, with some plumes extending from the galactic plane, a one-component exponential function adequately described the z profile.
IC 4595. The radio emission of this galaxy extends to the outermost parts of the optical disk. Before analysis, a very bright, nearby source had to be removed to ensure accurate results. The most optimal fit for this particular galaxy was achieved using an exponential disk.
NGC 134. This galaxy has a relatively low inclination angle that allows the structure of its disk to be clearly visible. The radio contour map analysis indicates that the emission closely follows the optical disk without a central peak and no detectable signs of extraplanar emission. It is possible that, if present, any extraplanar emission is masked by the strong disk emission due to the galaxy’s low inclination angle.
After removing nearby sources, we were able to obtain the most optimal fit for this galaxy using a Gaussian disk without requiring a second component to describe the z profile. Interestingly, the resulting disk scale height was significantly larger than that of the rest of the sample, which may be a consequence of the low inclination angle of the galaxy.
NGC 1448. Although the radio emission of this galaxy, which hosts a Compton-thick obscured AGN (Annuar et al. 2017), extends into the outer regions of the galactic disk, the irregularity of this emission requires us to focus on a smaller region when constructing the z profile to obtain an accurate fit. We used a single-component exponential function to obtain the best fit.
NGC 2613. Irwin et al. (2019) recently found evidence for a possible AGN in this galaxy. Li et al. (2006) studied this galaxy in X-rays and suggested the presence of an obscured AGN and a bubble that may correspond to extraplanar emission. They suggest that it could be produced by a starburst or an AGN in case of being an outflow. Irwin et al. (1999) studied the radio emission of this galaxy and found evidence of extraplanar emission. Chaves & Irwin (2001), on the other hand, found extraplanar HI features.
The disk of this galaxy has a relatively low inclination angle, allowing its structure to be clearly visible. Its ring shape shows two regions brighter than the rest and even brighter than the emission from the galaxy center. It can be seen that the radio emission follows the optical disk, with no evidence of extraplanar emission. The high asymmetry and the low inclination of the disk made this galaxy’s profile very difficult to fit. After the removal of surrounding sources and once obtained the profile, we found the best fit using a single Gaussian function. The disk scale height obtained was significantly larger than that of the rest of the sample, perhaps as a consequence of its low inclination.
NGC 2706. This galaxy is one of the sample galaxies with a smaller angular size and has a relatively low inclination angle, which causes the optical disk to be thick. The radio emission extends through the galactic disk and also appears broad in z direction. However, we determined that a single-component function was enough to accurately describe the shape of the z profile.
NGC 3175. This galaxy was previously studied by Dahlem et al. (2001), who found a preliminary detection of a radio halo. However, they performed their analysis without removing the intense nuclear source present in this galaxy. When fitting the z profile, the nuclear emission could be misinterpreted as the disk emission, and in turn, the disk emission was interpreted as the presence of a halo.
In our work, the nuclear source of this galaxy had to be removed before analysis. The emission appears broad on the radio contour maps, but this may be due to the low inclination. A group of blobs is present on one side of the disk; however, they were excluded from the region used to build the z profile, as it was impossible to determine whether they were part of the galaxy or unrelated sources. Contrary to Dahlem et al. (2001), we found the best fit using a single-component exponential function, suggesting the absence of a radio halo.
NGC 3263. This galaxy is interacting with the radio-quiet galaxy NGC 3262, and is a member of the NGC 3256 group. It shows a tidal tail located at one end of the disk. When constructing the z profile, it was challenging to identify an area that did not include any of the emission from the tail. However, we were able to select an appropriate region where the contribution from the tail was negligible, and the z-profile analysis could be performed. Despite the presence of the tidal tail and the galaxy’s low inclination, we determined that a single-component function was enough to accurately fit the profile.
NGC 3717. The radio emission in this galaxy, paired with IC 2913, is primarily concentrated in the central region, with no discernible signs of extraplanar emission as it follows the optical disk. After removing the strong nuclear source and nearby sources, we fit the z profile and determined that a single exponential function provided the best fit. Our results agree with Dahlem et al. (2001), who also studied this galaxy and did not find a radio halo.
NGC 4835. This galaxy is similar to NGC 4666, in that its inclination is low, but it still shows signs of apparent extraplanar emission from both the z profile and the radio contour map. However, a single-component exponential function was enough to accurately describe the profile. A possible explanation is that the low inclination of the galaxy does not allow one to differentiate the two components from each other if a radio halo is indeed present.
NGC 5073. This is one of the more distant galaxies in our sample, and its emission is primarily concentrated in a strong nuclear source, removed before analysis. It was studied in the past by Dahlem et al. (2001), who could not make any conclusions because the galaxy was practically unresolved in the images. They also suggest that it could host an AGN, but a recent study made by Koulouridis et al. (2006) in which they study the relation between starbursts and AGNs, this galaxy is classified as a starburst. The remaining emission consists of a faint disk. Both the radio contour map and the z profile indicate the absence of a radio halo. To accurately describe the profile, a single exponential function was utilized. The resulting disk scale height was found to be particularly small, indicating that this galaxy is essentially unresolved, as well as in previous images.
UGCA 150. The radio emission of this galaxy follows the optical disk, as can be seen from the radio contour map. However, we observed a small excess on both sides when attempting to fit a single-component function to the profile. Nevertheless, the observed excess is not significant enough to include a second component. Consequently, the best fit was achieved using a single Gaussian function.
UGCA 394. The nuclear emission of this galaxy is strong and had to be removed before the analysis. The radio emission follows the optical disk, except near the galaxy center, where is a small excess. This emission, however, is not enough to add a second component and a single exponential function was found to adequately fit the profile. The profile clearly displays a deviation from the exponential fit on the right side, indicating the presence of the excess emission mentioned earlier.
UGCA 402. After removing nearby unrelated sources and constructing the z profile, we observed that the profile followed an exponential shape. Although we noted a small excess of radio emission outside of the galactic disk, this was not reflected in the profile fit, and there was no need to add a second component.
6. Correlations
In this section, we aim to investigate the potential relationship between the existence and physical properties of galactic halos and the star formation activity of the galaxies. We analyze the results obtained in Sects. 4 and 5 and examine how they relate to the global properties of the galaxies.
6.1. The galaxy sample into context: Looking for biases
We tested our method to see any dependence on the resulting parameters (halo scale heights, flux density contribution and asymmetries) with the inclination. We did not find any relation, meaning that for values larger than 80°, our method can detect halos with no difficulties.
We could detect halos in galaxies at all distances within our sample, which indicates that, in principle, our method does not prefer nearby galaxies. The galaxies in our sample with higher distances have larger IR luminosities. This is a consequence of the selection criteria: as the IRAS RBGS is flux-limited, distant galaxies with low IR luminosity are not part of the sample because of their low flux density. This effect can also be seen in Fig. 3 – although with large dispersion – as a direct relation between the radio diameter (measured in kpc) and the distance: larger and nearby galaxies are omitted for having an angular size too large, and distant and small galaxies are also omitted for having an angular size too small. The color scale in Fig. 3 corresponds with the increasing IR luminosity.
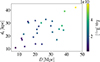 |
Fig. 3. Radio diameter in kiloparsecs vs. distance in megaparsecs for the sample galaxies. The color scale corresponds to the IR luminosity in units of 1010 L⊙. The direct relation between these quantities is a consequence of the selection criteria. |
Of all the halo parameters, only the halo scale heights correlate with the distance. However, comparing directly the halo scale heights with the radio diameters, we can see that the dependence on the distance is a consequence of a direct relation between the halo scale heights and the radio diameter. This relation, shown in Fig. 4, cannot be attributed to any selection effect.
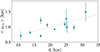 |
Fig. 4. Halo scale heights vs. radio diameter, both in kiloparsecs. The sample galaxies are shown in stars, and the linear fit in dotted line, with a slope of 0.028 ± 0.009 and an intercept of 0.4 ± 0.1. The direct relation between these quantities cannot be explained by attributable to any selection criteria, and we consider its origin physical. |
6.2. Relations between the global properties of the galaxies and the presence of radio halos
The presence of a radio halo is thought to be related to the star formation activity in the galactic disk. For this reason, we tested if the parameters that describe the radio halos depend on the global properties and how they relate with each other for our sample galaxies.
We found that the scale height does not follow a linear relation with the SFR. Still, it correlates with the galaxies’ radio diameter, as previously mentioned in Sect. 6.1; similar results were reported by Krause et al. (2018). This likely reflects the fact that age and environment are important in the determination of the scale heights. Besides, as shown in Fig. 5, the halo luminosity increases with the SFR.
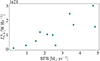 |
Fig. 5. 1.4 GHz luminosity of the halo in units of 1021 W Hz−1 vs. SFR in M⊙ yr−1. A direct trend can be seen between these two quantities. |
All of our sample galaxies follow the radio-IR relation, shown in the left panel of Fig. 6. According to Eq. (1), we obtained a mean value q = 2.5 and a dispersion σq = 0.1, in agreement with the values obtained by Shao et al. (2018), Condon (1992) and Helou et al. (1985). Moreover, we obtained a similar relation – shown in the right panel of Fig. 6 – between the IR luminosity and the luminosity of the radio halos, calculated from the contribution to the total flux density of the galaxy listed in Col. 8 of Table 2. This result suggests that the emission coming from the radio halos is, as expected, produced by star formation activity.
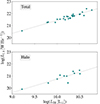 |
Fig. 6. Radio-IR correlation for the total luminosity (upper panel) and the halo luminosity (bottom panel). The horizontal axis corresponds to the logarithm of the IR luminosity in L⊙ and the vertical axis corresponds to the logarithm of the 1.4 GHz luminosity in W Hz−1. Our sample galaxies are shown as stars and the dotted line corresponds to the linear fit of our data. The fit for the upper panel has a slope of 1.08 ± 0.07 and an intercept of 10.6 ± 0.7, while for the bottom panel, we obtained a slope of 1.1 ± 0.2 and an intercept of 9 ± 2. |
The relation of the far-infrared (FIR) flux ratio S60/S100 and the star formation activity per unit area with the presence of halos was studied by several authors in the past. Rossa & Dettmar (2000) claim that all nearby, IR-luminous and IR-warm (i.e., with S60/S100 > 0.4) starburst galaxies have diffuse ionized halos. They show that the starburst and non-starburst galaxies are located in different places in the S60/S100 vs.  plot, where D25 is the diameter measured at the 25th blue magnitude. On the other hand, Dahlem et al. (2001) reproduce this same plot, but they use the radio diameter instead of the optical diameter to calculate the star-forming area ASF. We reproduced the plot for our sample galaxies with detected radio halos; see Fig. 7. We can see that all of them fall in the starburst region of the plot, that is, with log(S60/S100) > − 0.5 and log(LIR/ASF) > 0.5, except for one of them that has log(S60/S100)∼ − 0.5 and falls in the transition of the two populations. It also appears to be a tendency that galaxies with larger LIR/ASF also have larger S60/S100 ratios. Given the results obtained from this plot, from now on, we consider these galaxies as hosting starbursts.
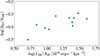 |
Fig. 7. FIR flux ratio S60/S100 vs. IR luminosity divided by the star formation area ASF for galaxies with detected radio halos. All the galaxies fall in the starburst region of the plot, i.e., they have log(S60/S100) > − 0.5 and log(LIR/ASF) > 0.5. |
We searched for any possible relations with the optical properties of the galaxies. Dahlem et al. (2006) found that for their sample galaxies, those with halos tend to have higher IR-to-blue luminosity ratios and more compact star formation distributions, given by the ratio ASF/A25, where  is the optical disk area. We do not see the same trend within our sample. It is worth mentioning that the plot shown by Dahlem et al. (2006) combines a few galaxies from their work with several others from other works, each one of them using different methods to detect the radio halos and all of them using observations with low angular resolution (about 45″) and high rms noise. We also looked for the relation between the S60/S100 ratio and the ASF/A25 ratio, which is another plot made by Dahlem et al. (2006). They claimed that galaxies with halos have more compact star-forming distributions and higher S60/S100 than those that do not show a halo. For our sample galaxies, however, the halos are present in all the ASF/A25 range, and we did not find the same relation as these authors. On the other hand, Dahlem et al. (2001) studied a sample of galaxies and claimed that within their sample, galaxies physically smaller tend to have larger halos. However, the number of galaxies in their sample is too small to yield a conclusive result. We reproduced the same plot for our sample galaxies and, contrary to Dahlem et al. (2001), did not obtain a relation between these quantities.
7. Discussion
We have detected 11 radio halos around edge-on nearby galaxies from a sample of 25 candidates. Seven of the halos are reported here for the first time. The SFRs of the haloed galaxies range from 0.25 to 4.84 M⊙ yr−1, while the halos have average scale heights of 0.7 to 1.5 kpc. The halo scale heights cover a range of an order of magnitude with respect to the disk scale heights of the galaxies:  , that is, we have radio halos that are up to 10 times larger than the galactic disk. As expected for emission driven by a superwind produced by star formation activity, there is a clear correlation between the radio luminosity of the halos and the IR luminosity, which scales linearly with the SFR (see Fig. 6). The same is true for the radio luminosity of the halos and the SFR (see Fig. 5). All this supports the hypothesis that the radio halos result from synchrotron radiation produced by relativistic electrons either transported from the disk by the superwind, or locally accelerated in the halo by processes occurring in the interaction of the superwind with the external medium. The halo scale heights, on the other hand, may depend on other factors, such as the age of the system and the density of the surrounding medium, which could explain the absence of a relation with the SFR. A powerful but young wind, for example, will not have enough time to propagate to large distances, resulting in a bright but small radio halo. The same could happen if a wind propagates through a very dense medium.
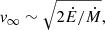
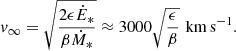
The basic theory of superwinds in starburst galaxies was put forward by Chevalier & Clegg (1985) and later developed by Heckman et al. (1990) and Strickland et al. (2002), among others. The superwind is produced when the ejecta from supernovae and stellar winds is efficiently thermalized in the nuclear region of the starburst. The result is a very hot (T ∼ 108 K), high-pressure bubble that expands and displaces the surrounding gas. As the bubble disrupts the disk, it expands adiabatically into the extragalactic medium, creating the multiphase region mentioned in Sect. 1. The outflow quickly reaches the terminal velocity given by
 (9)
(9)
where Ė and Ṁ are the total energy output and the total mass input, respectively. The wind is bipolar, with asymmetries reflecting differences in matter distribution and pressure on either side of the galaxy. The expanding gas forms a system of shocks, one sweeping matter outward and heating it, while the reverse shock moves through the hot medium and, being adiabatic, is suitable for particle acceleration (Romero et al. 2018). Since the external medium is most likely not uniform, the reverse shock is actually an ensemble of shocks, which can result in a very complex environment that would certainly affect the acceleration efficiency (see, for example, the simulations performed by Jana et al. 2020).
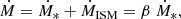
Both Ė and Ṁ are proportional to the total contribution of supernovae and stellar winds in the central starbursts. If we denote by the quantities corresponding to these contributions, we get the total injected energy (e.g., Veilleux et al. 2005)
 (10)
(10)
where ϵ is the thermalization efficiency (the fraction of the central SNe and stellar wind energy that goes into the outflow). This coefficient depends strongly on the local conditions. On the other hand, the total mass that goes into the outflow is made up of the mass supplied by the starbursts (Ṁ∗) plus the gas loaded by the wind from the surrounding medium
 (11)
(11)
where β is the mass loading parameter.
Both Ė∗ and Ṁ∗ scale with the SFR as (Veilleux et al. 2005)
 (12)
(12)
 (13)
(13)
The final velocity of the superwind does not depend on the SFR, since this rate cancels out in the calculation. Therefore, Eq. (9) can be written as
 (14)
(14)
The values of ϵ and β are not well constrained. In the case of very local galaxies such as NGC 253 and M 82, the thermalization efficiency seems to be very high (Strickland & Heckman 2009) and the mass loading parameter has been calculated to be ≈12 (Bolatto et al. 2013; Romero et al. 2018). Assuming that the galaxies in our sample have on average ϵ ≈ 0.75 and β ≈ 10, we get v∞ ≈ 820 km s−1. The actual velocity at which the cosmic ray populations are transported is much less than this value because of various effects, including diffusion, effective magnetic viscosity, gravitational pull, etc. Vijayan et al. (2020) have found a dependence of the advection velocity of cosmic ray electrons produced in the disk on the surface density of star formation as  . Even more recently, Heesen (2021) has investigated a sample of 16 galaxies with radio halos and found that advection dominates over diffusion for galaxies with ΣSFR ≤ 2 × 10⁻³ M⊙ yr−1 kpc−2. This is the case of most galaxies in our sample, whose surface density of star formation is given in Table 4. For these kinds of galaxies, Heesen (2021) obtained a velocity for the advected cosmic rays of
 (15)
(15)
Surface density of star formation for the sample galaxies with detected halos and the advection velocity of cosmic ray electrons produced in the disk.
In our sample, the average value of ΣSFR is ∼0.0074, which implies transport velocities of vadv ∼ 220 km s−1. For a halo with a scale height of ∼1 kpc, this translates to a dynamical age of tdyn ≈ 4.4 Myr.
By comparison, the timescale of synchrotron losses for electrons of 10 TeV in a magnetic field of 5 μG (see Heesen et al. 2009b for estimates for the halo of NGC 253) is tsynch ∼ 3.3 × 10⁴ yr. It is clear then that some reacceleration process must be taking place in the halo, if high-energy gamma-rays are going to be produced in this region by the electrons through inverse Compton scattering. The most likely process is diffusive shock acceleration at the reverse shocks generated by the collision of the outflow with the external medium (Romero et al. 2018).
Yet, for the production of the radio halo itself reacceleration is not strictly necessary. Synchrotron radiation at 1.28 GHz in a field of 5 μG can be produced by electrons with energies of ∼4 GeV. The synchrotron cooling time at such energies in that field is much longer: tsynch = 8.3 × 10⁹ Ee(GeV)−1 B(μG)∼83 Myr ≫tdyn.
Several star-forming galaxies have been detected in gamma-rays by the Large Area Telescope (LAT) on the Fermi Gamma-ray Space Telescope (Fermi). Notable examples are NGC 253 and M 82, which are also suspected sources of ultrahigh-energy cosmic rays (VERITAS Collaboration 2009; Acero et al. 2009; Abdo et al. 2010; Anchordoqui et al. 1999; Anchordoqui 2018). Gamma-ray emission from starbursts is thought to be produced mainly by the interaction of hadronic cosmic rays, accelerated by supernova remnant shocks, with gas in the interstellar medium (Paglione et al. 1996; Romero & Torres 2003; Domingo-Santamaría & Torres 2005; Ohm 2016; Roth et al. 2021). Some contribution may also come from the halos, where the relativistic electrons (Romero et al. 2018; Peretti et al. 2019; Müller et al. 2020) can upscatter CMB or ambient IR photons. Hadronic interactions should also occur in the halo between relativistic protons, accelerated along with the electrons, and matter from clumps and wind-swept material.
A correlation between the radio emission (of synchrotron origin) and the gamma-ray emission (produced by either inverse Compton interactions of the same electron population that emits in radio or by protons transported along with them) is expected. Such a correlation, between the 0.1 − 100 GeV integrated gamma-ray luminosity Lγ and the 1.4 GHz radio luminosity L1.4, has indeed been found by several authors (Ackermann et al. 2012; Kornecki et al. 2022), although not under any specific assumption about the mechanism producing the gamma-rays. The expression for this relation obtained by Kornecki et al. (2022) is
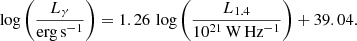 (16)
(16)
We can use this relation to estimate the expected gamma-ray luminosity from the radio luminosity of the galaxies in our sample. The results are shown in Table 5 along with the gamma-ray fluxes obtained using the distances listed in Table 1. Although the gamma-ray luminosities are in the range inferred from their observed fluxes for the nearby galaxies NGC 253, M 82, NGC 4945, and NGC 1068, most of our galaxies are still undetectable.
Predicted 0.1 − 100 GeV gamma-ray luminosities and fluxes of the sample galaxies with detected halos.
In Fig. 8, we show the estimated gamma-ray flux of the haloed galaxies in our sample, along with an estimate of the Fermi 10-year sensitivity. The sample of galaxies from Kornecki et al. (2022) is also shown for comparison. NGC 4666 and ESO 079-G003 are the two galaxies with the expected higher gamma-ray luminosity in our sample. However, ESO 079-G003 is at a much greater distance than NGC 4666. As a result, only NGC 4666 has a gamma-ray flux high enough to potentially be detected by Fermi in the near future. In the LAT 12-year Source Catalog (4FGL-DR3) no source is reported at the position of the galaxy. A dedicated reanalysis of the available data may be worthwhile. In any case, NGC 4666 with its large halo remains as a potential gamma-ray source for future observations, either with Fermi or with the Cherenkov Telescope Array (CTA).
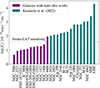 |
Fig. 8. 0.1 − 100 GeV gamma-ray fluxes predicted for our sample galaxies compared with the Kornecki et al. (2022) galaxy sample. The horizontal dashed line corresponds to an estimation of the 10-year sensitivity (Funk et al. 2013). Only NGC 4666 has a flux high enough to potentially be detected by Fermi in the near future. |
8. Summary and conclusions
In this paper, we present the analysis of the extended radio emission for 25 galaxies with inclinations ≳80° gathered from a sample published in the MeerKAT 1.28 GHz Atlas of Southern Sources in the IRAS Revised Bright Galaxy Sample. The resulting sample, described in Table 1, contains galaxies at distances nearer than 46 Mpc, IR luminosities between 109 − 1011 L⊙, SFRs between 0.25 − 8 M⊙ yr−1, and 1.4 GHz radio luminosities in the range 0.3 − 26 × 1021 W Hz−1. The angular resolution of the radio images is ∼7.5″ and the rms is ∼20 μJy beam−1, except for particular cases.
We constructed averaged vertical intensity profiles and modeled them with one or two component(s). When two components were needed to accurately fit the profiles, we interpreted it as the presence of a radio halo. We found halos in 11 galaxies distributed along the entire range of distances and inclinations, seven of which were detected in this work for the first time. Our results agree with other works for the four galaxies with previously reported halos. All the resulting parameters are listed in Tables 2 and 3. The images and the obtained profiles are shown in Fig. 1 and Appendix A. Our main results can be summarized as follows:
-
The disks were generally better fitted with exponential rather than Gaussian functions. The disk scale heights ranged between 0.1 to 2.5 kpc with errors lower than 20%.
-
The halo scale heights ranged from 0.7 to 1.5 kpc, with a mean value of ∼1 kpc and errors lower than 19%, and they covered an order of magnitude with respect to the disk scale heights, that is,
 .
. -
We found no correlation between the halo scale heights and the SFR. However, we did find a direct relation between them and the radio diameter of the galaxies. The halo luminosities, on the other hand, showed a direct relation with the SFR and the galaxy IR luminosity.
-
All of the sample galaxies followed the radio-IR relation between the radio and total IR luminosities, with a q parameter of 2.5 ± 0.1. A similar trend was found for the radio luminosity of the halos.
-
All of the galaxies with detected halos but one presented high values of FIR 60 to 100 μm flux ratios, log(S60/S100) > − 0.4, and IR luminosity per unit of star formation area, log(LIR/ASF) > 0.5. These values are in agreement with those expected for galaxies with starburst activity.
-
We did not find any relation between the halo scale heights or luminosity with the optical properties of the galaxies.
The direct relation of the halo luminosities with the SFR and IR luminosity supports the hypothesis that radio halos result from synchrotron radiation produced by relativistic electrons and this points toward the fact that star formation activity plays a crucial role in the formation of the halos. The absence of a relation between the halo scale heights and SFR can be explained by the fact that they depend on many other factors, such as the age of the system and the density of the surrounding medium. However, the origin of the direct relation between the halo scale heights and the radio diameters remains uncertain.
As Fermi detected several star-forming galaxies in gamma rays, we investigated the possibility that any of our sample galaxies with halos could be observed with this telescope in the future. A correlation between the radio and the gamma-ray emission is expected in starbursts. We used the correlation found by Kornecki et al. (2022) to estimate the gamma-ray luminosity and flux of the galaxies in our sample. Taking the 10-year Fermi sensitivity into account, we found that only NGC 4666 has a gamma-ray flux high enough to potentially be detected by Fermi or with other instruments, such as the CTA, in the near future.
Based on the results presented in this paper, we have started to carry out new dedicated low-frequency observations of selected haloed galaxies to study the spectral index and polarization distributions. Such an investigation will help to shed light on the magnetic field and particle spectrum in the superwind region, and on the coupling between star formation activity and cosmic ray injection in the intergalactic medium.
Acknowledgments
We would like to thank an anonymous reviewer for constructive comments. G.E.R. acknowledges financial support from the State Agency for Research of the Spanish Ministry of Science and Innovation under grant PID2022-136828NB-C41/AEI/10.13039/501100011033. Additional support came from PIP 0554 (CONICET).
References
- Abdo, A. A., Ackermann, M., Ajello, M., et al. 2010, ApJ, 709, L152 [NASA ADS] [CrossRef] [Google Scholar]
- Acero, F., Aharonian, F., Akhperjanian, A. G., et al. 2009, Science, 326, 1080 [NASA ADS] [CrossRef] [Google Scholar]
- Ackermann, M., Ajello, M., Allafort, A., et al. 2012, ApJ, 755, 164 [NASA ADS] [CrossRef] [Google Scholar]
- Anchordoqui, L. A. 2018, Phys. Rev. D, 97, 063010 [CrossRef] [Google Scholar]
- Anchordoqui, L. A., Romero, G. E., & Combi, J. A. 1999, Phys. Rev. D, 60, 103001 [CrossRef] [Google Scholar]
- Annuar, A., Alexander, D. M., Gandhi, P., et al. 2017, ApJ, 836, 165 [CrossRef] [Google Scholar]
- Beck, R., Carilli, C. L., Holdaway, M. A., & Klein, U. 1994, A&A, 292, 409 [NASA ADS] [Google Scholar]
- Bolatto, A. D., Warren, S. R., Leroy, A. K., et al. 2013, Nature, 499, 450 [Google Scholar]
- Chaves, T. A., & Irwin, J. A. 2001, in Gas and Galaxy Evolution, eds. J. E. Hibbard, M. Rupen, & J. H. van Gorkom, ASP Conf. Ser., 240, 406 [NASA ADS] [Google Scholar]
- Chevalier, R. A., & Clegg, A. W. 1985, Nature, 317, 44 [Google Scholar]
- Condon, J. J. 1992, ARA&A, 30, 575 [Google Scholar]
- Condon, J. J., Helou, G., Sanders, D. B., & Soifer, B. T. 1993, AJ, 105, 1730 [Google Scholar]
- Condon, J. J., Cotton, W. D., & Broderick, J. J. 2002, AJ, 124, 675 [Google Scholar]
- Condon, J. J., Cotton, W. D., Jarrett, T., et al. 2021, ApJS, 257, 35 [NASA ADS] [CrossRef] [Google Scholar]
- Dahlem, M., Lazendic, J. S., Haynes, R. F., Ehle, M., & Lisenfeld, U. 2001, A&A, 374, 42 [NASA ADS] [CrossRef] [EDP Sciences] [Google Scholar]
- Dahlem, M., Ehle, M., Ryder, S. D., Vlajić, M., & Haynes, R. F. 2005, A&A, 432, 475 [NASA ADS] [CrossRef] [EDP Sciences] [Google Scholar]
- Dahlem, M., Lisenfeld, U., & Rossa, J. 2006, A&A, 457, 121 [NASA ADS] [CrossRef] [EDP Sciences] [Google Scholar]
- Domingo-Santamaría, E., & Torres, D. F. 2005, A&A, 444, 403 [NASA ADS] [CrossRef] [EDP Sciences] [Google Scholar]
- Ehle, M., & Dahlem, M. 2004, Mem. Soc. Astron. It., 75, 515 [NASA ADS] [Google Scholar]
- Fabbiano, G., Kim, D. W., & Trinchieri, G. 1992, ApJS, 80, 531 [CrossRef] [Google Scholar]
- Funk, S., Hinton, J. A., & CTA Consortium 2013, Astropart. Phys., 43, 348 [NASA ADS] [CrossRef] [Google Scholar]
- García-Bernete, I., Ramos Almeida, C., Acosta-Pulido, J. A., et al. 2016, MNRAS, 463, 3531 [CrossRef] [Google Scholar]
- Heckman, T. M., Armus, L., & Miley, G. K. 1990, ApJS, 74, 833 [Google Scholar]
- Heesen, V. 2021, Ap&SS, 366, 117 [NASA ADS] [CrossRef] [Google Scholar]
- Heesen, V., Beck, R., Krause, M., & Dettmar, R. J. 2009a, A&A, 494, 563 [CrossRef] [EDP Sciences] [Google Scholar]
- Heesen, V., Krause, M., Beck, R., & Dettmar, R. J. 2009b, A&A, 506, 1123 [NASA ADS] [CrossRef] [EDP Sciences] [Google Scholar]
- Heesen, V., Beck, R., Krause, M., & Dettmar, R. J. 2011, A&A, 535, A79 [NASA ADS] [CrossRef] [EDP Sciences] [Google Scholar]
- Heesen, V., Krause, M., Beck, R., et al. 2018, MNRAS, 476, 158 [CrossRef] [Google Scholar]
- Helou, G., Soifer, B. T., & Rowan-Robinson, M. 1985, ApJ, 298, L7 [Google Scholar]
- Irwin, J. A., English, J., & Sorathia, B. 1999, AJ, 117, 2102 [NASA ADS] [CrossRef] [Google Scholar]
- Irwin, J., Beck, R., Benjamin, R. A., et al. 2012, AJ, 144, 43 [Google Scholar]
- Irwin, J., Wiegert, T., Merritt, A., et al. 2019, AJ, 158, 21 [NASA ADS] [CrossRef] [Google Scholar]
- Jana, R., Gupta, S., & Nath, B. B. 2020, MNRAS, 497, 2623 [NASA ADS] [CrossRef] [Google Scholar]
- Jo, Y.-S., Seon, K.-I., Shinn, J.-H., et al. 2018, ApJ, 862, 25 [CrossRef] [Google Scholar]
- Kornecki, P., Peretti, E., del Palacio, S., Benaglia, P., & Pellizza, L. J. 2022, A&A, 657, A49 [NASA ADS] [CrossRef] [EDP Sciences] [Google Scholar]
- Koulouridis, E., Chavushyan, V., Plionis, M., Krongold, Y., & Dultzin-Hacyan, D. 2006, ApJ, 651, 93 [NASA ADS] [CrossRef] [Google Scholar]
- Kourkchi, E., Tully, R. B., Eftekharzadeh, S., et al. 2020, ApJ, 902, 145 [NASA ADS] [CrossRef] [Google Scholar]
- Krause, M., Irwin, J., Wiegert, T., et al. 2018, A&A, 611, A72 [NASA ADS] [CrossRef] [EDP Sciences] [Google Scholar]
- Li, Z., Wang, Q. D., Irwin, J. A., & Chaves, T. 2006, MNRAS, 371, 147 [NASA ADS] [CrossRef] [Google Scholar]
- Makarov, D., Prugniel, P., Terekhova, N., Courtois, H., & Vauglin, I. 2014, A&A, 570, A13 [NASA ADS] [CrossRef] [EDP Sciences] [Google Scholar]
- McKernan, B., Ford, K. E. S., & Reynolds, C. S. 2010, MNRAS, 407, 2399 [NASA ADS] [CrossRef] [Google Scholar]
- Mosenkov, A. V., Usachev, P. A., Shakespear, Z., et al. 2022, MNRAS, 515, 5698 [NASA ADS] [CrossRef] [Google Scholar]
- Müller, P., Krause, M., Beck, R., & Schmidt, P. 2017, A&A, 606, A41 [NASA ADS] [CrossRef] [EDP Sciences] [Google Scholar]
- Müller, A. L., Romero, G. E., & Roth, M. 2020, MNRAS, 496, 2474 [CrossRef] [Google Scholar]
- Murphy, E. J., Stierwalt, S., Armus, L., Condon, J. J., & Evans, A. S. 2013, ApJ, 768, 2 [Google Scholar]
- Neugebauer, G., Habing, H. J., van Duinen, R., et al. 1984, ApJ, 278, L1 [NASA ADS] [CrossRef] [Google Scholar]
- Ohm, S. 2016, C. R. Phys., 17, 585 [NASA ADS] [CrossRef] [Google Scholar]
- Paglione, T. A. D., Marscher, A. P., Jackson, J. M., & Bertsch, D. L. 1996, ApJ, 460, 295 [NASA ADS] [CrossRef] [Google Scholar]
- Peretti, E., Blasi, P., Aharonian, F., & Morlino, G. 2019, MNRAS, 487, 168 [NASA ADS] [CrossRef] [Google Scholar]
- Peretti, E., Morlino, G., Blasi, P., & Cristofari, P. 2022, MNRAS, 511, 1336 [NASA ADS] [CrossRef] [Google Scholar]
- Persic, M., Cappi, M., Rephaeli, Y., et al. 2004, A&A, 427, 35 [NASA ADS] [CrossRef] [EDP Sciences] [Google Scholar]
- Robitaille, T. P., & Whitney, B. A. 2010, Highlights Astron., 15, 799 [NASA ADS] [Google Scholar]
- Romero, G. E., & Torres, D. F. 2003, ApJ, 586, L33 [NASA ADS] [CrossRef] [Google Scholar]
- Romero, G. E., Müller, A. L., & Roth, M. 2018, A&A, 616, A57 [NASA ADS] [CrossRef] [EDP Sciences] [Google Scholar]
- Rossa, J., & Dettmar, R. J. 2000, A&A, 359, 433 [NASA ADS] [Google Scholar]
- Rossa, J., & Dettmar, R. J. 2003, A&A, 406, 505 [NASA ADS] [CrossRef] [EDP Sciences] [Google Scholar]
- Roth, M. A., Krumholz, M. R., Crocker, R. M., & Celli, S. 2021, Nature, 597, 341 [CrossRef] [PubMed] [Google Scholar]
- Sanders, D. B., & Mirabel, I. F. 1996, ARA&A, 34, 749 [Google Scholar]
- Sanders, D. B., Mazzarella, J. M., Kim, D. C., Surace, J. A., & Soifer, B. T. 2003, AJ, 126, 1607 [Google Scholar]
- Shao, L., Koribalski, B. S., Wang, J., Ho, L. C., & Staveley-Smith, L. 2018, MNRAS, 479, 3509 [NASA ADS] [CrossRef] [Google Scholar]
- Stein, Y., Dettmar, R. J., Irwin, J., et al. 2019, A&A, 623, A33 [NASA ADS] [CrossRef] [EDP Sciences] [Google Scholar]
- Strickland, D. K., & Heckman, T. M. 2009, ApJ, 697, 2030 [Google Scholar]
- Strickland, D. K., Heckman, T. M., Weaver, K. A., Hoopes, C. G., & Dahlem, M. 2002, ApJ, 568, 689 [NASA ADS] [CrossRef] [Google Scholar]
- Veilleux, S., Cecil, G., & Bland-Hawthorn, J. 2005, ARA&A, 43, 769 [NASA ADS] [CrossRef] [Google Scholar]
- VERITAS Collaboration (Acciari, V. A., et al.) 2009, Nature, 462, 770 [NASA ADS] [CrossRef] [Google Scholar]
- Vijayan, A., Nath, B. B., Sharma, P., & Shchekinov, Y. 2020, MNRAS, 492, 2924 [NASA ADS] [CrossRef] [Google Scholar]
- Voigtländer, P., Kamphuis, P., Marcelin, M., Bomans, D. J., & Dettmar, R. J. 2013, A&A, 554, A133 [NASA ADS] [CrossRef] [EDP Sciences] [Google Scholar]
- Zheng, Y., Wang, J., Irwin, J., et al. 2022, MNRAS, 513, 1329 [NASA ADS] [CrossRef] [Google Scholar]
Appendix A: Contour maps and z profiles of all the sample galaxies
In this appendix we list the radio contour maps superimposed on Digital Sky Survey (DSS) images (top panels) and z profiles (bottom panels) of all the sample galaxies, except for ESO 428-G028 and ESO 209-G009 which were already shown in Fig. 1 of Section 4. The horizontal axis of the profiles is the offset in arcseconds from the galactic plane in z direction, and the vertical axis is the logarithm of the average flux density in μJy. The data is shown in dots, the fitted disk in dashed line for the galaxies with no halo, while for the galaxies with halos, the fitted disk component is shown in dashed line, the halo component in dotted line and the total fit in solid line.
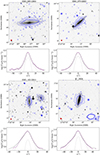 |
Fig. A.1. Radio contour maps superimposed on a DSS image. The contour levels are -3, 3, 9, 15, and 21 times the rms of each radio continuum image, in units of mJy beam−1. The rms are listed in Tables 2 and 3. The synthesized beam of 7.5″ is shown in the bottom left corner of each image. |
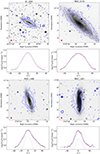 |
Fig. A.1. continued. |
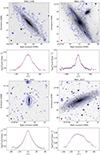 |
Fig. A.1. continued. |
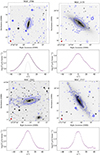 |
Fig. A.1. continued. |
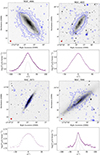 |
Fig. A.1. continued. |
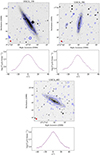 |
Fig. A.1. continued. |
All Tables
Parameters obtained from fitting a two-component function to the z profile of the sample galaxies with halos.
Parameters obtained from fitting a single-component function to the z profile of the sample galaxies without halos.
Surface density of star formation for the sample galaxies with detected halos and the advection velocity of cosmic ray electrons produced in the disk.
Predicted 0.1 − 100 GeV gamma-ray luminosities and fluxes of the sample galaxies with detected halos.
All Figures
|
Fig. 1. Radio contour maps superimposed on a DSS image (top) and z profile (bottom). The horizontal axis of the profiles is the offset in arc-seconds from the galactic plane in z direction, and the vertical axis the average flux density in μJy beam−1. The shaded gray area extends from −3 rms to 3 rms, and the solid line within this area is the residual of the fit. Left panel: ESO 428-G028. The contour levels are −0.07, 0.07, 0.22, 0.37 and 0.52 mJy beam−1. The data is shown with dots and the exponential fitted function with dashed line. Right panel: ESO 209-G009. The contour levels are −0.12, 0.12, 0.36, 0.60 and 0.84 mJy beam−1. The synthesized beam of 7.5″ is shown in the bottom left corner of each image. The data are shown with dots, the fitted disk component in dashed line, the halo component in dotted line and the total fit in solid line. |
| In the text | |
|
Fig. 2. One-component fit for the galaxy ESO 209-G009. The horizontal axis is the offset in arc-seconds from the galactic plane in z direction, and the vertical axis the average flux density in μJy beam−1. The data are shown with dots and the Gaussian fitted function with dashed line. The shaded gray area extends from −3 rms to 3 rms, and the solid line within this area is the residual of the fit. The “wings” of emission above the fit at both sides of the profile together with the residuals being greater than 3 rms suggest that a second component is needed to accurately fit the data. |
| In the text | |
|
Fig. 3. Radio diameter in kiloparsecs vs. distance in megaparsecs for the sample galaxies. The color scale corresponds to the IR luminosity in units of 1010 L⊙. The direct relation between these quantities is a consequence of the selection criteria. |
| In the text | |
|
Fig. 4. Halo scale heights vs. radio diameter, both in kiloparsecs. The sample galaxies are shown in stars, and the linear fit in dotted line, with a slope of 0.028 ± 0.009 and an intercept of 0.4 ± 0.1. The direct relation between these quantities cannot be explained by attributable to any selection criteria, and we consider its origin physical. |
| In the text | |
|
Fig. 5. 1.4 GHz luminosity of the halo in units of 1021 W Hz−1 vs. SFR in M⊙ yr−1. A direct trend can be seen between these two quantities. |
| In the text | |
|
Fig. 6. Radio-IR correlation for the total luminosity (upper panel) and the halo luminosity (bottom panel). The horizontal axis corresponds to the logarithm of the IR luminosity in L⊙ and the vertical axis corresponds to the logarithm of the 1.4 GHz luminosity in W Hz−1. Our sample galaxies are shown as stars and the dotted line corresponds to the linear fit of our data. The fit for the upper panel has a slope of 1.08 ± 0.07 and an intercept of 10.6 ± 0.7, while for the bottom panel, we obtained a slope of 1.1 ± 0.2 and an intercept of 9 ± 2. |
| In the text | |
|
Fig. 7. FIR flux ratio S60/S100 vs. IR luminosity divided by the star formation area ASF for galaxies with detected radio halos. All the galaxies fall in the starburst region of the plot, i.e., they have log(S60/S100) > − 0.5 and log(LIR/ASF) > 0.5. |
| In the text | |
|
Fig. 8. 0.1 − 100 GeV gamma-ray fluxes predicted for our sample galaxies compared with the Kornecki et al. (2022) galaxy sample. The horizontal dashed line corresponds to an estimation of the 10-year sensitivity (Funk et al. 2013). Only NGC 4666 has a flux high enough to potentially be detected by Fermi in the near future. |
| In the text | |
|
Fig. A.1. Radio contour maps superimposed on a DSS image. The contour levels are -3, 3, 9, 15, and 21 times the rms of each radio continuum image, in units of mJy beam−1. The rms are listed in Tables 2 and 3. The synthesized beam of 7.5″ is shown in the bottom left corner of each image. |
| In the text | |
|
Fig. A.1. continued. |
| In the text | |
|
Fig. A.1. continued. |
| In the text | |
|
Fig. A.1. continued. |
| In the text | |
|
Fig. A.1. continued. |
| In the text | |
|
Fig. A.1. continued. |
| In the text | |
Current usage metrics show cumulative count of Article Views (full-text article views including HTML views, PDF and ePub downloads, according to the available data) and Abstracts Views on Vision4Press platform.
Data correspond to usage on the plateform after 2015. The current usage metrics is available 48-96 hours after online publication and is updated daily on week days.
Initial download of the metrics may take a while.