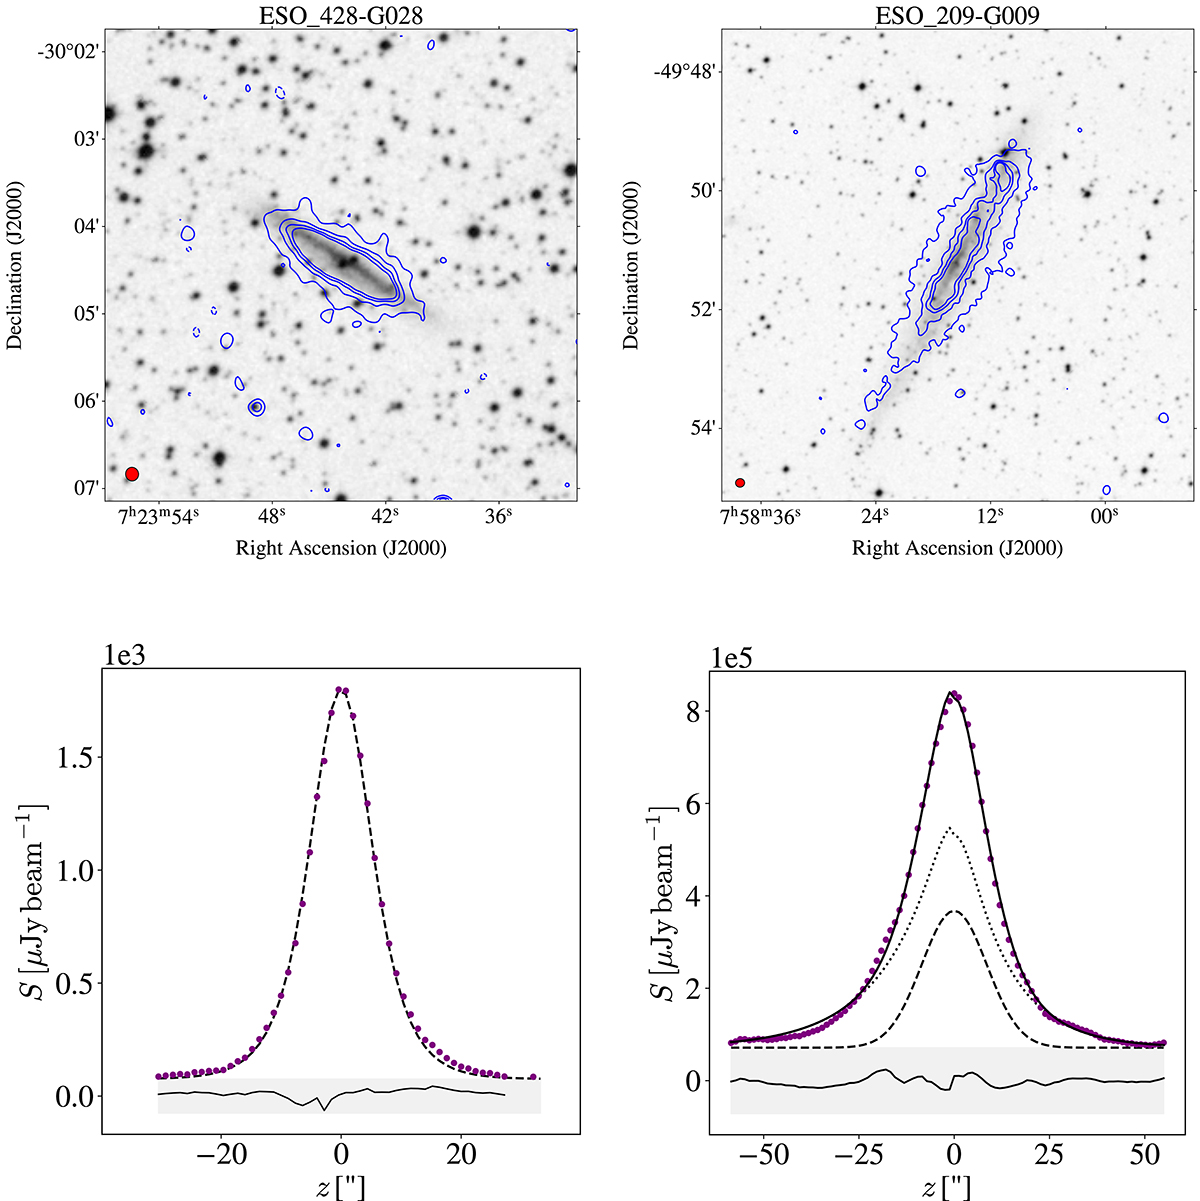
Fig. 1.
Download original image
Radio contour maps superimposed on a DSS image (top) and z profile (bottom). The horizontal axis of the profiles is the offset in arc-seconds from the galactic plane in z direction, and the vertical axis the average flux density in μJy beam−1. The shaded gray area extends from −3 rms to 3 rms, and the solid line within this area is the residual of the fit. Left panel: ESO 428-G028. The contour levels are −0.07, 0.07, 0.22, 0.37 and 0.52 mJy beam−1. The data is shown with dots and the exponential fitted function with dashed line. Right panel: ESO 209-G009. The contour levels are −0.12, 0.12, 0.36, 0.60 and 0.84 mJy beam−1. The synthesized beam of 7.5″ is shown in the bottom left corner of each image. The data are shown with dots, the fitted disk component in dashed line, the halo component in dotted line and the total fit in solid line.
Current usage metrics show cumulative count of Article Views (full-text article views including HTML views, PDF and ePub downloads, according to the available data) and Abstracts Views on Vision4Press platform.
Data correspond to usage on the plateform after 2015. The current usage metrics is available 48-96 hours after online publication and is updated daily on week days.
Initial download of the metrics may take a while.