Fig. 2.
Download original image
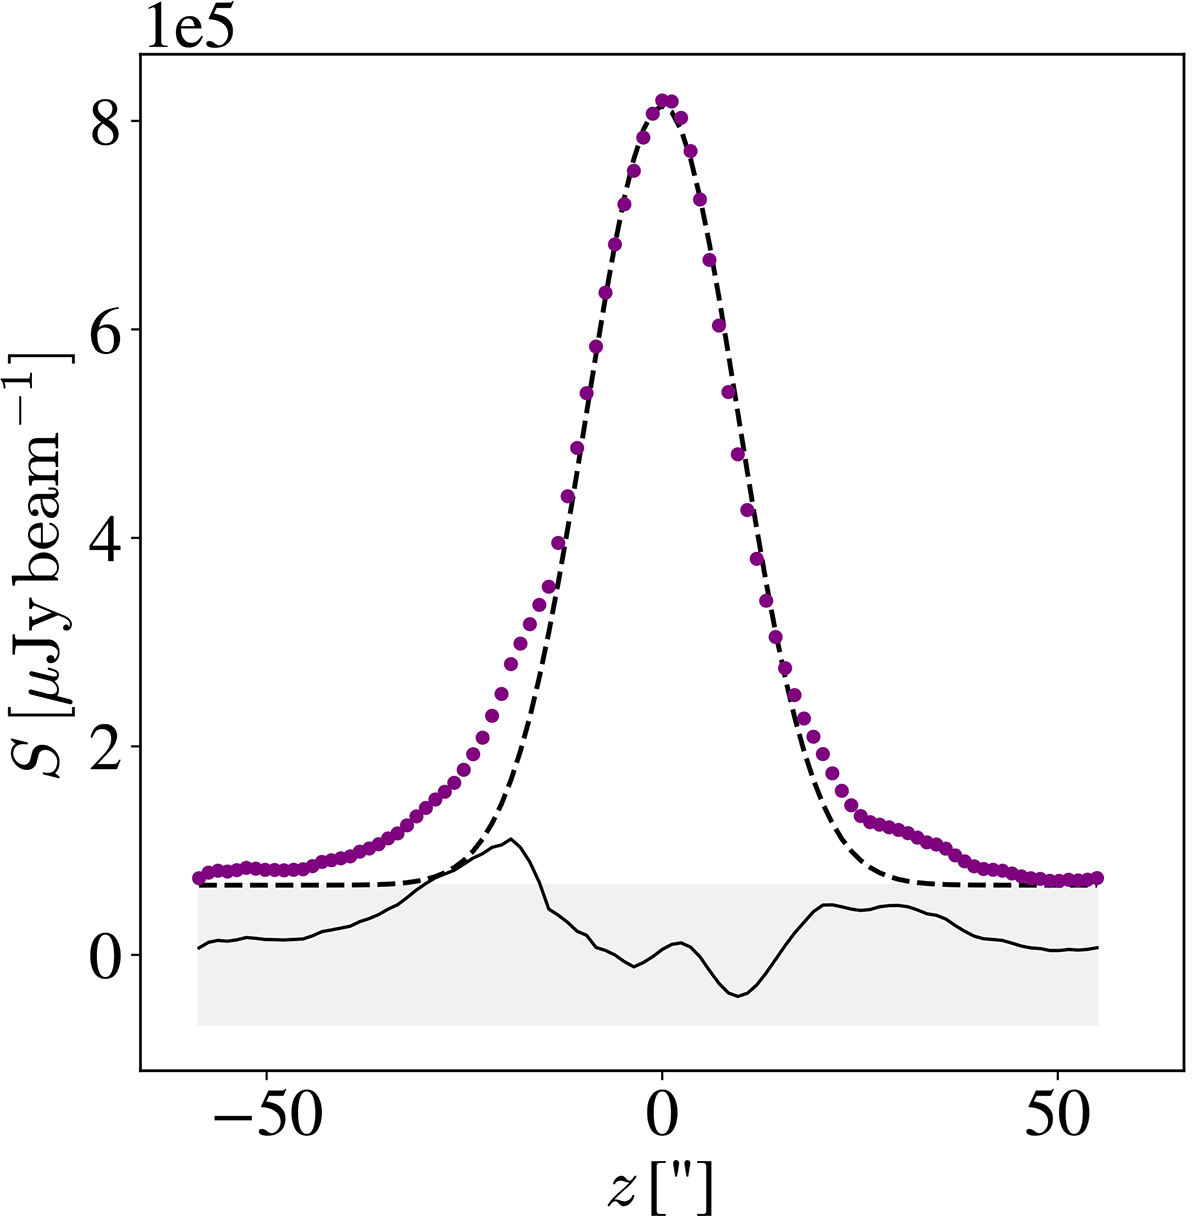
One-component fit for the galaxy ESO 209-G009. The horizontal axis is the offset in arc-seconds from the galactic plane in z direction, and the vertical axis the average flux density in μJy beam−1. The data are shown with dots and the Gaussian fitted function with dashed line. The shaded gray area extends from −3 rms to 3 rms, and the solid line within this area is the residual of the fit. The “wings” of emission above the fit at both sides of the profile together with the residuals being greater than 3 rms suggest that a second component is needed to accurately fit the data.
Current usage metrics show cumulative count of Article Views (full-text article views including HTML views, PDF and ePub downloads, according to the available data) and Abstracts Views on Vision4Press platform.
Data correspond to usage on the plateform after 2015. The current usage metrics is available 48-96 hours after online publication and is updated daily on week days.
Initial download of the metrics may take a while.