| Issue |
A&A
Volume 681, January 2024
|
|
|---|---|---|
| Article Number | L9 | |
| Number of page(s) | 4 | |
| Section | Letters to the Editor | |
| DOI | https://doi.org/10.1051/0004-6361/202347810 | |
| Published online | 08 January 2024 | |
Letter to the Editor
HD 214220 (BD+56 2813): An eclipsing binary with its primary component at the end of the main sequence
Physikalisch-Meteorologisches Observatorium Davos and World Radiation Center (PMOD/WRC), Dorfstrasse 33, 7260 Davos Dorf, Switzerland
e-mail: This email address is being protected from spambots. You need JavaScript enabled to view it.
Received:
26
August
2023
Accepted:
21
December
2023
Abstract
Context. Analysis of the light curves of an eclipsing binary allows one to derive the absolute dimensions of the system. This in turn yields information on the radii of the components, which allows the stars to be accurately placed on the Hertzsprung-Russell diagram and their evolutionary phase to be interpreted via comparisons to tracks of stellar evolution models.
Aims. I aim to derive the stellar and system parameters of HD 214220.
Methods. I measured the epochs of three primary and three secondary minima of the eclipsing binary HD 214220 from 2019 to 2022 from photometric fluxes obtained by the TESS satellite. I modeled the light curve and the velocity amplitudes, which were obtained by the Gaia satellite, with the software PHOEBE.
Results. HD 214220 is an eclipsing binary system with an orbital period of P = 43.14 d, eclipse depths of 17% and 13%, and masses of 2.49 M⊙ and 2.42 M⊙. The sum of the radii is R1 + R2 ≈ 8.5 R⊙, and the temperatures of the components are similar, with a ratio of T2/T1 ≈ 1.03.
Conclusions. By consulting stellar evolution models, I find that the primary component has ended core hydrogen burning and is potentially in the contraction phase, prior to shell burning.
Key words: binaries: eclipsing / binaries: spectroscopic / stars: evolution / stars: fundamental parameters
© The Authors 2024
 Open Access article, published by EDP Sciences, under the terms of the Creative Commons Attribution License (https://creativecommons.org/licenses/by/4.0), which permits unrestricted use, distribution, and reproduction in any medium, provided the original work is properly cited.
This article is published in open access under the Subscribe to Open model. This email address is being protected from spambots. You need JavaScript enabled to view it. to support open access publication.
1. Introduction
HD 214220 (BD+56 2813, NSV 25926) is known as a comparison star for photometric observations of CQ Cep (e.g. Gaposchkin 1944; Hiltner 1950; Demircan et al. 1997). Only very recently was it discovered to be a binary, when Gaia Data Release 3 (DR3, Gaia Collaboration 2023) yielded a double-lined spectroscopic binary model solution for the measured radial velocities. From an investigation of TESS photometry, it was determined that the star was not only an SB2 but also an Algol-type eclipsing binary (type EA)1, making this system an interesting object worthy of analysis.
2. Photometric measurements
The photometric observations comprise four light curve sets, from sectors 16, 17 (September and October 2019), 24 (April and May 2020), and 57 (October 2022); each are about 25 d and were obtained by the TESS satellite (Ricker et al. 2015). The data used in this Letter can be found at the Mikulski Archive for Space Telescopes2. A 17 × 17 pixel cutout was downloaded from the TESS archive using search_tesscut (Ginsburg et al. 2019). The light curves were produced via simple aperture photometry (SAP) with a 12-pixel stellar mask, and the background was evaluated from the average of the order of 150 pixels that had the lowest count rates in the image frame. Light curves were extracted and normalized with the software provided by the Lightkurve Collaboration (2018). The combined light curves of HD 214220 cover three primary minima and four secondary minima, whereas the secondary minimum in 2022 is compromised by data gaps and a strongly variable background level. This fourth secondary minimum was not used in the analyses given below and is not included in Table 1 or Fig. 1.
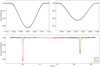 |
Fig. 1. Normalized light curve folded with P = 43.1426 d and T0 = BTJD 1716.309. The 30-minute-interval measurements from four sectors are indicated by colored dots. Top panels: Primary minimum (left) and secondary minimum (right), with the result of the light curve fitting (see Sect. 3) illustrated by a black line. Bottom panel: Same as the top figures, but displaying a full orbital period. |
Observed minima epochs of HD 214220.
Outside the eclipses, the SAP light curves had variations on the order of 1% over timescales of days and longer. It turned out that these variations are shared by several close-by stars of similar brightnesses. Therefore, the light curve of each sector was divided by that of the neighbor star BD+56 2816, which has a similar brightness in the red. The division removed these variations but introduced short-term variations on the order of 0.3%, which are mostly due to variations in the light curve of the comparison star. In Fig. 1 the resulting light curve is shown; it is clear that outside the eclipses the light curve is stable and flat within the limitations of the relative calibration.
The epochs of the six well-observed minima were measured by fitting a Gauss-like function, aexp(−(∣(t−T1, 2)∣/Δt)γ), using the optimize routine from the Python SciPy package (Virtanen et al. 2020), to each normalized eclipse curve. This yielded epochs of primary or secondary minima, T1 or T2, respectively. The free parameters Δt, a, and γ describe the duration and shape of the eclipse curves. The epochs of the minima are given in Table 1. The listed uncertainties are the formal error of the fit procedure. These uncertainties can be verified because the minima timings of each eclipse type have to lie on a linear ephemeris. Despite the marginal statistics, it turns out that the precision of the fit given by the optimize routine is a factor of five lower than the standard deviation of the residuals from a linear fit. Given the long time intervals between the measurements, this could be due to a slight change in the period, which can be verified by future measurements of the minima epochs. The linear ephemeris fit to the three primary minima is
 (1)
(1)
where the uncertainties of the period P1 and the epoch T0 are given by the standard uncertainties of the fit. The secondary minimum is at phase 0.6711 ± 0.00005, which is 7.384 ± 0.002 d after mid-period. A linear fit to the three secondary minima yields P2 = 43.1418 ± 0.0007 d. The larger uncertainty of P2 is due to the shorter time interval of the observed secondary minima. The period difference is not significant.
3. Computation of system and stellar parameters
The Gaia spacecraft (Gaia Collaboration 2016) has measured radial velocity variations in the near infrared with its Radial-Velocity Spectrometer (RVS; Cropper et al. 2018). The information given in Table 2 has been published in Gaia DR3 (Gaia Collaboration 2022), but the individual 25 radial velocity measurements are not listed.
Values published for HD 214220 by Gaia DR3 for a non-single-star orbital model compatible with a double-lined spectroscopic binary model (Gaia Collaboration 2022).
The period determined from the radial velocity measurements, PRV, differs from the TESS period, P1, by eight times the given uncertainty, which might indicate that the Gaia orbital solution has systematic uncertainties in addition to the quoted uncertainty values. The difference of the secondary minimum to the mid-orbit of the light curve yields an accurate measure of e cos ω = 0.270, which agrees, within the uncertainty, with the value obtained from the Gaia measurements. The radial velocity amplitudes and the period imply that the absolute dimension of the semimajor axis is a sin i = 0.4086 ± 0.0009 AU, the ratio of the masses q = M2/M1 = 0.972 ± 0.006, and the total mass of the system (M1 + M2)sin3i = 4.889 ± 0.037 M⊙.
The light curve shows partial eclipses with depths of 17% and 13%. An analysis of the eclipses allows one to determine the inclination, the sum of the radii of the two stars, and the ratio of brightness temperatures in the TESS passband. Thus, not all stellar parameters can be derived for this system, and the individual stellar temperatures and the ratio of the radii remain undetermined. The light curve shown in Fig. 1 was calculated with PHOEBE, version 2.4.4 (Conroy et al. 2020), using the parameter values of solution 3 in Table 3. Using the Nelder-Mead optimizer, five parameters were fitted, T1, R1, i, e, and ω for given P, q = M2/M1, T2, R2, and a sin i. For the temperatures of the secondary, T2, the values corresponding to the radius R2 on the evolutionary track for M2 = 2.42 M⊙ were adopted. But it is the temperature ratio, T2/T1, that matters, and the absolute values of the stellar temperature do not significantly influence the solution. The atmospheres and their limb darkening are represented by Phoenix atmospheres, and the reflection efficiency was set to 1. The stars were computed in spherical mode with 500 triangles.
Parameters derived by fitting the light curve with PHOEBE.
Solutions for different sets of radii are listed in Table 3. Optimized fits result in only slightly different values for the inclinations i = 86.4° ±0.2°. This range of inclinations yields sin3i values that differ by only ±0.02%, and the system semimajor axis is a = 0.4093 ± 0.0010 AU. As the uncertainty of the period was determined to be 9 ppm, this implies that the uncertainties of the derived stellar masses are dominated by the uncertainty of the radial velocity measurements. The resulting masses are M1 = 2.49 ± 0.03 M⊙ and M2 = 2.42 ± 0.03 M⊙.
Other parameters show a larger spread of values as a function of the secondary’s radius. However, not all values of R2 are realistic when considering stellar evolution predictions, as discussed in Sect. 4. We find that the secondary’s radius is 3.6 ≤ R2 ≤ 4.1 R⊙. Therefore, I adopted the results derived by the PHOEBE fits to the mean of solutions 2 and 3, which are given in the row marked ⟨2+3⟩ in Table 3. For the uncertainties, the differences of the extremes are considered to reflect a realistic uncertainty.
The eccentricity, e = 0.289 ± 0.002, and longitude of periastron, ω = 21.0° ±1.0°, from the fits to the light curve confirm the values given in Table 2 and derived by the Gaia solution. The two epochs of periastron derived from Gaia or TESS measurements,  and
and  , differ by 0.4 d if computed for each other’s epoch. There are 31 orbits between the two epochs, and a period computed from the two epochs is Pperi = 43.1566 ± 0.0019, which is outside the uncertainties of the period P1 derived in Sect. 2. This disagreement could indicate that the period is not constant.
4. Discussion
Ekström et al. (2012) published two sets of stellar evolution: one with and one without rotational mixing of the convective core. Interpolating the tracks linearly in logarithmic values of the tabulated values yields the evolution of the radii as a function of age for the two stellar masses derived in Sect. 3. In the non-rotationally mixed case there is a pair at a common age of  Myr that corresponds to the sum of radii ΣRn = 8.40 R⊙ with the stellar parameters
  K,
K,  and
and  K,
K,  3. The evolutionary predicted ratio of the temperatures is
  , which clearly differs from the value derived from the eclipse curve T2/T1 = 1.025 (see solution 2 in Table 3): relative to the temperature of the secondary, the primary is too cool.
The rotationally mixed evolution yields a combined radius value of ΣRr = 8.51 R⊙ for an age of  Myr with the parameters of the stellar pair
  K,
K,  and
and  K,
K,  . The locations of the two stars on the Hertzsprung-Russell diagram are indicated by filled circles in Fig. 2. In this case, the primary star is at an early stage of shell hydrogen burning immediately following the contraction phase, for which there is a brief period, of a few megayears, during which the more massive star is predicted to be hotter than the less massive one. As the light curve solution indicates that the primary is not hotter but somewhat cooler than the secondary (see solution 3 in Table 3), this evolutionary case does not fit either. However, only slightly earlier, at an evolutionary age of 673 Myr, the theoretical temperature ratio agrees with the measured temperature ratio of T2/T1 = 1.036. This stellar pair is indicated by open circles in Fig. 2. The sum of the radii at that time is ΣRr = 8.04 R⊙, which is outside of the uncertainty range determined by the light curve fits.
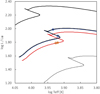 |
Fig. 2. Hertzsprung-Russell diagram. The black lines indicate the evolutionary tracks computed with rotational mixing of the core (Ekström et al. 2012) for the masses M = 2.0 M⊙, 2.5 M⊙, and 3.0 M⊙. The blue and red lines denote the interpolated evolutionary tracks for M = 2.42 M⊙ and 2.49 M⊙, respectively. The filled circles mark the location for an evolutionary age |


Most likely, the evolutionary stage of the primary is in between the two evolutionary ages discussed above. Interestingly, these nearly coincide with the beginning and end of the contraction phase, which forms the characteristic evolutionary “hook” at the end of the main sequence. To the knowledge of the author, there is no observational confirmation that such an evolutionary excursion exists and that stellar evolution does not follow a monotonic increase in luminosity and radius and a monotonic decrease in temperature.
5. Conclusions
The derived system and stellar parameters of HD 214220 are listed in Table 4. In order to be able to conclude with more certainty on the evolutionary phase of the primary, more accurate information on the stellar temperatures is needed. High-resolution spectroscopic observations of an entire orbit would yield more precise orbital velocities (i.e., more precise stellar masses), and the effective temperatures could be determined with spectroscopic analyses. If the stellar temperatures are known, the light curve yields absolute values of both radii. In addition, measured rotational velocities of the stars would indicate which evolutionary set, with or without rotational mixing of the core, should be used.
Derived system and stellar parameters of HD 214220.
There is a chance that the primary is in the core-contracting evolutionary phase, which is very difficult to diagnose observationally because not only the temperature and radius need to be determined precisely, but also the mass. In light of this potentially very interesting phase of the primary, I suggest analyzing this system in more detail.
For definitions of variable types, see GCVS Variability Types of the General Catalogue of Variable Stars (Samus’ et al. 2017).
The upper index, n, designates non-rotationally mixed core evolution, and r denotes rotationally mixed core evolution.
Acknowledgments
I am grateful to an anonymous referee for valuable comments and that he pointed out a mistake in the calculation of the masses. This work is based on data obtained by the TESS and Gaia missions. Funding for the TESS mission is provided by the NASA’s Science Mission Directorate. Data from the European Space Agency (ESA) mission Gaia (https://www.cosmos.esa.int/gaia) is processed by the Gaia Data Processing and Analysis Consortium (DPAC, https://www.cosmos.esa.int/web/gaia/dpac/consortium). Funding for the DPAC has been provided by national institutions, in particular the institutions participating in the Gaia Multilateral Agreement. The following software was used: Astropy (Astropy Collaboration 2018); Lightkurve (Lightkurve Collaboration 2018); PHOEBE (Prša & Zwitter 2005; Prša et al. 2016; Conroy et al. 2020).
References
- Astropy Collaboration (Price-Whelan, A. M., et al.) 2018, AJ, 156, 123 [Google Scholar]
- Conroy, K. E., Kochoska, A., Hey, D., et al. 2020, ApJS, 250, 34 [Google Scholar]
- Cropper, M., Katz, D., Sartoretti, P., et al. 2018, A&A, 616, A5 [NASA ADS] [CrossRef] [EDP Sciences] [Google Scholar]
- Demircan, O., Ak, H., Ozdemir, S., Tanriver, M., & Albayrak, B. 1997, Astron. Nachr., 318, 267 [NASA ADS] [CrossRef] [Google Scholar]
- Ekström, S., Georgy, C., Eggenberger, P., et al. 2012, A&A, 537, A146 [Google Scholar]
- Gaia Collaboration 2022, VizieR Online Data Catalog: I/357 [Google Scholar]
- Gaia Collaboration (Prusti, T., et al.) 2016, A&A, 595, A1 [NASA ADS] [CrossRef] [EDP Sciences] [Google Scholar]
- Gaia Collaboration (Vallenari, A., et al.) 2023, A&A, 674, A1 [NASA ADS] [CrossRef] [EDP Sciences] [Google Scholar]
- Gaposchkin, S. 1944, ApJ, 100, 242 [NASA ADS] [CrossRef] [Google Scholar]
- Ginsburg, A., Sipőcz, B. M., Brasseur, C. E., et al. 2019, AJ, 157, 98 [Google Scholar]
- Hiltner, W. A. 1950, ApJ, 112, 477 [NASA ADS] [CrossRef] [Google Scholar]
- Lightkurve Collaboration (Cardoso, J. V. D. M.) 2018, Astrophysics Source Code Library [record ascl:1812.013] [Google Scholar]
- Prša, A., & Zwitter, T. 2005, ApJ, 628, 426 [Google Scholar]
- Prša, A., Conroy, K. E., Horvat, M., et al. 2016, ApJS, 227, 29 [Google Scholar]
- Ricker, G. R., Winn, J. N., Vanderspek, R., et al. 2015, J. Astron. Telesc. Instrum. Syst., 1, 014003 [Google Scholar]
- Samus’, N. N., Kazarovets, E. V., Durlevich, O. V., Kireeva, N. N., & Pastukhova, E. N. 2017, Astron. Rep., 61, 80 [Google Scholar]
- Virtanen, P., Gommers, R., Oliphant, T. E., et al. 2020, Nat. Meth., 17, 261 [Google Scholar]
All Tables
Values published for HD 214220 by Gaia DR3 for a non-single-star orbital model compatible with a double-lined spectroscopic binary model (Gaia Collaboration 2022).
All Figures
|
Fig. 1. Normalized light curve folded with P = 43.1426 d and T0 = BTJD 1716.309. The 30-minute-interval measurements from four sectors are indicated by colored dots. Top panels: Primary minimum (left) and secondary minimum (right), with the result of the light curve fitting (see Sect. 3) illustrated by a black line. Bottom panel: Same as the top figures, but displaying a full orbital period. |
| In the text | |
|
Fig. 2. Hertzsprung-Russell diagram. The black lines indicate the evolutionary tracks computed with rotational mixing of the core (Ekström et al. 2012) for the masses M = 2.0 M⊙, 2.5 M⊙, and 3.0 M⊙. The blue and red lines denote the interpolated evolutionary tracks for M = 2.42 M⊙ and 2.49 M⊙, respectively. The filled circles mark the location for an evolutionary age |
| In the text | |
Current usage metrics show cumulative count of Article Views (full-text article views including HTML views, PDF and ePub downloads, according to the available data) and Abstracts Views on Vision4Press platform.
Data correspond to usage on the plateform after 2015. The current usage metrics is available 48-96 hours after online publication and is updated daily on week days.
Initial download of the metrics may take a while.