Fig. 2.
Download original image
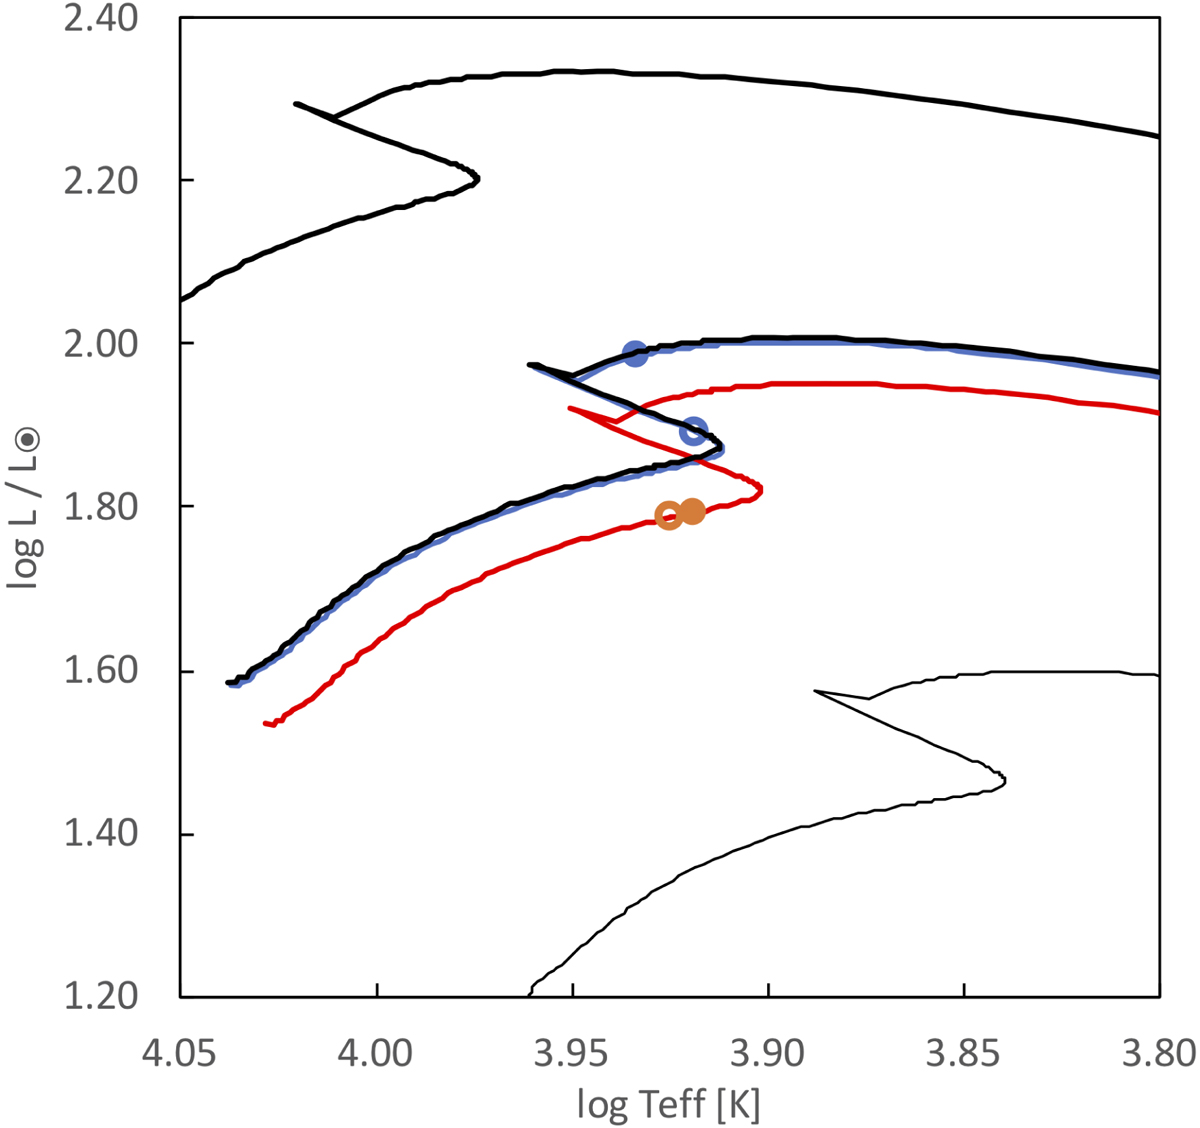
Hertzsprung-Russell diagram. The black lines indicate the evolutionary tracks computed with rotational mixing of the core (Ekström et al. 2012) for the masses M = 2.0 M⊙, 2.5 M⊙, and 3.0 M⊙. The blue and red lines denote the interpolated evolutionary tracks for M = 2.42 M⊙ and 2.49 M⊙, respectively. The filled circles mark the location for an evolutionary age ![]() Myr, where the sum of the stellar radii is ΣRr = 8.51 R⊙, and the open circles denote
Myr, where the sum of the stellar radii is ΣRr = 8.51 R⊙, and the open circles denote ![]() Myr, for which
Myr, for which ![]() .
.
Current usage metrics show cumulative count of Article Views (full-text article views including HTML views, PDF and ePub downloads, according to the available data) and Abstracts Views on Vision4Press platform.
Data correspond to usage on the plateform after 2015. The current usage metrics is available 48-96 hours after online publication and is updated daily on week days.
Initial download of the metrics may take a while.