| Issue |
A&A
Volume 689, September 2024
|
|
|---|---|---|
| Article Number | A224 | |
| Number of page(s) | 26 | |
| Section | Catalogs and data | |
| DOI | https://doi.org/10.1051/0004-6361/202347798 | |
| Published online | 13 September 2024 | |
Precise Fourier parameters of Cepheid radial velocity curves: Towards refining the Hertzsprung progression models
1
Nicolaus Copernicus Astronomical Centre, Polish Academy of Sciences,
Bartycka 18,
00-716
Warszawa,
Poland
2
Sternberg Astronomical Institute, Moscow State University,
119234
Moscow,
Russia
3
Institute of Astronomy, Russian Academy of Sciences,
119017
Moscow,
Russia
Received:
25
August
2023
Accepted:
20
June
2024
Abstract
Context. Radial velocity (RV) curves of Classical Cepheids allow precise determination of the resonant periods, which in turn help to constrain fundamental parameters of these stars. The RV curves of Cepheids are also useful for identifying their pulsation modes and for distance determination using the parallax-of-pulsation method.
Aims. The primary goal of this paper is to derive precise Fourier parameters of the RV curves for fundamental and first-overtone Galactic Cepheids. Our secondary objectives are then to analyze the progression of the Fourier parameters up to the seventh harmonic, and to propose an identification of the pulsation modes of the stars.
Methods. For each star, we carefully selected RV measurements available in the literature that yield the highest precision of Fourier parameters according to the procedure that follows. We performed a Fourier decomposition of the RV curves using the unweighted least-square method and the standard deviation of the fit was used to derive the uncertainty on the Fourier parameters. We corrected for zero-point differences between datasets and RV modulations caused by binary motion.
Results. With this study we have more than doubled the number of Cepheids with published RV curve Fourier parameters and with their uncertainty properly estimated. Our sample includes 178 fundamental-mode and 33 first-overtone pulsators, as well as 7 additional Cepheids whose pulsation mode is uncertain or undetermined according to our criteria. For the fundamental-mode Cepheids, the precision of the obtained low-order Fourier phases and amplitudes is about seven times and 25% better, respectively, as compared to the precision achieved in previously published Fourier parameter surveys. With highly accurate RV Fourier phases ϕ21, we are able to firmly identify V495 Cyg as a new first-overtone Cepheid and we confirm the first-overtone nature of several other stars. In particular, α UMi should be firmly classified as a first-overtone pulsator. In three objects (VY Per, AQ Pup, and QZ Nor), we find significant γ-velocity variations, which for the first two objects (and possibly for QZ Nor as well) can be attributed to the spectroscopic binarity of these stars. Finally, the analysis of the fundamental mode Fourier parameters up to seventh order reveals tight progression of Fourier phases for all pulsation periods.
Conclusions. We provide new precise Fourier parameters of Cepheid RV curves determined from RV measurements available in the literature together with unpublished data. The pulsation period coverage and the precision obtained, in particular for Fourier phase ϕ21, will be useful for studying the dynamics of Cepheid pulsations with the help of hydrodynamical models. Further RV measurements from modern high-resolution spectroscopic instruments will be important to improve these results.
Key words: techniques: radial velocities / stars: oscillations / stars: variables: Cepheids
Corresponding author; This email address is being protected from spambots. You need JavaScript enabled to view it.
© The Authors 2024
 Open Access article, published by EDP Sciences, under the terms of the Creative Commons Attribution License (https://creativecommons.org/licenses/by/4.0), which permits unrestricted use, distribution, and reproduction in any medium, provided the original work is properly cited.
This article is published in open access under the Subscribe to Open model. This email address is being protected from spambots. You need JavaScript enabled to view it. to support open access publication.
1 Introduction
The shape of the radial velocity (RV) curve of Cepheids provides information on their stellar structure and dynamics. In the case of fundamental Cepheid light curves, Ludendorff (1919) and Hertzsprung (1926) noticed that their shape varies systematically with the pulsation period. A secondary bump superimposed on the light curve appears first on its descending branch at a period of about P ≃ 6 days. With increasing period, it moves toward maximum light, reaches the top of the light curve at P ≃ 10 days, and then moves down the ascending branch at periods of P > 10 days. This systematic behavior is called the Hertzsprung progression, or bump progression, and was later verified among Cepheids in the Magellanic Clouds and Andromeda Galaxy (Parenago & Kukarkin 1936; Shapley & McKibben 1940; Payne-Gaposchkin 1947). Similar bump progression is observed for the RV curves (Joy 1937; Ledoux & Walraven 1958; Simon & Teays 1983; Kovács et al. 1990; Gorynya 1998; Moskalik et al. 2000).
Bump progression was first assumed to be caused by a pressure wave propagating inward, then reflecting on the stellar core, and traveling back to reach the surface, producing the observed bump (this is known as the echo model, Whitney 1956; Christy 1968, 1975). Following the hydrodynamical models of Stobie (1969), Simon & Schmidt (1976) conjectured that the bump progression is due to the P2/P0 = 0.5 resonance between the fundamental and the second overtone pulsation modes characterized by pulsation periods of P0 and P2, respectively. Subsequently, the crucial role of the 2:1 resonance was confirmed with the extensive set of hydrodynamical models of Buchler et al. (1990), and Moskalik et al. (1992), and understood analytically with the amplitude equation formalism (Buchler & Kovács 1986; Kovács & Buchler 1989). As the resonance is a dynamical phenomenon, RV curves are better suited for comparison with models than the light curves. This is so because light curves computed with hydrodynamical models are subject to larger uncertainties resulting from an approximate treatment of the radiative transfer in the outer layers of the model.
For example, RV curves of first-overtone Cepheids display a prominent resonance around 4.6 days (Kienzle et al. 1999), in agreement with hydrodynamical models, which predict a P4/P1 = 0.5 resonance between the fourth and the first overtone (Kienzle et al. 1999; Feuchtinger et al. 2000). In contrast, the light curves present a sharp feature at 3.2 days, which is not centered at the P4/P1 = 0.5 resonance (Kienzle et al. 1999). This demonstrates the importance of RV curves for studying dynamical effects.
Simon & Lee (1981) and Simon & Teays (1983) showed that the Fourier parameters can efficiently describe the shape of the light and RV curves. Therefore, they can be used to quantitatively compare the models and the observations. In particular, the Fourier phase ϕ21 of the RV curve of the fundamental mode depends almost exclusively on the resonant period ratio P2/P0 and is numerically robust (Buchler et al. 1990). The same is true for first-overtone Cepheids, where the Fourier phase ϕ21 depends on P4/P1 (Kienzle et al. 1999). Thus, using observed RV curves it is possible to derive the period ratios for individual Cepheids, which in turn can be used to constrain their internal structure as well as their mass-luminosity relation (Moskalik & Krzyt 1998).
Radial velocity curves are also indispensable when using the parallax-of-pulsation technique for individual distance determination of Cepheids (also known as the Baade-Wesselink (BW) method; Lindemann 1918; Baade 1926; Becker 1940; Wesselink 1946). Although some authors emphasize the importance of homogeneous and consistent RV measurements for applying the BW method (see, e.g., Anderson 2018b; Borgniet et al. 2019), in practice the community has to deal with multiple datasets obtained from different instruments and cross-correlation measurement methods, and therefore a consistent method for fitting RV measurements of several datasets altogether would be valuable.
Obtaining precise Fourier parameters for a large sample of short and long-period Cepheids is thus essential in order to reconstruct the Hertzsprung progression and explore it up to higher order. Of paramount importance is the precision of observational ϕ21 from RV curves, which not only directly impacts the error on the period ratio P2|P1 and P4 |P1 (Moskalik & Krzyt 1998), but is also a very useful tool for discriminating fundamental and first-overtone mode Cepheids, especially for pulsation periods above 5 days (Antonello et al. 1990).
Owing to the continuous effort of observers, the number of stars available for reconstruction of the bump progression and the precision of Fourier parameters have increased over time. Using a compilation of nine different sources from the literature, Simon & Teays (1983) were the first to analyse the RV curves for 11 classical fundamental-mode and 1O-mode Cepheids. A compilation of the Fourier parameters of 57 RV curves with median uncertainties of σ(ϕ21) = 0.18 was later provided by Kovács et al. (1990), who compiled RV data from 41 sources. Moskalik et al. (2000) also collected measurements for 131 Cepheids and reported a median uncertainty of σ(ϕ21) = 0.08. Storm et al. (2011) provided Fourier parameters together with their uncertainty for 76 Galactic Cepheids using a compilation of 60 sources from the literature, providing an average uncertainty of σ(ϕ21) = 0.18. In the case of first-overtone Cepheids, Kienzle et al. (1999) published Fourier parameters for 16 stars with a median uncertainty of σ(ϕ21) = 0.09.
In recent years, many new high-quality RV observations have been collected (see, e.g., Anderson et al. 2016a; Borgniet et al. 2019; Gallenne et al. 2019; Nardetto et al. 2023). In this work, we take advantage of these recent measurements in combination with an extensive dataset from the older literature to enlarge the number of Cepheids with known Fourier parameters and improve their precision. The paper is dedicated to the Galactic single-mode Classical Cepheids (Population I Cepheids), which pulsate either in the fundamental mode or in the first-overtone mode. We present our dataset and our method for Fourier decomposition in Sect. 2. We present our results on the precision of Fourier parameters in Sect. 3.1, on the identification of first-overtone pulsators in Sect. 3.2, and on newly found binary Cepheids in Sect. 3.3. In Sect. 4, we discuss the progression of the low- and high-order Fourier parameters with the pulsation period as well as the relationships between these parameters. We conclude in Sect. 5.
2 Fourier decomposition of RV curves
2.1 Dataset of RV measurements
For each star, we first collected the RV measurements available in the literature. All RV measurements used in this study are derived from high-resolution spectroscopy observations of metallic lines. Indeed, metallic lines represent a robust and longstanding verified approach to obtain reliable RV measurements from the Cepheid photosphere. However, the use of Gaia Radial Velocity Spectrometer (RVS, Gaia Collaboration 2016, 2023) measurements based on calcium infrared triplet lines (Munari 1999; Katz et al. 2023) is beyond the scope of this paper. Although Ripepi et al. (2023) reported the reliability of the Gaia RV measurements for Cepheids, the dynamical effects observed in the calcium triplet of several Galactic Cepheids (Wallerstein et al. 2015, 2019; Hocdé et al. 2020) require further investigation in order to evaluate their impact on RV measurements compared to optical metallic spectral lines. Finally, most of the RV measurements we collected were obtained with the cross-correlation technique (optical and numerical; Griffin 1967; Baranne et al. 1979, 1996), which is an important requirement for the application of the Baade-Wesselink method (Borgniet et al. 2019).
In our final sample, we only include the Cepheids for which we derived the most precise Fourier parameters, as described in the following sections. This sample consists of 178 fundamental and 33 first-overtone Cepheids and 7 Cepheids of uncertain or undetermined pulsation mode. The entire dataset used in the analysis is composed of 83 different sources of RV measurements, which are listed in Table B.1. These measurements are of differing quality, with data from Anderson (2014), Anderson et al. (2015), Anderson (2016), Anderson et al. (2016a) and Borgniet et al. (2019) being the most precise. The older datasets, such as those of Coulson & Caldwell (1985), Coulson et al. (1985), Feast (1967), Lloyd Evans (1968, 1980) and Stibbs (1955), have the lowest quality. For several Cepheids, Fourier decomposition based on high-quality RV data has already been published by Kienzle et al. (1999), Pont et al. (2001), and Baranowski et al. (2009). For the sake of uniformity, we decided to reanalyze all these stars, supplementing the old data with newer measurements if available (five stars). The resulting Fourier parameters were found to be the same as in the original papers within the errors. All these stars are included in Table B.1 and in following tables. In the following sections, we detail the steps of the Fourier decomposition, the different corrections applied, and the quality classification of the fits.
2.2 Fourier decomposition
We decomposed the RV curves into Fourier sine series by least-square fitting of the data (unweighted) with the following formula:
![Mathematical equation: ${V_r}(t) = {A_0} + \mathop \sum \limits_{k = 1}^n {A_k}\sin [k\omega t + {\phi _k}],$](/articles/aa/full_html/2024/09/aa47798-23/aa47798-23-eq1.png) (1)
(1)
where Vr(t) is the RV measured at time t, and Ak and ϕk are the amplitude and phase of the k Fourier component. Each harmonic is a multiple of the fundamental frequency ω = 2π/P. The pulsation period, P, is also optimized in the fitting process. We used the dimensionless Fourier parameters introduced by Simon & Lee (1981):
 (2)
(2)
 (3)
(3)
where ϕl1 are then adjusted to lie between 0 and 2π. Choosing the appropriate order of the fit n is important because an excessively low order may lead to higher uncertainties on the Fourier parameters, while the noise might be fitted if an order is too high. Many studies simply fix the order of the fit depending on the pulsation period of the star. We adopt a more adaptive approach where the order of the fit n is iterated until  . In some cases, we included one or two higher harmonics in order to stabilize the fit.
The standard deviation of the fit is given by
 (4)
(4)
where N is the number of data points, n the order of the fit, and Vr(ti) and  are the RV data and the Fourier model, respectively. The derived standard deviation of the fit is then used to apply an iterative 3σ data clipping. In this step, we remove data points deviating from the fit by more than 3σ. This is a standard outlier-rejection technique commonly used in the literature.
2.3 Errors of Fourier parameters
The precision and accuracy of Fourier parameters depend primarily on the uncertainties of the RV observations, the number of data points, and the phase coverage. In this study, we collected data for each Cepheid from various observers and merged them together. This approach has the advantage of maximizing the number of data points and completing the phase coverage for many Cepheids. However, this comes at a cost - we have to deal with inhomogeneous uncertainties of datasets obtained with different instruments used over the years. There has been a significant improvement of the precision of RV measurements over time, from ≈ 1 km/s in the 1980s down to ≈ 10 m/s for the most precise high-resolution spectrographs of today. The individual error determinations are rather uncertain before the 1990s and are most often not even provided but can only be estimated from the dispersion of the fit residuals. Moreover, formal errors are often underestimated, but are sometimes overestimated (see, e.g., Torres 2023). RV measurements and their uncertainties depend on multiple factors including errors in the adopted RV of standard stars, misalignment of stars within the spectrograph slit, and potential discrepancies in the velocity scale between Cepheids and standard stars (Barnes et al. 2005). The precision and accuracy of Fourier parameters are also strongly dependent on the choice of metallic lines, correlation template, and the computation method used (Borgniet et al. 2019).
In order to avoid case-by-case assumption on the adopted uncertainties, we proceeded with an unweighted least-square method, which is also a standard approach in the field. The analytical formulae for the errors of the Fourier parameters obtained with the least-square method were derived by Petersen (1986). In this approach, the errors of the Fourier amplitude ratios σ(Rk1) and of the phase differences σ(ϕk1) are obtained from propagation of the covariance matrix of the fitted Fourier parameters (see Eqs. (9)–(12) in Petersen 1986). The unweighted method was applied to derive Fourier parameters and their uncertainties in many comparable RV studies (Kovács et al. 1990; Kienzle et al. 1999; Moskalik et al. 2000; Baranowski et al. 2009; Storm et al. 2011) but also in the light-curve studies (see, e.g., Deb & Singh 2010). Given a linear regression model, the covariance matrix of the fitted parameters is derived from the independent variable X:
 (5)
(5)
The expression uses the empirical estimate of the RV measurement uncertainties, σ, given by Eq. (4). In order to validate our use of the unweighted fits, we compared the Fourier parameters and their errors, as derived with the unweighted and with the weighted fit. This comparison has been performed for several stars and the results are discussed in Appendix A. We show that the unweighted least-square fit is sufficient to derive precise and accurate Fourier parameters. In addition to this standard Fourier fitting method, we applied several specific corrections as described in the following subsections.
2.4 Zero-point correction
As discussed in Sect. 2.1, we used datasets compiled from many different sources from the literature. Thus, zero-point offsets between datasets of the same star might be present, because of the different instruments used, different choice of metallic lines, and different methods of extracting RVs from the spectra (see, e.g., Evans et al. 2015; Borgniet et al. 2019; Nardetto et al. 2023). In order to correct for these effects, we treated zero-point differences between datasets as free parameters and determined them iteratively from the least-square fit. This is equivalent to forcing all the datasets to have the same γ-velocity. We note that zero-point corrections have been applied by other authors as well (see, e.g., Herbig & Moore 1952; Lloyd Evans 1982; Kiss & Vinkó 2000; Pont et al. 2001; Anderson et al. 2015; Breitfelder et al. 2016; Torres 2023). Similar corrections have also been used when combining photometric data (see, e.g., Coulson & Caldwell 1985; Antonello et al. 1990). We note that applying zero-point correction removes the ability to detect the γ-velocity variations that might be caused by orbital motion. However, the systematic detection of binary Cepheids is out of the scope of this paper, and we only focus on removing the orbital-motion contribution as presented in the following section.
2.5 Orbital-motion correction
As a significant fraction of Cepheids are binary or multiple systems (Evans et al. 2015; Szabados 2003; Kervella et al. 2019), some of the RV curves can be strongly affected by orbital motion. The aim of this study is not to determine the Keplerian elements of the orbit, but simply to subtract the trend induced by the orbital motion. To this end, the orbital motion is modeled by an additional Fourier series, with the orbital period Porb. Thus, the fitting formula for a binary Cepheid consists of the two Fourier sums: one for pulsation variations (see Eq. (1)), and one additional sum for orbital motion. This procedure was used for example by Kovács et al. (1990). In this method, pulsation and orbital motion are fitted simultaneously. We add the orbital Fourier sum only when the binarity of the Cepheid is well established and the orbital period is short compared to our dataset. There are 25 stars that fit this description, which we list in Table C.1. Sometimes the data we use span too short a timebase to cover the orbit. In such cases, the orbital motion is modeled with a parabolic trend (e.g., δ Cep, T Mon; see Sect. 2.6) or is neglected in the fit (e.g., Polaris).
As mentioned above, a Fourier sine series cannot determine the Keplerian elements of the orbit, but is naturally suitable for accurately determining the orbital period. Although this method is convenient for algorithmic purposes, we note that we introduce additional degrees of freedom (DOFs) as compared to a Keple-rian model. However, it must be kept in mind that the number of data points is significantly larger than the number of DOFs for the Cepheids of our study, and therefore this additional cost is largely mitigated. For example, in the case of SU Cyg, our fit has 23 parameters instead of only 17 when the Keplerian orbit is used. With 331 data points available, this higher number of DOFs results in an increase in the fit dispersion by only 1.0%. Among all the stars with detected orbital motion (see Table C.1), this increase in the fit dispersion exceeds 2% for only two binaries, namely RX Cam (4.9%) and S Sge (2.2%). In exchange, we get a much simpler fitting formula (linear in Fourier parameters). The orbital period, Porb, is either taken from the literature or determined from the fit. If the orbital period is consistent with the period given in the literature (which is usually the case), we choose the one with the smallest formal error. We summarize the orbital periods adopted in Table C.1. In Table C.2, we compare our new orbital periods with periods published in the literature.
2.6 Trend correction
In some cases, after subtracting the pulsation variation from the RV curve, we observe a slow linear or parabolic trend in the residuals. Such a trend can be of instrumental origin or it could result from a slow orbital motion (see, e.g., Anderson et al. 2015). In order to model both linear and parabolic trends in the data, we used a single Fourier component with a constant long period of Ptrend = 50 000 days. Alternatively, the trend can also be modeled by a polynomial function, but we chose the Fourier model for practical algorithmic purposes. Hence, the Fourier sum is fitted for both pulsation variations and the trend simultaneously. For each star, we indicate if an additional trend is fitted (see Tables D.1, D.2, D.3, D.4, and D.5).
2.7 (O-C) correction for long-period Cepheids
The four Cepheids with the longest pulsation periods (P > 40 days), namely SV Vul, GY Sge, V1496 Aql, and S Vul, all display very fast, irregular O – C variations, or equivalently, period variations (Berdnikov et al. 2004, 2007; Turner et al. 2009). Phasing their RV data with constant period will not yield satisfactory results. Therefore, we proceeded differently: we corrected for the O – C variations by applying phase offsets (shifts) calculated for each season separately (see, e.g., Berdnikov et al. 2004; Anderson et al. 2015; Kervella et al. 2017). A commonly used method is to employ an O – C diagram determined from photometric observations in order to calculate the required phase shift for each epoch (see, e.g., Kervella et al. 2017). Instead of this approach, we measured the phase shifts directly from the RV data for each individual dataset, similarly to Anderson et al. (2015) in the case of δ Cep. To this end, we first divided the data into seasons and chose the best sampled season as a reference. The pulsation period P of the star was determined from this reference season, and was kept constant during the procedure. We then applied individual phase shifts to all the remaining seasons. These phase shifts were determined for all datasets simultaneously by the least square method, in which we minimized the dispersion of the overall Fourier fit. Our procedure of measuring the required O - C shifts is equivalent to a Hertzsprung method (Hertzsprung 1919). We note, that this approach is applicable only if each seasonal dataset covers both the ascending branch and the descending branch of the RV curve. We applied this method only to the four long-period Cepheids mentioned above and to a single short-period Cepheid V Cen, for which we had to combine data collected over many years (see individual fitting treatment in Sect. D.1).
Quality classification of the Cepheids sample.
2.8 Quality classification of the fits
It is difficult to define a consistent criterion that can be used to quantify the quality of the fit for every star. Indeed, the quality of the different fits depends on the number of measurements, the coverage of the pulsation cycle, the standard deviation of the fit, and the presence of instabilities. Thus, we rather visually inspected each Fourier fit and we classified them into two main categories (see Table 1). The Fourier parameters of the highest-quality RV curves labeled "1" are most accurate, as they result from fits free of any significant instabilities and with an excellent phase coverage. Here, "instability" refers to a small artificial undulation of the RV curve produced by an ill-defined fit; these have no physical meaning. In some cases, the fits display slight instabilities, and therefore we assigned to them the quality flag "1a". Fourier fits classified as quality "2" have useful Fourier parameters but they can be affected by stronger instabilities, scatter, or poorer coverage of the pulsation cycle. For each star of quality "2", we provided a flag that describes the type of deficiencies we identified (see Notes to Tables D.3 and D.4). We emphasize that this classification has to be considered only as an indication to guide the reader.
3 Results
3.1 New precise Fourier parameters
The plots of the entire collection of Cepheid RV curves are available as online material. We displayed selected velocity curves in Fig. 1, which nicely exhibits the bump progression in the fundamental-mode Cepheids. We also present the amplitude of the first Fourier term A1 (Fig. 2), the low-order Fourier parameters (Fig. 3), and the high-order Fourier parameters (Fig. 4). Fourier parameters for all the stars are provided in Tables D.1, D.2, D.3, D.4, and D.5. The different trends of Fourier parameters are qualitatively discussed in Sect. 4.
Our sample consists of 218 variables. This is the largest collection of Cepheids for which RV curve Fourier parameters have been determined. In Fig. 5 we present the precision of the Fourier fits and of the derived Fourier parameters. The median number of data points per star and the median dispersion of the fit, together with quartiles, are (see Figs. 5a and 5b)
 (6)
(6)
For the best-defined RV curves (quality flags 1 and 1a), we obtain
 (7)
(7)
Although for many Cepheids we obtained fits of excellent quality (see RV curve plots on Zenodo), the dispersion of the fit alone is a poor indicator of the precision of the Fourier parameters. Thus, we also display the derived uncertainties of low-order Fourier parameters (up to the third harmonics) in Figs. 5c, 5e, 5d, and 5f. For the Cepheids of our sample, we find a median uncertainty of
 (8)
(8)
 (9)
(9)
It is also possible to verify the obtained precision using the trends of the Fourier phases of low and high orders (Figs. 3 and 4). When plotted against pulsation period, the Fourier phases ϕn1 display remarkably tight progressions, which is in qualitative agreement with theoretical predictions (Buchler et al. 1990). More importantly, the dispersion of each Fourier phase progression is in excellent agreement with the derived uncertainties, which demonstrates that the latter are realistic. The relationships between the Fourier phases, which are discussed in Sect. 4.6, provide further evidence of the internal consistency regarding the obtained precision, and therefore of the robustness of our fitting method.
We compare the precision achieved in our work with the precision of the similar Fourier parameter surveys published in the literature. First, we cross-matched our results with those of Storm et al. (2011). We display histograms of their errors in Figs. 5c, 5e, 5d, and 5f. Comparing the median of each sample, we conclude that our median precision for the same set of stars is eight times better in the case of σ(ϕ21), six times better in the case of σ(ϕ31), 18% better in the case of σ(R21), and 22% better in the case of σ(R31). For the first-overtone Cepheids, we obtain a median uncertainty of
 (10)
(10)
as compared to the previous results of Kienzle et al. (1999) of
 (11)
(11)
which yield an improved precision by about 33% and 29%, respectively.
In conclusion, we have not only obtained the largest sample of available RV curve Fourier parameters (218 stars, determined using the same method), but have also significantly improved the precision of Fourier parameters. This improved precision is valuable for fine-tuning hydrodynamical pulsation models (see, e.g., Paxton et al. 2019; Kovács et al. 2023), a problem that will be addressed in forthcoming papers (in preparation) by our group. As an immediate by-product, we are able to identify several first-overtone Cepheids based on their velocity Fourier phase ϕ21 (Sect. 3.2) and to identify new binary Cepheids (Sect. 3.3).
3.2 Identification of first-overtone Cepheids
Many known overtone Cepheids in the literature have been identified with the help of the Fourier phases of their light curves (Antonello & Poretti 1986; Antonello et al. 1990; Mantegazza & Poretti 1992; Poretti 1994). Unfortunately, light-curve Fourier parameters cannot differentiate the pulsation modes at longer periods (P > 5.0–5.5 day) because ϕ21 and ϕ31 sequences of fundamental and first-overtone merge with each other (Antonello et al. 1990; Soszynski et al. 2008). We illustrate this behavior with the Gaia DR3 sample in Fig. 6a. We stress that the inability to identify the pulsation mode from the light curve in this period range is not a matter of the precision of the observation; it is rather related to the intrinsic physical properties of classical Cepheids.
Alternatively, other photometric surveys of Galactic Cepheids, such as OGLE (Soszynski et al. 2008, 2010) or Gaia, used a criterion based on the R21–P plane (Clementini et al. 2016), which distinguishes the first-overtone from the fundamental-mode pulsators. This criterion is robust for large samples of Cepheids, but can fail in individual cases. Indeed, we still encounter the same problem as in the case of ϕ21, namely that light-curve R21 sequences of the fundamental mode and the first-overtone merge for periods of P > 5.5 days (see Fig. 6b). Moreover, the light-curve R21 of the fundamental-mode Cepheids depends on the metallicity (Klagyivik & Szabados 2007; Szabados & Klagyivik 2012; Majaess et al. 2013; Hocdé et al. 2023) and on the location of the star within the instability strip (Sandage et al. 2004, 2009). In particular, fundamental-mode Cepheids located close to the edge of the instability strip might have low amplitudes and consequently low R21 in the range of those observed in the overtone pulsators. The fundamental-mode Cepheid Y Oph is a good example of this behavior (see the results of this paper and those of Hocdé et al. 2024).
In light of the difficulties discussed above, the mode identification based on ϕ21 of the RV curves is a more robust and preferable approach. As shown already by Kienzle et al. (1999), in the case of the overtone Cepheids, the progression of Fourier phases for RV curves is different than for the light curves and allows us to discriminate between the overtone and the fundamental-mode at all periods (except in a narrow range around P = 5 days, where the two progressions cross). In fact, for Cepheids with P > 5.5 days, analysis of the RV curves is the only unambiguous way to identify the pulsation mode. In the following, we provide a comparison of our mode identification with that from the Gaia survey.
3.2.1 Comparison with mode identification by the Gaia survey
As discussed above, with the mode identification method used by The Specific Objects Study (SOS) Cep&RRL pipeline from Gaia, some Cepheids might be misclassified. In the framework of specific processing and validation of all sky Cepheids from Gaia DR3, Ripepi et al. (2022, 2023) performed a reclassifi-cation of Gaia DR2 and DR3 pulsation modes obtained using the SOS Cep&RRL pipeline, after an in-depth analysis of light curves, the period–luminosity relation, and results from the literature. For Cepheids with a pulsation period of greater than 5 days, reclassification from Ripepi et al. (2023) changes fundamental into first-overtone mode in five stars as shown in Table 2. This table also allows comparison of our classification with that of the Gaia DR3 catalog and that of Ripepi et al. (2023).
We confirm the overtone nature of several Cepheids, classified photometrically as such with Gaia’s SOS Cep&RRL pipeline: VZ CMa, V351 Cep, DT Cyg, V532 Cyg, V411 Lac, and EV Sct. We identified five first-overtones Cepheids that in Gaia DR3 are classified as fundamental-mode pulsators: X Lac, MY Pup, GH Car, V495 Cyg, and V440 Per. Two of them, MY Pup and V440 Per, have already been classified as overtone pulsators before (Kienzle et al. 1999; Baranowski et al. 2009).
We display these stars in Fig. 7a and mark them with red labels. As expected, we only find disagreements for pulsation periods above 5.4 days. Four of these stars were later reclassified by Ripepi et al. (2023) as first-overtone variables in agreement with our results. In Fig. 7a, we also display several Cepheids the pulsation mode of which is uncertain or unknown according to our criteria, but can be identified according to Gaia DR3 (CK Cam, BD Cas, V1726 Cyg, CE Cas A, V924 Cyg). These variables are plotted as purple points. Finally, we also mark the Cepheid FF Aql in the figure, which is the only Cepheid of our sample with a period shorter than 5 days for which the results from Gaia DR3 SOS Cep&RRL pipeline and of Ripepi et al. (2023) disagree.
In Fig. 7b, we verify our mode identifications with the help of the astrometry-based luminosity (ABL) (Feast & Catchpole 1997; Arenou & Luri 1999), which is established from reddening-free Wesenheit magnitudes, WG, as defined by Ripepi et al. (2019), that is, WG = G − 1.90(GBp− GRp). The ABL versus period relations displayed in Fig. 7b for first-overtone and fundamental-mode variables are calibrated with a clean sample of Cepheids (RUWE < 1.41, δω/ω < 0.2) (Ripepi et al. 2023). The relations are plotted together with their dispersion adopted from Ripepi et al. (2023). We derived the observed ABL for our sample of stars listed in Table 2 using the apparent Wesenheit magnitudes and Gaia DR3 parallaxes corrected for zero-point offsets (Lindegren et al. 2021) and for the residual parallax offset (Riess et al. 2021). As we can see from Fig. 7b, all the stars that we have identified as long-period first-overtone Cepheids (red symbols) are in excellent agreement with the ABL versus period relation for the first overtone. Only for one star, GH Car, does the ABL plot yield an ambiguous conclusion; this is because the star falls between the ABL relations of the two modes, deviating from either of them by more than 3σ. Still, it is twice closer to the first overtone line. Among the stars with an uncertain or unknown pulsation mode according to our criteria, BD Cas, V1726 Cyg, and V924 Cyg agree with the first-overtone ABL relation, while CK Cam, CE Cas A, and GH Lup are in better agreement with the fundamental-mode relation.
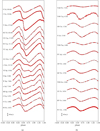 |
Fig. 1 Radial velocity curves and Fourier fits for a set of fundamental-mode (a) and first-overtone Cepheids (b). The scale is indicated in the bottom left corner of the plots. For better visualization of the bump progression, the curves are aligned in such a way that their maxima are placed at ϕ = 0.3. |
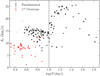 |
Fig. 2 First Fourier term, A1, for fundamental-mode and first-overtone Cepheids. Fundamental-mode variables of Quality 1 and 1a are plotted with black points, while gray points indicate variables of Quality 2. A vertical dashed line indicates a period of 10 days and is plotted to guide the eye in the resonance vicinity. |
Comparison of the mode identifications of our work and the Gaia survey.
3.2.2 Newly identified long-period overtone Cepheids based on RV curves
Below we comment on five individual stars: three newly identified long-period overtone Cepheids, as well as Polaris and FF Aql. Comments on the remaining overtone Cepheids and on Cepheids with uncertain or unknown mode identifications are provided in Appendices D.4 and D.5, respectively.
X Lac, V495 Cyg. The RV curves of X Lac and V495 Cyg have already been discussed by Kienzle et al. (1999), who suggested that these stars might be overtone pulsators. The Fourier amplitudes A1 for both variables are above 10 km/s and are rather typical of fundamental-mode Cepheids. On the other hand, the values of their RV Fourier phases ϕ21 are well below the fundamental-mode progression and are similar to those of long-period overtone Cepheids. Fourier phase ϕ31 can be measured only for V495 Cyg and it also deviates strongly from the fundamental-mode progression (see Fig. 3c). We conclude with certainty that both Cepheids are overtone pulsators based on ϕ21 and ϕ31.
FF Aql. Our first-overtone identification aligns well with the Gaia DR3 catalog, but Ripepi et al. (2023) reclassified this object as a fundamental-mode pulsator. The value of the velocity Fourier phase of this Cepheid, ϕ21 = 3.477 ± 0.012, places it firmly among overtone pulsators and far away from the fundamental-mode progression (see Fig. 7a). The light-curve Fourier phase ϕ21 is measured less accurately, but its value leads to the same mode identification (Antonello & Poretti 1986). On this basis, we can conclude with certainty that FF Aql is an overtone pulsator.
GH Car. This star was identified as an overtone Cepheid by Kienzle et al. (2000) from the RV curve, but its Fourier parameters were not published. Ripepi et al. (2023) reached the same conclusion with the Gaia photometry. We confirm the overtone nature of GH Car and for the first time provide the Fourier parameters of its RV curve.
α UMi (Polaris). The pulsation mode of Polaris has been vigorously debated in the last decade (see, e.g., van Leeuwen 2013; Turner et al. 2013; Neilson 2014; Anderson 2018a; Evans et al. 2018). This variable has the lowest pulsation amplitude of all Cepheids and consequently has almost sinusoidal light and RV curves. Using Fourier phases to establish its pulsation mode has so far been unsuccessful. The primary objective of the present study is to detect and characterize the first harmonic of the RV curve of Polaris, which is a notably low-amplitude component (below 0.1 km/s). This necessitates a large number of measurements in order to decrease the errors of the Fourier parameters. A challenging aspect lies in the fact that Polaris exhibits fast variations in both its amplitude and period (Neilson et al. 2012; Usenko et al. 2018; Anderson 2019; Usenko et al. 2020). For this reason, phasing together long datasets yields excessive scatter of the RV curve. To address this problem, we require a short dataset to ensure that neither amplitude nor phase undergo significant variability during the observations. At the same time, it is imperative that this short dataset consists of a large number of measurements. Regrettably, this criterion is not met when examining any of the subsets within the very precise dataset of Anderson (2019). However, the conditions are met by a subset of data from Eaton (2020). The subset is 83 days long, from HJD=2454713 to HJD=2454796, and consists of 167 data points. This dataset yields a Fourier fit with a dispersion of 0.09 km/s and allows us to determine the RV Fourier phase of ϕ21 = 3.736 ± 0.113 (see Fig. 7a). The measured value of ϕ21 is much more accurate, but within the error it is the same as that determined previously by Moskalik & Ogłoza (2000), despite an over 50% increase in the pulsation amplitude between the two epochs. The new value of ϕ21 fits the overtone progression very well and deviates strongly from the fundamental-mode progression. Thus, for the first time we are able to firmly demonstrate with the RV Fourier parameters that Polaris is an overtone Cepheid. Our mode identification agrees with the earlier result of Moskalik & Ogłoza (2000), who reached the same conclusion by measuring the phase lag between light and RV curves. We note that neither method depends on the distance to Polaris or interstellar reddening.
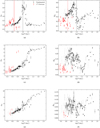 |
Fig. 3 Low-order Fourier parameters for RV curves of fundamental-mode and first-overtone Cepheids. For the fundamental mode, black points and gray points are variables of Quality (1+1a) and 2, respectively (see Table 1). Vertical dashed lined indicate a pulsation period of 4.68 and 10 days to guide the eye in the resonance vicinity of first-overtone and fundamental-mode Cepheids, respectively. |
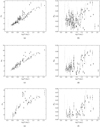 |
Fig. 4 Fourier parameters of fifth, sixth, and seventh terms for RV curves of the fundamental-mode Cepheids. Black points and gray points are variables of Quality (1+1a) and 2, respectively (see Table 1). |
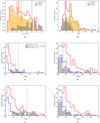 |
Fig. 5 Histograms of (a) the standard deviation of the fits σfit and (b) the number of data points Ndat for our Cepheid sample. Histogram of uncertainties of low-order Fourier parameters are displayed for (c) σ(ϕ21), (d) σ(R21), (e) σ(ϕ31), and (f) σ(R31) for Cepheids of this paper and, for comparison, for Cepheids from Storm et al. (2011). In each plot, the median of each sample is represented by a vertical dashed line. See Sect. 3. |
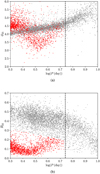 |
Fig. 6 Fourier phase ϕ21 and amplitude ratio R21 for the Gaia DR3 G-band light curves. Gray and red colors represent fundamental-mode Cepheids and first-overtone Cepheids, respectively, as classified with the SOS Cep&RRL pipeline, which is based primarily on the R21−P plane. The vertical line indicates P = 5.5 days, where R2ı and ϕ21 both merge for the two modes. |
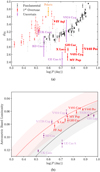 |
Fig. 7 (a) Velocity Fourier phases ϕ21 for first-overtone and short-period fundamental-mode Cepheids. Red labels correspond to overtone Cepheids for which our results disagree either with the Gaia SOS Cep&RRL pipeline or with reclassification by (Ripepi et al. 2023) (see Table 2). Purple symbols correspond to stars with uncertain or unknown pulsation mode according to our criteria based on ϕ21. V1726 Cyg and GH Lup cannot be plotted because the second Fourier term has not been detected in these stars, and V636 Cas has very high ϕ21 ≃ 4.5 rad. (b) Astrometry-based luminosities in the Wesenheit G-band for selected stars of Fig. 7a. Relations for the first-overtone and fundamental-mode Cepheids are also plotted as red and black curves, respectively. |
3.3 Detected spectroscopic Cepheid binaries
In five Cepheids of our sample, we find statistically very significant drift of the γ-velocity. Such γ-velocity variation might be caused by orbital motion in a long-period binary system. For two of these variables, BP Cir and LR TrA, the binary nature has already been recognized (Petterson et al. 2005; Szabados et al. 2013a). For QZ Nor, the γ-velocity drift has also been recognized before (Anderson 2014, 2020), but its nature is still a matter of debate. To our knowledge, the spectroscopic binarity of the other two Cepheids is identified here for the first time.
VY Per. We find a slow γ-velocity drift amounting to ≈ 7.0 km/s in 500 days. The observed change of γ-velocity indicates a binary orbital motion, with the period being much longer than the duration of the observations.
AQ Pup. Anderson et al. (2016a) noticed a small fluctuation of the γ-velocity in older archival data, but they attributed this to a problem related to the phase folding of the data because of fast and irregular period changes. They also reported no significant γ-velocity variations within their precise dataset. We reach a different conclusion after analyzing the single very precise dataset of Anderson et al. (2016a) in detail. Simultaneously fitting the pulsation RV curve and a trend, we find a slow, approximately parabolic γ-velocity drift, amounting to ≃2.0 km/s in 800 days. Considering the excellent quality of the data, this drift is highly significant. To refine the analysis, we divided the measurements into four separate subsets and determined the γ-velocity for each subset independently. This method of analysis is not sensitive to possible variations of the pulsation period, which might affect the phasing of the RV curve. We find that the γ-velocity of AQ Pup has changed between HJD=2456652 and HJD=2457459 by ∆Vγ = 1.81 ± 0.045 km/s. The observed change of γ-velocity indicates a binary orbital motion, with the period being much longer than the duration of the observations.
QZ Nor. We analyzed this star with a single, very accurate dataset of Anderson (2014). Fitting the pulsation RV curve and a trend simultaneously, we find a slow, linear γ-velocity drift amounting to ≃ 0.5 km/s in 1000 days. Considering the excellent quality of the data, this drift is highly significant. Proceeding in the same way as in the case of AQ Pup, we divided the measurements into four separate subsets and determined the γ-velocity for each of them independently. We find that the γ-velocity of QZ Nor has changed between HJD=2455708 and HJD=2456689 by ∆Vγ = 0.49 ± 0.01 km/s. The observed change of the γ-velocity suggests a binary orbital motion, with the period being much longer than the duration of the observations. However, in the case of QZ Nor, other explanations are also possible. In this star, the drift of the γ-velocity is accompanied by a slow increase in the pulsation amplitude (by ∆A1 = 0.54 ± 0.01 km/s or by 7%). This finding suggests that QZ Nor might undergo a long-term modulation (a Blazhko effect), in which both the velocity amplitude and the mean are periodically variable. Modulations of this type are rare, but do occur in Cepheids. Indeed, modulations with exactly these characteristics have been detected photometrically in 51 fundamental-mode Cepheids of the Magellanic Clouds (Smolec 2017). Interpretation of the amplitude variability in QZ Nor in terms of the Blazhko effect was first suggested by Anderson (2014). Yet another possible explanation was put forward by Anderson (2020), who proposed that the observed changes of the γ-velocity and of the velocity amplitude could be attributed to secular changes of the spectral line asymmetry. Such changes can introduce a time-dependent bias when radial velocities are measured by fitting a Gaussian to the cross-correlation profile. Further observations are needed to distinguish between the competing explanations for the behavior of this object.
4 Discussion: Fourier parameter trends
4.1 Amplitude of the first Fourier term
In the case of the fundamental-mode Cepheids with short periods (P < 10 days) in Fig. 2, we observe a very sharply defined upper envelope limit of the pulsation amplitude. This limit empirically defines a maximum A1 of Galactic Cepheids to be between 19.5 and 15 km/s, depending on the pulsation period. Conversely, the amplitudes of Cepheids are distributed below this upper limit. Observations show that the light curve amplitudes of short-period fundamental-mode Cepheids are highest on the blue edge of the instability strip and decrease towards the red edge (Sandage et al. 2004, 2009; Hocdé et al. 2023). It has been suggested in the literature that the RV amplitude might be correlated with the location within the instability strip as well (Cogan 1980; Pont et al. 2001).
The light-curve amplitude is also sensitive to the metallicity (Klagyivik & Szabados 2007; Szabados & Klagyivik 2012; Majaess et al. 2013; Hocdé et al. 2023). In order to test if the RV amplitudes of Cepheids with P < 10 days depend on metallic-ity, we cross-matched our data with metallicity determined with the HR spectroscopy (Luck 2018). We find no significant correlation between the velocity amplitude A1 and the spectroscopic metallicity of the Cepheid. This is different from the results of Szabados & Klagyivik (2012), who found that the RV amplitude decreases with [Fe/H]. Extending the Cepheid sample to metal-poor objects of the Magellanic Clouds seems necessary to clarify this issue.
For the fundamental-mode Cepheids with P > 10 days in Fig. 2, we observe a sharp rise in the pulsation amplitude A1 between 10 and 15 days. The upper limit envelope of A1 reaches a broad maximum of about 25 km/s for periods of 15–21 days. For example, SV Mon (P = 15.23 day) and RZ Vel (P = 20.40 day) have amplitudes of A1 = 24.87 ± 0.18 km/s and A1 = 24.64 ± 0.03 km/s, respectively. However, some stars show much lower amplitudes; for example, V340 Nor, SZ Cas, and Y Oph all pulsate with A1 < 10km/s. There is only a small number of Cepheids with a pulsation period of longer than 21 days. Their amplitude generally declines with increasing period, but with a few noticeable exceptions (e.g. AQ Pup and X Pup).
Finally, in Fig. 2 we also see an upper limit envelope of the pulsation amplitude for the overtone Cepheids with P < 5 days. This limit is not as sharply defined as for the fundamental mode. Nevertheless, it clearly defines a maximum amplitude A1 for overtone Cepheids of between 9.5km/s and 9.0km/s, depending on the pulsation period.
4.2 Amplitude ratios R21, R31, and R41
For the fundamental-mode Cepheids, the amplitude ratio of the second-to-the-first Fourier components, R21, displays an almost symmetric Z-shape progression with the pulsation period, centred on R21 = 0.3 and P = 10 days (see Fig. 3b). The maximum of R21 , which corresponds to the most asymmetrical RV curves, is located at P ≈ 8 days. In our sample, the maximum value is reached by W Gem with R21 = 0.61 ± 0.01 at P = 7.91 days. Given the smooth variation of A1 for P < 10 days, we can show that this sharp rise in R21 is caused by the amplitude of the second Fourier component A2. Interestingly, R21 of the light curves shows a somewhat different trend, with more asymmetrical curves (highest R21) at P ≈ 2.5 days followed by a decrease in light-curve asymmetry until P ≈ 10 days (see, e.g., Soszynski et al. 2008, 2010; Pietrukowicz et al. 2021). Thus, the amplitude A2 of the light curves starts to decrease already at P ≃ 2.5 days, while for the RV curves it continues to increase up to P ≃ 8 days. Moreover, R21 of the V-band light curve is known to have a minimum value at about P ≃ 10 days, which is close to the resonance period, while in the case of the RV curves the minimum R21 occurs at a longer period of ~12.5 days. For example, we find R21 = 0.029 ± 0.002 for XY Car (P=12.44days). Although a quantitative comparison is needed, these differences between light and RV curves seem to be reproduced by hydrodynamical models (Moskalik et al. 1992; Paxton et al. 2019).
The plots of R31 and R41 appear more scattered and both parameters have larger relative uncertainties than R21 . This is expected, because the third and fourth Fourier components have lower amplitudes and are thus less accurately determined from the data. Nevertheless, our amplitude ratios are precise enough to observe a first maximum of R31 at a period of close to 6 days. Among quality 1 Cepheids in our sample, the highest values are reached by AW Per (R31 = 0.25 ± 0.01) and XX Sgr (R31 = 0.24 ± 0.01) at P ≈ 6.5 days. For P > 6.5 days, a sudden decline in R31 is observed; however, it is difficult to precisely locate the minimum, because of a deficiency in our sample of Cepheids with periods of between 8 and 10 days. This deficiency could be due to the so-called zone of avoidance (van Genderen 1970; Buchler et al. 1997; Szabados & Klagyivik 2012; Udalski et al. 2018). Moskalik et al. (1992) postulated that the dip in R31 at around 8 days could be associated with the P4/P0 = 1/3 resonance between the fundamental and fourth overtone (Moskalik & Buchler 1989). R31 has its second maximum at around P = 10 days; it then declines again, reaching a minimum around 17 days, at a period slightly longer than in the case of R21. Beyond 17 days, R31 increases again and, similarly to R21, reaches its next maximum at around P ≃ 40 days. In the case of R41, the dispersion of the data is too large to describe the behaviour of the fourth Fourier term.
4.3 Fourier phase ϕ21
Low-order Fourier parameters of fundamental-mode Cepheids presented in Fig. 3 display a characteristic variation shaped by the P2/P0 = 0.5 resonance around 10 days. At short periods of below about 8 days, we are able to confirm the tight progression of Fourier phases with the pulsation period as observed by Moskalik et al. (2000), although this time we have done it using Fourier parameters measured with much higher precision. This tight progression was also predicted by hydrodynamical models (Buchler et al. 1990). These latter authors show that the dispersion of ϕ21 can be used to derive the width of the instability strip. On the other hand, we observe a large scatter of ϕ21 for periods of between 9 and 13 days. This can be explained by the strong sensitivity of ϕ21 to the value of the resonant period ratio P2/P0, which at a given period depends on the fundamental parameters of the star (mainly metallicity, but also on mass, luminosity, and temperature). This sensitivity of ϕ21 to stellar parameters is strongest within the resonance region, as predicted by hydro-dynamical calculations (see, e.g., Buchler et al. 1990; Moskalik et al. 1992; Buchler et al. 1997). By comparing the light curves of Cepheids in the Milky Way with those in metal-poor galaxies, it appears that with decreasing metallicity the resonance center shifts toward longer periods (Beaulieu 1998; Bhardwaj et al. 2015). Clearly, the period ratio P2/P0 is sensitive to metallicity. This implies that any dispersion of [Fe/H] within the Cepheid sample will induce a dispersion of P2/P0 at any given pulsation period (Buchler et al. 1990). We note that for our Cepheids with periods of 9–13 days, the spectroscopic metallicities of Luck (2018) range from [Fe/H]=−0.2 to +0.3 dex. This range of metal-licities could be large enough to explain, at least in part, the large scatter in ϕ21 observed in the resonance region.
At longer periods, from about P = 15 days to P = 70 days, the RV ϕ21 has an almost constant value. This is in contrast to the light curves, for which ϕ21 appears more scattered in this period range, even for a small sample of Galactic Cepheids (Pont et al. 2001; Simon & Moffett 1985; Hocdé et al. 2023). This scatter is attributed to differences in metallicity between the stars (Hocdé et al. 2023). As the velocity ϕ21 in long-period Cepheids is almost constant, the observed metallicity effect on the light curve ϕ21 is likely of photospheric origin. Additional RV curves for long-period Cepheids are necessary to analyze this issue in more detail.
4.4 Fourier phases ϕ31 and ϕ41
The Fourier phase ϕ31 undergoes a rather smooth, monotonic increase across the entire range of pulsation periods. Contrary to ϕ21, it does not display a sharp variation in the vicinity of the P2/P0 = 0.5 resonance, but only a somewhat increased scatter in the progression. The relationships between the Fourier phases presented in Sect. 4.6 show a linear correlation between ϕ21 and ϕ31 in the resonance region. The phase ϕ31 increases moderately quickly with the pulsation period up to P ≈ 15 days; it then undergoes a very steep increase (possibly a jump) by 2 rad at P = 15–20 days. At even longer periods, we observe a very slow increase in ϕ31 from about 5 to 6 rad. Thus, in the long-period Cepheids, both lowest order Fourier phases display a slow variation with the pulsation period.
The behavior of ϕ41 is somewhat different. This Fourier phase continues its steep, almost linear increase up to the longest period of 70 days. Contrary to ϕ31, it increases with nearly constant rate also at periods of between 15 and 70 days. Despite the large scatter in the amplitude ratio R41 versus period diagram, the Fourier phase ϕ41 shows a very tight progression with the pulsation period. We also confirm that there is no break in ϕ41 around 7 days, contrary to what is observed for the light curves (Simon & Moffett 1985). The difference between ϕ41 of the RV curves and ϕ41 of the light curves was first noted by Kovács et al. (1990) who attributed it to unknown photospheric phenomena.
4.5 High-order Fourier parameters
The possibility that higher-order light curve Fourier parameters might be affected by resonances, specifically P0/P1 = 3/2 at 24 days and P0/P3 = 3 at 27 days, was first suggested by Antonello & Morelli (1996) and Antonello et al. (2009). Theoretical high-order Fourier parameters were also computed with a hydrodynamical model (Aikawa & Antonello 2000) to investigate these effects. In Fig. 4, we display the high-order Fourier parameters (fifth, sixth, and seventh order) for the RV curves of all the Cepheids of our sample. Fourier phases ϕ51 and ϕ61 display a linear trend over the entire range of pulsation periods, similarly to ϕ41. Upon close inspection, we note that additional structures seem to be present in the plots. Regarding ϕ51, we observe an excessive scatter at periods of close to 10 days, that is, in the vicinity of the P2/P0 = 0.5 resonance centre. In this period range, several Cepheids deviate significantly upwards from the general ϕ51 progression. On the other hand, the progression of ϕ61 versus pulsation period seems to split into two parallel sequences that coexist for periods between 10 and 20 days. We must note, however, that this observation is based on a rather limited number of long-period Cepheids. The existence of the two ϕ61 sequences has to be confirmed when more RV curves become available.
The amplitude ratios R51 and R61 appear to be more scattered, and therefore it is difficult to distinguish any trends (see Figs. 4b and 4d). However, a weak minimum centred on the resonance period at P ~ 10 days is visible, especially in the case of R61 (see in Fig. 4d). From these data, we are not able to identify any resonance features suggested by Antonello & Morelli (1996) and Antonello et al. (2009). Interestingly, the amplitude ratios of low and high order reach a secondary maximum at long periods, before a sharp decrease that follows when periods become even longer. For R21, R31, and R41, the maximum occurs at about P = 42 days, and for R51 and R61 the maximum is reached at about P = 34 days. As we can see from the Hertzsprung progression displayed in Fig. 1a, the latter value is not far from the period at which a secondary bump reaches the top of the RV curve (see T Mon).
4.6 Relationships between Fourier parameters
We inspected the relationships between the Fourier parameters, and between the Fourier phases in particular, similarly to Kovács et al. (1990) and Simon & Moffett (1985) in the case of RV curves and light curves, respectively. The latter authors found a discontinuity between the short-period (P < 10 days) and long-period Cepheids, speculating that it might be caused by a different attractor or saturation mechanism, as originally proposed by Klapp et al. (1985). From Fig. 8 we see however that there is no apparent break in any phase–phase diagram. In particular, we observe a continuous variation of ϕ41 versus ϕ31, which is not the case for the light curves (see Fig. 17 in Simon & Mof-fett 1985), and is in agreement with our comments in Sect. 4.4. Moreover, ϕ31 and ϕ41 seem to be tightly correlated outside the resonance region. As expected, the relationships displayed in Fig. 8 are less scattered than those presented by Kovács et al. (1990, see their Fig. 5). We note, for the first time, a qualitative agreement between the shape of the ϕ21 versus ϕ31 relation determined observationally and that computed with the hydro-dynamical pulsation models of Buchler et al. (1990) presented in Kovács et al. (1990). Therefore, it is now possible to use the Fourier parameters of RV curves to constrain hydrodynamical pulsation models.
For Cepheids in the resonance region between 9 and 12.4 days, we observe a linear relation between ϕ21 and ϕ31 (blue dots in Fig. 8). This suggests that, in this period range, the variations of these two Fourier phases are likely sensitive to the same stellar parameters. However, when ϕ41 is plotted versus ϕ21 or versus ϕ31 for the same stars, we see no trend but rather an unstructured cloud of points (Figs. 8c and 8d). This suggests that the variation of ϕ41 in the resonance vicinity is influenced by different parameters compared to those affecting the variation of ϕ21 or ϕ31.
Finally, the variation of R21 with ϕ21 (Fig. 8b) displays an interesting loop, where the variation of ϕ21 lags behind that of R21 . In particular, Cepheids in the resonance region between 9 and 12.4 days are characterized by a decrease in R21, while ϕ21 continues to increase. In this period range, the relation between the two seems to be linear, though with a large dispersion.
5 Conclusions
In this paper, we take advantage of the observational efforts of the last few decades to precisely determine the Fourier parameters of Cepheid velocity curves. These parameters are extremely valuable for constraining the dynamics of hydrodynamical pulsation models and for studying the resonances between modes. The collected RV curves will also be very useful for distance determination using the parallax-of-pulsation method. In this work, we present a careful analysis of each Cepheid independently. First of all, we selected for each star the highest-quality RV measurements available in the literature. As the datasets are often obtained with different instruments, we corrected for zero-point offsets between different data sources. We removed the contribution from orbital motion and residual trends. For the four variables with the longest periods, we also corrected for the rapid and irregular period change. We then used these data to perform a Fourier fit of the RV curve of each Cepheid. The resulting Fourier fits were classified into two categories depending on their quality, taking into account the stability of the fit, the phase coverage, and the dispersion of fit residuals.
Our final sample consists of 178 fundamental and 33 first-overtone Cepheids with new precise RV Fourier parameters. We also report 7 additional Cepheids whose pulsation mode is uncertain or undetermined. We display Fourier parameters up to order seven; we analysed them qualitatively and compared some characteristic features to the literature. In two Cepheids, namely VY Per and AQ Pup, we find previously unreported, significant γ-velocity variations indicative of a binary (or multiplicity) motion with a long orbital period. Similar γ-velocity drift, but this time accompanied by a slow amplitude change, is also present in QZ Nor. In this last object, the γ-velocity drift might indicate binarity as well, or alternatively, it might result from a Blazhko-type modulation, affecting both velocity mean and velocity amplitude, or from the long-term variability of the line asymmetries (Anderson 2020). Finally, we also confirm previously reported γ-velocity variations in LR TrA and BP Cir.
We identify V495 Cyg as a new first-overtone Cepheid and we confirm the first-overtone nature of several others, including Polaris. Obtaining further RV measurements for Cepheids located near the resonance center, and for metal-poor Cepheids of the Magellanic Clouds or the outskirts of the Galaxy, will be essential in order to fully investigate the internal physics and pulsation dynamics of these variables. The pulsation period coverage and the precision obtained, in particular for Fourier phase ϕ21, will be useful for studying the dynamics of Cepheid pulsations with the help of hydrodynamical models. Further RV measurements from modern high-resolution spectroscopic instruments will be of high value for improving these results.
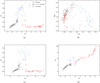 |
Fig. 8 Relationships between low-order Fourier phases, and between Fourier phase ϕ21 and amplitude ratio R21. The meaning of the different symbols is indicated in figure (a). |
Data availability
Full Tables D.1, D.2, D.3, D.4 and D.5 are available at the CDS via anonymous ftp to cdsarc.cds.unistra.fr (130.79.128.5) or via https://cdsarc.cds.unistra.fr/viz-bin/cat/J/A+A/689/A224 Fitted RV curves are available at https://zenodo.org/records/13593566
Acknowledgements
We are grateful to astronomers who dedicated years of work to the measurement of RV of Cepheids used in this paper. We thank Louis Balona, Jurek Krzesiński, Simon O’Toole and Frédéric Pont for making available to us their unpublished RV data. Natalia Gorynya thanks the Simeiz Observatory for generously granting the observing time on 1m telescope during 33 years of her Cepheid RV program. VH, RS, OZ and RSR are supported by the National Science Center, Poland, Sonata BIS project 2018/30/E/ST9/00598. This research made use of the SIMBAD and VIZIER databases at CDS, Strasbourg (France) and the electronic bibliography maintained by the NASA/ADS system. This research also made use of Astropy, a community-developed core Python package for Astronomy (Astropy Collaboration 2018, 2022).
Appendix A Weighted versus Unweighted fit
One significant limitation of employing a weighted fit to derive uncertainties of the Fourier parameter is that theory behind this method assumes that the weights are known precisely. This is rarely the case for RV measurements. It complicates the application of weighted fits to RV studies, as it necessitates a prior evaluation of the quality of RV uncertainties. In most RV studies, the uncertainties reported are only the formal errors, which usually differ from the true uncertainties (Torres 2023). In some cases, the formal errors are smaller while in others can be larger than the real uncertainties. Unknown small perturbations of the photosphere might be detected with high precision measurements. These perturbations are a source of additional noise added to the pulsational signal that we seek to model with the Fourier series. In such a case, formal errors underestimate the true uncertainties and the weighted fit yields a reduced χ2 higher than 1. Uncertainties of the Fourier parameters derived from such a weighted fit will be artificially too precise.
In order to properly re-scale the formal errors we followed the method described by Torres (2023) who added quadratically a constant jitter to uncertainties of each dataset. This additional jitter is chosen in such a way as to obtain a reduced χ2 of 1. To compare the results of weighted and unweighted fits for a representative group of variables we choose Cepheids, having between 50 and 150 data points. We limited our selection to fundamental mode Cepheids, with no trends and no orbital motion. This choice is made to simplify the analysis. Finally, we choose only Cepheids with pulsation periods below 30 days, in order to avoid objects with fast period variability. For most of the selected Cepheids the fits are based on either two or three datasets combined together. This allows to check how combining datasets of differing accuracy affects the results.
In Fig. A.1 we present the comparison of the Fourier parameters derived with unweighted and with weighted fits, for a representative sample of ten Cepheids. We conclude that, once formal errors are properly re-scaled, we do not find significant differences between parameters resulting from the unweighted and from the weighted fits. It is important to note that the fitting method we use here is based on the assumption that our model correctly represents the observed signals.
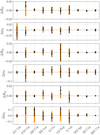 |
Fig. A.1 Differences of the Fourier parameter derived with weighted and with unweighted fits (black and orange, respectively). The error bars represent the uncertainties of the parameters themselves. |
Appendix B Table of references
Appendix C Binary Cepheids
Orbital periods of binary Cepheids adopted for the Fourier fit.
C.1 Comments on binary Cepheids
V1344 Aql: the recent study of Cseh et al. (2023) derived for this star orbital period of about Porb ≃ 12000 days, which is about twice longer than the period derived by Gorynya et al. (in prep). We scrutinized both datasets to understand the origin of this discrepancy. The dataset of Gorynya et al. spans more than 23 years, with nearly 200 measurements uniformly distributed in time. This dataset yields unambiguously the orbital period close to 6300 days and is not compatible with the period of ~ 12000 days. Thus, the orbital period found by Cseh et al. (2023) can be excluded.
XX Cen: Szabados (1990) determined orbital period of this binary Cepheid to be Porb = 909.4 days . Later, Groenewegen (2008) has refined this value to Porb = 924.1 days. Using only the most recent high quality RV data and assuming circular orbit (as done by Groenewegen 2008), we find somewhat shorter period of Porb = 711.7 days. The resulting fit has a dispersion of only 0.34 km/s, which is more than 4 times lower than for the fit in which Porb from Groenewegen (2008) is assumed.
DX Gem: this overtone Cepheid is a spectroscopic binary (Bersier 2002). The total range of orbital velocity variations is ~ 20 km/s, but the currently available data are not sufficient to uniquely determine the orbital period. Among several possibilities, we have chosen Porb = 1043.1 days, which yields the lowest dispersion of the fit. The Fourier parameters of the pulsation RV curve are almost insensitive to the choice of Porb.
SY Nor: this is another spectroscopic binary (Bersier 2002). The total range of orbital velocity variations is ~ 30 km/s. To the best of our knowledge, the full orbital solution was never published, but the unique determination of orbital period is already possible. Our value of Porb = 551.86 days is almost the same as 551.7 days s, the value found by Bersier (2002).
BP Cir: the presence of hot companion of BP Cir was detected for the first time by International Ultraviolet Explorer satellite (Arellano Ferro & Madore 1985; Evans et al. 1992) and later revealed by long-baseline interferometric observations (Gallenne et al. 2019). From data of Petterson et al. (2004) alone, we have found a slow γ-velocity drift, amounting to ≈7.0 km/s in 2300 days. Variability of γ-velocity of BP Cir has already been noticed by Petterson et al., who wrote that “observations indicate continuing decrease in γ-velocity”. The observed drift indicates a binary orbital motion, with the period much longer than the duration of the observations.
LR TrA: a slow γ-velocity drift has been noticed in this Cepheid already by Szabados et al. (2013a). We have confirmed this finding, we have found a γ-velocity change of 1.5 km/s in 450 days. Considering an excellent quality of analyzed data, a drift of this size is highly significant. The observed change of γ-velocity indicates a binary orbital motion, with the period much longer than the duration of the observations.
New orbital periods of binary Cepheids adopted in this paper compared with the previously published values.
Appendix D Fourier parameters
D.1 Comments on individual Cepheids of Tables D.1-D.3
KL Aql, V733 Aql: in older literature these two variables are considered to be Pop. II Cepheids (see, e.g., Balog et al. 1997; Vinkó et al. 1998). Recently, they have been both reclassified as Classical Cepheids, i.e. Cepheids of Pop. I (Groenewegen & Jurkovic 2017). Our analysis of the RV curves confirms this new classification. All Fourier parameters of KL Aql and V733 Aql firmly place these two variables among fundamental-mode Classical Cepheids.
TT Aql: individual zero-point corrections are applied separately to each season of Gorynya in prep. measurements. These offsets change from year to year in a systematic way, suggesting a binary motion with a very small peak-to-peak amplitude of ΔVr ~ 1.0 km/s.
SV Vul, GY Sge, V1496 Aql, S Vul: these four long-period Cepheids all display very fast, irregular O – C variations. To phase their velocity curves properly, we have taken into account the O – C shifts, calculated for each season separately. This procedure is described in detail in Sect. 2.7.
V Cen: New data of Bersier (2002) and Krzesiński (private comm.) do not provide a good coverage of the RV maximum. Therefore, we have included into the fit also older data of Gieren (1981). Because of a very long timebase (6614 d), phasing of all these data with a common period does not work too well and yields RV curve with excessive scatter. In order to improve the phasing, we have applied individual O – C shifts to each season separately. This reduces the scatter of the RV curve by ~10% and improves overall stability of the fit.
ℓ Car: because of amplitude instability, only data collected after HJD=2457000 are used in the analysis. The lack of amplitude stability might be linked to cycle-to-cycle spectral line and atmospheric velocity gradient variability observed in this star (Anderson et al. 2016b; Anderson 2016).
YZ Car: because of lower quality, older data of Petterson et al. (2004) collected before HJD=2450500 are not used in the analysis.
SV Per: because of lower quality, older data of Gieren & Brieva (1992) collected before HJD=2445000 are not used in the analysis.
RS Pup: because of period instability, only data collected after HJD=2456200 are used in the analysis.
DR Vel: first harmonic of the RV curve has not been detected in this Cepheid, perhaps because of low quality of available data. The second harmonic has been marginally detected. The measured value of ϕ31 is consistent with fundamental-mode pulsations. Therefore, we classify DR Vel as a fundamental-mode Cepheid.
Low-order Fourier parameters of fundamental-mode Cepheids, stars of Quality 1.
D.2 Low-order Fourier parameters of fundamental-mode Cepheids, stars of Quality 1a
Low-order Fourier parameters of fundamental-mode Cepheids, stars of Quality 1a.
D.3 Low-order Fourier parameters of fundamental-mode Cepheids, stars of Quality 2
Low-order Fourier parameters of fundamental-mode Cepheids, stars of Quality 2.
D.4 Comments on individual overtone Cepheids
Low-order Fourier parameters of first-overtone Cepheids.
VZ CMa, EV Sct: the overtone nature of these two Cepheids has been suspected for a long time (Antonello et al. 1990). However, with periods close to 3.1 days, their light curve Fourier phases ϕ21 fall on the intersection of the overtone and the fundamental-mode progressions. Consequently, their mode of pulsation cannot be established on the basis of their light curves. On the other hand, at this period range the pulsation mode can easily be identified with the RV ϕ21. In this paper, we show that both VZ CMa and EV Sct pulsate in the first-overtone mode. Our results confirm mode identifications of the Gaia DR3 catalog.
V532 Cyg: another Cepheid (P = 3.3 days ) for which the pulsation mode cannot be established with its light curve. The star has been identified as an overtone pulsator with the RV curve by Kienzle et al. (1999), who referred to unpublished results of Krzyt, Moskalik, Gorynya et al. (1999). We confirm overtone nature of V532 Cyg and provide its RV Fourier parameters for the first time. Our result confirms mode identification of the Gaia DR3 catalog.
V351 Cep: this is another Cepheid identified as an overtone pulsator by Kienzle et al. (1999), who referred to unpublished results of Krzyt, Moskalik, Gorynya et al. (1999). We confirm overtone nature of V351 Cep and provide its RV Fourier parameters for the first time. This result confirms the mode identification of the Gaia DR3 catalog.
V411 Lac: on the basis of RV Fourier phase ϕ21, we classify this Cepheid as an overtone pulsator. This result confirms the mode identification of the Gaia DR3 catalog.
DT Cyg: mode identification with the light curve is not possible for this Cepheid, because its V-band light curve is perfectly sinusoidal, with no detectable harmonic Poretti (1994). On the basis of RV Fourier phase ϕ21, we classify DT Cyg as an overtone pulsator.
V335 Pup: because of varying pulsation amplitude, only data collected after HJD=2456300 are used in the analysis.
D.5 Comments on individual Cepheids of Table D.5
CK Cam: Gaia DR3 catalog classifies this star as a fundamental-mode Cepheid. This is also supported by the derived value of ABL (see Fig. 7b). The RV Fourier amplitude A1 and amplitude ratios R21 and R31 for this Cepheid are indeed typical for a fundamental-mode pulsator. On the other hand, Fourier phase ϕ21 fits the overtone progression, although the deviation from the fundamental-mode progression is not large (less than 2σ). In light of these conflicting evidence we conclude that the pulsation mode of CK Cam cannot be firmly identified with the available RV data.
V1726 Cyg: Gaia DR3 catalog classifies this star as an overtone Cepheid, which is also supported by the derived value of ABL (see Fig. 7b). The RV curve of V1726 Cyg is perfectly sinusoidal, with no detectable harmonic. This is also the case for the light-curve of this star Poretti (1994). Thus, pulsation mode of V1726 Cyg cannot be established with the shape of its RV curve or the light curve.
V636 Cas: this low-amplitude variable is usually considered to be a Population I Cepheid. Gaia DR3 catalog classifies this star as a fundamental-mode pulsator. The derived value of ABL agrees with this classification (see Fig. 7b). However, our analysis of its RV curve does not support such a classification. The value of RV Fourier phase ϕ21 is very high above both the progression of fundamental-mode Cepheids and the progression of overtone Cepheids. Thus, it does not fit any mode of Cepheid pulsation. The phased RV curve of V636 Cas is distinctly non-sinusoidal, yet it is very symmetric, with descending branch lasting 0.46P. The curve does not resemble any RV curve of Cepheids of our sample. In our opinion, V636 Cas is not a Pop. I Cepheid. Interestingly, Kovtyukh et al. (1996) found that V636 Cas has a somewhat unusual chemical composition, with carbon and sodium overabundance. Understanding its true nature requires an in-depth analysis of all available data, which is beyond the scope of this paper.
V924 Cyg: This star is classified in Gaia DR3 catalog as fundamental-mode pulsator, but reclassified by Ripepi et al. (2023) as overtone pulsator. The derived value of ABL agrees with the latter classification (see Fig. 7b). The overtone nature of this Cepheids has been suspected in the past (Antonello et al. 1990). V924 Cyg is located in the light-curve Fourier plots at the period where the first overtone and the fundamental-mode progressions merge. Consequently, its pulsation mode cannot be identified with the light-curve Fourier phases. Our analysis of the RV curve yields Fourier phase ϕ21, which fits very well to the fundamental-mode progression. Unfortunately, the error is large (0.29 rad) and the measured ϕ21 deviates from the overtone progression by only 1.7σ. Therefore, a firm mode identification of V924 Cyg is not possible.
BD Cas: Gaia DR3 catalog classifies this star as an overtone Cepheid, which is also supported by the derived value of ABL (see Fig. 7b). The star was classified as a first-overtone pulsator by Poretti (1994). Its mode identification was based on the light-curve Fourier parameters, in particular on ϕ21. However, Poretti’s classification cannot be regarded as definitive, because the photometric data was scarce (only 16 points), the light-curve harmonic was essentially insignificant (A2 = 0.016 ± 0.014) and the resulting error of ϕ21 was very large (0.72 rad). The light-curve ϕ21 was consistent within this error with either mode of pulsation. Our analysis of the RV curve yields somewhat better results. The Fourier parameters A1 and R21 are both low and consistent with BD Cas being an overtone pulsator. Nevertheless, we have to keep in mind that low values of A1 and R21 do not prove an overtone nature of a Cepheid; fundamental-mode Cepheids can have low amplitudes, too (e.g. V1344 Aql). The value of RV Fourier phase ϕ21 deviates from the overtone progression by 2.7σ and agrees within 1σ with the fundamental-mode progression. 2.7σ deviation is somewhat too low for a firm mode identification, but the data indicate that BD Cas might be a fundamental-mode Cepheid, rather than an overtone Cepheid. This conclusion needs to be confirmed with better RV and photometric data. At this point we consider mode identification of BD Cas as uncertain.
CE Cas A: According to Gaia DR3 catalogue, this star is as a fundamental-mode pulsator. Its ABL value is also consistent with the fundamental-mode (see Fig. 7b) which is also shown from Reyes & Anderson (2023). The parallax of this Cepheid is also robust as it is a member of an open cluster (Reyes & Anderson 2023). For this Cepheid the RV Fourier amplitude A1 and amplitude ratio R21 are high and rather typical for a fundamental-mode pulsator. On the other hand, the value of its Fourier phase ϕ21 is low. It is 3.5σ below the fundamental-mode progression and is similar to values found for long-period overtone Cepheids. Our analysis is only tentative, because it is based on RV curve of low quality. Therefore it needs to be repeated with better data. Because of the conflicting evidence we consider the mode identification of CE Cas A as uncertain.
GH Lup: Gaia DR3 catalog classifies this star as a fundamental-mode Cepheid, which is also supported by the derived value of ABL (see Fig. 7b). The RV curve of this low-amplitude Cepheid is perfectly sinusoidal, with no detectable harmonic. Thus, its pulsation mode cannot be identified with the observed RV curve and remains unknown. However, with the period of 9.3 days, GH Lup is rather unlikely to pulsate in the first overtone. We recall that the longest pulsation period for securely identified first-overtone Cepheid is 7.57 days (for V440 Per) (Baranowski et al. 2009).
Low-order Fourier parameters of Cepheids with uncertain or unknown pulsation mode.
References
- Abt, H. A. 1959, ApJ, 130, 769 [NASA ADS] [CrossRef] [Google Scholar]
- Aikawa, T., & Antonello, E. 2000, A&A, 363, 593 [NASA ADS] [Google Scholar]
- Albrow, M. D., & Cottrell, P. L. 1996, MNRAS, 280, 917 [NASA ADS] [Google Scholar]
- Anderson, R. I. 2014, A&A, 566, L10 [NASA ADS] [CrossRef] [EDP Sciences] [Google Scholar]
- Anderson, R. I. 2016, MNRAS, 463, 1707 [NASA ADS] [CrossRef] [Google Scholar]
- Anderson, R. I. 2018a, A&A, 611, L7 [NASA ADS] [CrossRef] [EDP Sciences] [Google Scholar]
- Anderson, R. I. 2018b, in Proceedings of the Polish Astronomical Society, 6, The RR Lyrae 2017 Conference. Revival of the Classical Pulsators: From Galactic Structure to Stellar Interior Diagnostics, eds. R. Smolec, K. Kinemuchi, & R. I. Anderson, 193 [NASA ADS] [Google Scholar]
- Anderson, R. I. 2019, A&A, 623, A146 [NASA ADS] [CrossRef] [EDP Sciences] [Google Scholar]
- Anderson, R. I. 2020, in Stars and their Variability Observed from Space, eds. C. Neiner, W. W. Weiss, D. Baade, R. E. Griffin, C. C. Lovekin, & A. F. J. Moffat, 61 [Google Scholar]
- Anderson, R. I., Sahlmann, J., Holl, B., et al. 2015, ApJ, 804, 144 [CrossRef] [Google Scholar]
- Anderson, R. I., Casertano, S., Riess, A. G., et al. 2016a, ApJS, 226, 18 [NASA ADS] [CrossRef] [Google Scholar]
- Anderson, R. I., Mérand, A., Kervella, P., et al. 2016b, MNRAS, 455, 4231 [Google Scholar]
- Antonello, E., & Morelli, P. L. 1996, A&A, 314, 541 [NASA ADS] [Google Scholar]
- Antonello, E., & Poretti, E. 1986, A&A, 169, 149 [NASA ADS] [Google Scholar]
- Antonello, E., Poretti, E., & Reduzzi, L. 1990, A&A, 236, 138 [NASA ADS] [Google Scholar]
- Antonello, E., Speroni, L., Kanbur, S., Richter, I., & Szabó, R. 2009, Commun. Asteroseismol., 158, 274 [NASA ADS] [Google Scholar]
- Arellano Ferro, A. 1984, MNRAS, 209, 481 [CrossRef] [Google Scholar]
- Arellano Ferro, A., & Madore, B. F. 1985, The Observatory, 105, 207 [NASA ADS] [Google Scholar]
- Arenou, F., & Luri, X. 1999, in ASP Conf. Ser., 167, Harmonizing Cosmic Distance Scales in a Post-HIPPARCOS Era, eds. D. Egret, & A. Heck, 13 [NASA ADS] [Google Scholar]
- Astropy Collaboration (Price-Whelan, A. M., et al.) 2018, AJ, 156, 123 [Google Scholar]
- Astropy Collaboration (Price-Whelan, A. M., et al.) 2022, ApJ, 935, 167 [NASA ADS] [CrossRef] [Google Scholar]
- Baade, W. 1926, Astron. Nachr., 228, 359 [NASA ADS] [CrossRef] [Google Scholar]
- Babel, J., Burki, G., Mayor, M., Waelkens, C., & Chmielewski, Y. 1989, A&A, 216, 125 [NASA ADS] [Google Scholar]
- Balog, Z., Vinkó, J., & Kaszas, G. 1997, AJ, 113, 1833 [NASA ADS] [CrossRef] [Google Scholar]
- Baranne, A., Mayor, M., & Poncet, J. L. 1979, Vistas Astron., 23, 279 [NASA ADS] [CrossRef] [Google Scholar]
- Baranne, A., Queloz, D., Mayor, M., et al. 1996, A&AS, 119, 373 [NASA ADS] [CrossRef] [EDP Sciences] [Google Scholar]
- Baranowski, R., Smolec, R., Dimitrov, W., et al. 2009, MNRAS, 396, 2194 [NASA ADS] [CrossRef] [Google Scholar]
- Barnes, T. G., I., Moffett, T. J., & Slovak, M. H. 1988, ApJS, 66, 43 [NASA ADS] [CrossRef] [Google Scholar]
- Barnes, T. G., I., Jeffery, E. J., Montemayor, T. J., & Skillen, I. 2005, ApJS, 156, 227 [NASA ADS] [CrossRef] [Google Scholar]
- Beaulieu, J. P. 1998, Mem. Soc. Astron. Italiana, 69, 21 [NASA ADS] [Google Scholar]
- Becker, W. 1940, ZAp, 19, 289 [NASA ADS] [Google Scholar]
- Benedict, G. F., McArthur, B. E., Feast, M. W., et al. 2007, AJ, 133, 1810 [NASA ADS] [CrossRef] [Google Scholar]
- Berdnikov, L. N., Samus, N. N., Antipin, S. V., et al. 2004, PASP, 116, 536 [NASA ADS] [CrossRef] [Google Scholar]
- Berdnikov, L. N., Pastukhova, E. N., Gorynya, N. A., Zharova, A. V., & Turner, D. G. 2007, PASP, 119, 82 [NASA ADS] [CrossRef] [Google Scholar]
- Berdnikov, L. N., Kniazev, A. Y., Usenko, I. A., Kovtyukh, V. V., & Kravtsov, V. V. 2010, Astron. Lett., 36, 490 [NASA ADS] [CrossRef] [Google Scholar]
- Bersier, D. 2002, ApJS, 140, 465 [NASA ADS] [CrossRef] [Google Scholar]
- Bersier, D., Burki, G., Mayor, M., & Duquennoy, A. 1994, A&AS, 108, 25 [NASA ADS] [Google Scholar]
- Bhardwaj, A., Kanbur, S. M., Singh, H. P., Macri, L. M., & Ngeow, C.-C. 2015, MNRAS, 447, 3342 [CrossRef] [Google Scholar]
- Böhm-Vitense, E., Evans, N. R., Carpenter, K., et al. 1998, ApJ, 505, 903 [CrossRef] [Google Scholar]
- Borgniet, S., Kervella, P., Nardetto, N., et al. 2019, A&A, 631, A37 [NASA ADS] [CrossRef] [EDP Sciences] [Google Scholar]
- Breitfellner, M. G., & Gillet, D. 1993a, A&A, 277, 553 [NASA ADS] [Google Scholar]
- Breitfellner, M. G., & Gillet, D. 1993b, A&A, 277, 541 [NASA ADS] [Google Scholar]
- Breitfelder, J., Mérand, A., Kervella, P., et al. 2016, A&A, 587, A117 [CrossRef] [EDP Sciences] [Google Scholar]
- Buchler, J. R., & Kovács, G. 1986, ApJ, 303, 749 [NASA ADS] [CrossRef] [Google Scholar]
- Buchler, J. R., Moskalik, P., & Kovács, G. 1990, ApJ, 351, 617 [NASA ADS] [CrossRef] [Google Scholar]
- Buchler, J. R., Goupil, M. J., & Piciullo, R. 1997, ApJ, 491, L99 [NASA ADS] [CrossRef] [Google Scholar]
- Burki, G., & Benz, W. 1982, A&A, 115, 30 [NASA ADS] [Google Scholar]
- Butler, R. P. 1993, ApJ, 415, 323 [NASA ADS] [CrossRef] [Google Scholar]
- Christy, R. F. 1968, QJRAS, 9, 13 [NASA ADS] [Google Scholar]
- Christy, R. F. 1975, in NASA Special Publication, 383, 85 [NASA ADS] [Google Scholar]
- Clementini, G., Ripepi, V., Leccia, S., et al. 2016, A&A, 595, A133 [NASA ADS] [CrossRef] [EDP Sciences] [Google Scholar]
- Cogan, B. C. 1980, ApJ, 239, 941 [NASA ADS] [CrossRef] [Google Scholar]
- Coker, R., Madore, B., Mould, J., et al. 1989, PASP, 101, 594 [NASA ADS] [CrossRef] [Google Scholar]
- Coulson, I. M. 1983, MNRAS, 205, 1135 [NASA ADS] [CrossRef] [Google Scholar]
- Coulson, I. M., & Caldwell, J. A. R. 1985, South Afr. Astron. Observatory Circ., 9, 5 [Google Scholar]
- Coulson, I. M., Caldwell, J. A. R., & Gieren, W. P. 1985, ApJS, 57, 595 [NASA ADS] [CrossRef] [Google Scholar]
- Coulson, I. M., Caldwell, J. A. R., & Gieren, W. P. 1986, ApJ, 303, 273 [NASA ADS] [CrossRef] [Google Scholar]
- Cseh, B., Csörnyei, G., Szabados, L., et al. 2023, A&A, 680, A89 [NASA ADS] [CrossRef] [EDP Sciences] [Google Scholar]
- Deb, S., & Singh, H. P. 2010, MNRAS, 402, 691 [NASA ADS] [CrossRef] [Google Scholar]
- Derekas, A., Plachy, E., Molnár, L., et al. 2017, MNRAS, 464, 1553 [NASA ADS] [CrossRef] [Google Scholar]
- Eaton, J. A. 2020, JAAVSO, 48, 91 [NASA ADS] [Google Scholar]
- Evans, N. R. 1976, ApJS, 32, 399 [NASA ADS] [CrossRef] [Google Scholar]
- Evans, N. R. 1988, ApJS, 66, 343 [NASA ADS] [CrossRef] [Google Scholar]
- Evans, N. R., & Lyons, R. 1986, AJ, 92, 436 [NASA ADS] [CrossRef] [Google Scholar]
- Evans, N. R., & Sugars, B. J. A. 1997, AJ, 113, 792 [NASA ADS] [CrossRef] [Google Scholar]
- Evans, N. R., Welch, D. L., Scarfe, C. D., & Teays, T. J. 1990, AJ, 99, 1598 [NASA ADS] [CrossRef] [Google Scholar]
- Evans, N. R., Arellano Ferro, A., & Udalska, J. 1992, AJ, 103, 1638 [NASA ADS] [CrossRef] [Google Scholar]
- Evans, N. R., Welch, D. L., Slovak, M. H., Barnes, Thomas G.I., & Moffett, T. J. 1993, AJ, 106, 1599 [NASA ADS] [CrossRef] [Google Scholar]
- Evans, N. R., Vinkó, J., & Wahlgren, G. M. 2000, AJ, 120, 407 [NASA ADS] [CrossRef] [Google Scholar]
- Evans, N. R., Berdnikov, L., Gorynya, N., Rastorguev, A., & Eaton, J. 2011, AJ, 142, 87 [NASA ADS] [CrossRef] [Google Scholar]
- Evans, N. R., Berdnikov, L., Lauer, J., et al. 2015, AJ, 150, 13 [NASA ADS] [CrossRef] [Google Scholar]
- Evans, N. R., Karovska, M., Bond, H. E., et al. 2018, ApJ, 863, 187 [Google Scholar]
- Feast, M. W. 1967, MNRAS, 136, 141 [NASA ADS] [Google Scholar]
- Feast, M. W., & Catchpole, R. M. 1997, MNRAS, 286, L1 [NASA ADS] [CrossRef] [Google Scholar]
- Feuchtinger, M., Buchler, J. R., & Kolláth, Z. 2000, ApJ, 544, 1056 [CrossRef] [Google Scholar]
- Gaia Collaboration (Prusti, T., et al.) 2016, A&A, 595, A1 [NASA ADS] [CrossRef] [EDP Sciences] [Google Scholar]
- Gaia Collaboration (Vallenari, A., et al.) 2023, A&A, 674, A1 [NASA ADS] [CrossRef] [EDP Sciences] [Google Scholar]
- Gallenne, A., Kervella, P., Evans, N. R., et al. 2018, ApJ, 867, 121 [Google Scholar]
- Gallenne, A., Kervella, P., Borgniet, S., et al. 2019, A&A, 622, A164 [NASA ADS] [CrossRef] [EDP Sciences] [Google Scholar]
- Gieren, W. 1981, ApJS, 46, 287 [NASA ADS] [CrossRef] [Google Scholar]
- Gieren, W. P. 1985, A&A, 148, 138 [NASA ADS] [Google Scholar]
- Gieren, W. P., & Brieva, E. 1992, A&A, 253, 126 [NASA ADS] [Google Scholar]
- Gieren, W. P., Matthews, J. M., Moffett, T. J., et al. 1989, AJ, 98, 1672 [NASA ADS] [CrossRef] [Google Scholar]
- Gieren, W. P., Welch, D. L., Mermilliod, J.-C., Matthews, J. M., & Hertling, G. 1994, AJ, 107, 2093 [NASA ADS] [CrossRef] [Google Scholar]
- Gorynya, N. A. 1998, Inform. Bull. Variable Stars, 4636, 1 [NASA ADS] [Google Scholar]
- Gorynya, N. A., Irsmambetova, T. R., Rastorgouev, A. S., & Samus, N. N. 1992, Sov. Astron. Lett., 18, 316 [NASA ADS] [Google Scholar]
- Gorynya, N. A., Rastorguev, A. S., & Samus, N. N. 1996a, Astron. Lett., 22, 33 [NASA ADS] [Google Scholar]
- Gorynya, N. A., Samus, N. N., Rastorguev, A. S., & Sachkov, M. E. 1996b, Astron. Lett., 22, 175 [NASA ADS] [Google Scholar]
- Gorynya, N. A., Samus, N. N., Sachkov, M. E., et al. 1998, Astron. Lett., 24, 815 [NASA ADS] [Google Scholar]
- Gorynya, N. A., Samus, N. N., Sachkov, M. E., Antipin, S. V., & Rastorgouev, A. S. 2000, in ASP Conf. Ser., 203, IAU Colloq. 176: The Impact of Large-Scale Surveys on Pulsating Star Research, eds. L. Szabados, & D. Kurtz, 242 [NASA ADS] [Google Scholar]
- Griffin, R. F. 1967, ApJ, 148, 465 [NASA ADS] [CrossRef] [Google Scholar]
- Griffin, R. F. 2016, The Observatory, 136, 209 [Google Scholar]
- Groenewegen, M. A. T. 2008, A&A, 488, 25 [NASA ADS] [CrossRef] [EDP Sciences] [Google Scholar]
- Groenewegen, M. A. T. 2013, A&A, 550, A70 [NASA ADS] [CrossRef] [EDP Sciences] [Google Scholar]
- Groenewegen, M. A. T., & Jurkovic, M. I. 2017, A&A, 604, A29 [NASA ADS] [CrossRef] [EDP Sciences] [Google Scholar]
- Harris, H. C., & Wallerstein, G. 1984, AJ, 89, 379 [NASA ADS] [CrossRef] [Google Scholar]
- Harris, H. C., Welch, D. L., Kraft, R. P., & Schmidt, E. G. 1987, AJ, 94, 403 [NASA ADS] [CrossRef] [Google Scholar]
- Herbig, G. H., & Moore, J. H. 1952, ApJ, 116, 348 [NASA ADS] [CrossRef] [Google Scholar]
- Hertzsprung, E. 1919, Astron. Nachr., 210, 17 [Google Scholar]
- Hertzsprung, E. 1926, Bull. Astron. Inst. Netherlands, 3, 115 [Google Scholar]
- Hocdé, V., Nardetto, N., Borgniet, S., et al. 2020, A&A, 641, A74 [EDP Sciences] [Google Scholar]
- Hocdé, V., Smolec, R., Moskalik, P., Ziólkowska, O., & Singh Rathour, R. 2023, A&A, 671, A157 [NASA ADS] [CrossRef] [EDP Sciences] [Google Scholar]
- Hocdé, V., Smolec, R., Moskalik, P., Singh Rathour, R., & Ziólkowska, O. 2024, A&A, 683, A233 [NASA ADS] [CrossRef] [EDP Sciences] [Google Scholar]
- Imbert, M. 1981, A&AS, 44, 319 [NASA ADS] [Google Scholar]
- Imbert, M. 1983, A&AS, 53, 85 [NASA ADS] [Google Scholar]
- Imbert, M. 1984, A&AS, 58, 529 [NASA ADS] [Google Scholar]
- Imbert, M. 1996, A&AS, 116, 497 [NASA ADS] [CrossRef] [EDP Sciences] [Google Scholar]
- Imbert, M. 1999, A&AS, 140, 79 [NASA ADS] [CrossRef] [EDP Sciences] [Google Scholar]
- Joy, A. H. 1937, ApJ, 86, 363 [NASA ADS] [CrossRef] [Google Scholar]
- Katz, D., Sartoretti, P., Guerrier, A., et al. 2023, A&A, 674, A5 [NASA ADS] [CrossRef] [EDP Sciences] [Google Scholar]
- Kervella, P., Trahin, B., Bond, H. E., et al. 2017, A&A, 600, A127 [NASA ADS] [CrossRef] [EDP Sciences] [Google Scholar]
- Kervella, P., Gallenne, A., Evans, N. R., et al. 2019, A&A, 623, A116 [NASA ADS] [CrossRef] [EDP Sciences] [Google Scholar]
- Kienzle, F., Moskalik, P., Bersier, D., & Pont, F. 1999, A&A, 341, 818 [Google Scholar]
- Kienzle, F., Pont, F., Moskalik, P., & Bersier, D. 2000, in ASP Conf. Ser., 203, IAU Colloq. 176: The Impact of Large-Scale Surveys on Pulsating Star Research, eds. L. Szabados, & D. Kurtz, 239 [NASA ADS] [Google Scholar]
- Kiss, L. L., & Vinkó, J. 2000, MNRAS, 314, 420 [NASA ADS] [CrossRef] [Google Scholar]
- Klagyivik, P., & Szabados, L. 2007, Astron. Nachr., 328, 825 [NASA ADS] [CrossRef] [Google Scholar]
- Klapp, J., Goupil, M. J., & Buchler, J. R. 1985, ApJ, 296, 514 [NASA ADS] [CrossRef] [Google Scholar]
- Kovács, G., & Buchler, J. R. 1989, ApJ, 346, 898 [NASA ADS] [CrossRef] [Google Scholar]
- Kovács, G., Kisvarsányi, E. G., & Buchler, J. R. 1990, ApJ, 351, 606 [NASA ADS] [CrossRef] [Google Scholar]
- Kovács, G. B., Nuspl, J., & Szabó, R. 2023, MNRAS, 521, 4878 [CrossRef] [Google Scholar]
- Kovtyukh, V. V., Andrievsky, S. M., Usenko, I. A., & Klochkova, V. G. 1996, A&A, 316, 155 [NASA ADS] [Google Scholar]
- Ledoux, P., & Walraven, T. 1958, Handbuch Phys., 51, 353 [NASA ADS] [Google Scholar]
- Lindegren, L., Klioner, S. A., Hernández, J., et al. 2021, A&A, 649, A2 [EDP Sciences] [Google Scholar]
- Lindemann, F. A. 1918, MNRAS, 78, 639 [NASA ADS] [CrossRef] [Google Scholar]
- Lloyd Evans, T. 1968, MNRAS, 141, 109 [NASA ADS] [CrossRef] [Google Scholar]
- Lloyd Evans, T. 1980, South Afr. Astron. Observatory Circ., 1, 257 [Google Scholar]
- Lloyd Evans, T. 1982, MNRAS, 199, 925 [NASA ADS] [Google Scholar]
- Luck, R. E. 2018, AJ, 156, 171 [Google Scholar]
- Ludendorff, H. 1919, Astron. Nachr., 209, 217 [NASA ADS] [CrossRef] [Google Scholar]
- Majaess, D., Turner, D., Gieren, W., Berdnikov, L., & Lane, D. 2013, Ap&SS, 344, 381 [NASA ADS] [CrossRef] [Google Scholar]
- Mantegazza, L., & Poretti, E. 1992, A&A, 261, 137 [NASA ADS] [Google Scholar]
- Marschall, L. A., Seeds, M. A., & Davis, R. J. 1993, AJ, 106, 1123 [NASA ADS] [CrossRef] [Google Scholar]
- Matthews, J. M., Gieren, W. P., Mermilliod, J.-C., & Welch, D. L. 1995, AJ, 110, 2280 [NASA ADS] [CrossRef] [Google Scholar]
- Mermilliod, J. C., Mayor, M., & Burki, G. 1987, A&AS, 70, 389 [NASA ADS] [Google Scholar]
- Mermilliod, J. C., Mayor, M., & Udry, S. 2008, A&A, 485, 303 [NASA ADS] [CrossRef] [EDP Sciences] [Google Scholar]
- Metzger, M. R., Caldwell, J. A. R., McCarthy, J. K., & Schechter, P. J. 1991, ApJS, 76, 803 [NASA ADS] [CrossRef] [Google Scholar]
- Metzger, M. R., Caldwell, J. A. R., & Schechter, P. L. 1992, AJ, 103, 529 [NASA ADS] [CrossRef] [Google Scholar]
- Moskalik, P., & Buchler, J. R. 1989, ApJ, 341, 997 [NASA ADS] [CrossRef] [Google Scholar]
- Moskalik, P., & Krzyt, T. 1998, in ASP Conf. Ser., 135, A Half Century of Stellar Pulsation Interpretation, eds. P. A. Bradley, & J. A. Guzik, 29 [NASA ADS] [Google Scholar]
- Moskalik, P., & Ogloza, W. 2000, in ASP Conf. Ser., 203, IAU Colloq. 176: The Impact of Large-Scale Surveys on Pulsating Star Research, eds. L. Szabados, & D. Kurtz, 237 [NASA ADS] [Google Scholar]
- Moskalik, P., Buchler, J. R., & Marom, A. 1992, ApJ, 385, 685 [NASA ADS] [CrossRef] [Google Scholar]
- Moskalik, P., Krzyt, T., Gorynya, N. A., & Samus, N. N. 2000, in ASP Conf. Ser., 203, IAU Colloq. 176: The Impact of Large-Scale Surveys on Pulsating Star Research, eds. L. Szabados & D. Kurtz, 233 [NASA ADS] [Google Scholar]
- Munari, U. 1999, Baltic Astron., 8, 73 [Google Scholar]
- Nardetto, N., Gieren, W., Storm, J., et al. 2023, A&A, 671, A14 [NASA ADS] [CrossRef] [EDP Sciences] [Google Scholar]
- Neilson, H. R. 2014, A&A, 563, A48 [NASA ADS] [CrossRef] [EDP Sciences] [Google Scholar]
- Neilson, H. R., Engle, S. G., Guinan, E., et al. 2012, ApJ, 745, L32 [NASA ADS] [CrossRef] [Google Scholar]
- Parenago, P. P., & Kukarkin, B. W. 1936, ZAp, 11, 337 [NASA ADS] [Google Scholar]
- Paxton, B., Smolec, R., Schwab, J., et al. 2019, ApJS, 243, 10 [Google Scholar]
- Payne-Gaposchkin, C. 1947, AJ, 52, 218 [NASA ADS] [CrossRef] [Google Scholar]
- Pedicelli, S., Lemasle, B., Groenewegen, M., et al. 2010, A&A, 518, A11 [NASA ADS] [CrossRef] [EDP Sciences] [Google Scholar]
- Petersen, J. O. 1986, A&A, 170, 59 [NASA ADS] [Google Scholar]
- Petterson, O. K. L., Albrow, M. D., & Cottrell, P. L. 1998, Southern Stars, 38, 9 [NASA ADS] [Google Scholar]
- Petterson, O. K. L., Cottrell, P. L., & Albrow, M. D. 2004, MNRAS, 350, 95 [NASA ADS] [CrossRef] [Google Scholar]
- Petterson, O. K. L., Cottrell, P. L., Albrow, M. D., & Fokin, A. 2005, MNRAS, 362, 1167 [NASA ADS] [CrossRef] [Google Scholar]
- Pietrukowicz, P., Soszynski, I., & Udalski, A. 2021, Acta Astron., 71, 205 [NASA ADS] [Google Scholar]
- Pont, F., Burki, G., & Mayor, M. 1994, A&AS, 105, 165 [NASA ADS] [Google Scholar]
- Pont, F., Queloz, D., Bratschi, P., & Mayor, M. 1997, A&A, 318, 416 [NASA ADS] [Google Scholar]
- Pont, F., Kienzle, F., Gieren, W., & Fouqué, P. 2001, A&A, 376, 892 [NASA ADS] [CrossRef] [EDP Sciences] [Google Scholar]
- Poretti, E. 1994, A&A, 285, 524 [NASA ADS] [Google Scholar]
- Reyes, M. C., & Anderson, R. I. 2023, A&A, 672, A85 [NASA ADS] [CrossRef] [EDP Sciences] [Google Scholar]
- Riess, A. G., Casertano, S., Yuan, W., et al. 2021, ApJ, 908, L6 [NASA ADS] [CrossRef] [Google Scholar]
- Ripepi, V., Molinaro, R., Musella, I., et al. 2019, A&A, 625, A14 [NASA ADS] [CrossRef] [EDP Sciences] [Google Scholar]
- Ripepi, V., Catanzaro, G., Molinaro, R., et al. 2021, MNRAS, 508, 4047 [NASA ADS] [CrossRef] [Google Scholar]
- Ripepi, V., Clementini, G., Molinaro, R., et al. 2022, VizieR Online Data Catalog: J/A+A/674/A17 [Google Scholar]
- Ripepi, V., Clementini, G., Molinaro, R., et al. 2023, A&A, 674, A17 [NASA ADS] [CrossRef] [EDP Sciences] [Google Scholar]
- Sandage, A., Tammann, G. A., & Reindl, B. 2004, A&A, 424, 43 [NASA ADS] [CrossRef] [EDP Sciences] [Google Scholar]
- Sandage, A., Tammann, G. A., & Reindl, B. 2009, A&A, 493, 471 [NASA ADS] [CrossRef] [EDP Sciences] [Google Scholar]
- Schmidt, E. G. 1974, MNRAS, 167, 613 [NASA ADS] [CrossRef] [Google Scholar]
- Shapley, H., & McKibben, V. 1940, PNAS, 26, 105 [NASA ADS] [CrossRef] [Google Scholar]
- Simon, N. R., & Moffett, T. J. 1985, PASP, 97, 1078 [CrossRef] [Google Scholar]
- Simon, N. R., & Lee, A. S. 1981, ApJ, 248, 291 [NASA ADS] [CrossRef] [Google Scholar]
- Simon, N. R., & Schmidt, E. G. 1976, ApJ, 205, 162 [NASA ADS] [CrossRef] [Google Scholar]
- Simon, N. R., & Teays, T. J. 1983, ApJ, 265, 996 [CrossRef] [Google Scholar]
- Slovak, M. H., & Barnes, T. G. 1987, in BAAS, 19, 753 [NASA ADS] [Google Scholar]
- Smolec, R. 2017, MNRAS, 468, 4299 [NASA ADS] [CrossRef] [Google Scholar]
- Soszynski, I., Poleski, R., Udalski, A., et al. 2008, Acta Astron., 58, 163 [NASA ADS] [Google Scholar]
- Soszynski, I., Poleski, R., Udalski, A., et al. 2010, Acta Astron., 60, 17 [NASA ADS] [Google Scholar]
- Stibbs, D. W. N. 1955, MNRAS, 115, 363 [NASA ADS] [Google Scholar]
- Stobie, R. S. 1969, MNRAS, 144, 485 [NASA ADS] [Google Scholar]
- Stobie, R. S., & Balona, L. A. 1979, MNRAS, 189, 641 [NASA ADS] [CrossRef] [Google Scholar]
- Storm, J., Carney, B. W., Gieren, W. P., et al. 2004, A&A, 415, 531 [NASA ADS] [CrossRef] [EDP Sciences] [Google Scholar]
- Storm, J., Gieren, W., Fouqué, P., et al. 2011, A&A, 534, A94 [CrossRef] [EDP Sciences] [Google Scholar]
- Sugars, B. J. A., & Evans, N. R. 1996, AJ, 112, 1670 [NASA ADS] [CrossRef] [Google Scholar]
- Szabados, L. 1990, MNRAS, 242, 285 [CrossRef] [Google Scholar]
- Szabados, L. 2003, Inform. Bull. Variable Stars, 5394, 1 [NASA ADS] [Google Scholar]
- Szabados, L., & Klagyivik, P. 2012, A&A, 537, A81 [NASA ADS] [CrossRef] [EDP Sciences] [Google Scholar]
- Szabados, L., & Pont, F. 1998, A&AS, 133, 51 [NASA ADS] [CrossRef] [EDP Sciences] [Google Scholar]
- Szabados, L., Anderson, R. I., Derekas, A., et al. 2013a, MNRAS, 434, 870 [NASA ADS] [CrossRef] [Google Scholar]
- Szabados, L., Derekas, A., Kiss, L. L., et al. 2013b, MNRAS, 430, 2018 [NASA ADS] [CrossRef] [Google Scholar]
- Szabados, L., Cseh, B., Kovács, J., et al. 2014, MNRAS, 442, 3155 [CrossRef] [Google Scholar]
- Szabó, R., Szabados, L., Ngeow, C. C., et al. 2011, MNRAS, 413, 2709 [CrossRef] [Google Scholar]
- Torres, G. 2023, MNRAS, 526, 2510 [NASA ADS] [CrossRef] [Google Scholar]
- Turner, D. G., Majaess, D. J., Lane, D. J., et al. 2009, in American Institute of Physics Conference Series, 1170, Stellar Pulsation: Challenges for Theory and Observation, eds. J. A. Guzik, & P. A. Bradley, 108 [NASA ADS] [Google Scholar]
- Turner, D. G., Kovtyukh, V. V., Usenko, I. A., & Gorlova, N. I. 2013, ApJ, 762, L8 [CrossRef] [Google Scholar]
- Udalski, A., Soszynski, I., Pietrukowicz, P., et al. 2018, Acta Astron., 68, 315 [NASA ADS] [Google Scholar]
- Usenko, I. A., Kniazev, A. Y., Berdnikov, L. N., Fokin, A. B., & Kravtsov, V. V. 2014, Astron. Lett., 40, 435 [NASA ADS] [CrossRef] [Google Scholar]
- Usenko, I. A., Kovtyukh, V. V., Miroshnichenko, A. S., Danford, S., & Prendergast, P. 2018, MNRAS, 481, L115 [Google Scholar]
- Usenko, I. A., Miroshnichenko, A. S., Danford, S., Kovtyukh, V. V., & Turner, D. G. 2020, Odessa Astron. Publ., 33, 65 [Google Scholar]
- van Genderen, A. M. 1970, A&A, 7, 244 [NASA ADS] [Google Scholar]
- van Leeuwen, F. 2013, A&A, 550, A3 [NASA ADS] [CrossRef] [EDP Sciences] [Google Scholar]
- Vinkó, J., Evans, N. R., Kiss, L. L., & Szabados, L. 1998, MNRAS, 296, 824 [NASA ADS] [CrossRef] [Google Scholar]
- Wallerstein, G., Jacobsen, T. S., Cottrell, P. L., Clark, M., & Albrow, M. 1992, MNRAS, 259, 474 [NASA ADS] [Google Scholar]
- Wallerstein, G., Albright, M. B., & Ritchey, A. M. 2015, PASP, 127, 503 [CrossRef] [Google Scholar]
- Wallerstein, G., Anderson, R. I., Farrell, E. M., et al. 2019, PASP, 131, 094203 [CrossRef] [Google Scholar]
- Welch, D. L., & Evans, N. R. 1989, AJ, 97, 1153 [NASA ADS] [CrossRef] [Google Scholar]
- Welch, D. L., Evans, N. R., Lyons, R. W., et al. 1987, PASP, 99, 610 [NASA ADS] [CrossRef] [Google Scholar]
- Wesselink, A. J. 1946, Bull. Astron. Inst. Netherlands, 10, 91 [Google Scholar]
- Whitney, C. 1956, AJ, 61, 192 [NASA ADS] [CrossRef] [Google Scholar]
All Tables
New orbital periods of binary Cepheids adopted in this paper compared with the previously published values.
Low-order Fourier parameters of fundamental-mode Cepheids, stars of Quality 1a.
Low-order Fourier parameters of Cepheids with uncertain or unknown pulsation mode.
All Figures
|
Fig. 1 Radial velocity curves and Fourier fits for a set of fundamental-mode (a) and first-overtone Cepheids (b). The scale is indicated in the bottom left corner of the plots. For better visualization of the bump progression, the curves are aligned in such a way that their maxima are placed at ϕ = 0.3. |
| In the text | |
|
Fig. 2 First Fourier term, A1, for fundamental-mode and first-overtone Cepheids. Fundamental-mode variables of Quality 1 and 1a are plotted with black points, while gray points indicate variables of Quality 2. A vertical dashed line indicates a period of 10 days and is plotted to guide the eye in the resonance vicinity. |
| In the text | |
|
Fig. 3 Low-order Fourier parameters for RV curves of fundamental-mode and first-overtone Cepheids. For the fundamental mode, black points and gray points are variables of Quality (1+1a) and 2, respectively (see Table 1). Vertical dashed lined indicate a pulsation period of 4.68 and 10 days to guide the eye in the resonance vicinity of first-overtone and fundamental-mode Cepheids, respectively. |
| In the text | |
|
Fig. 4 Fourier parameters of fifth, sixth, and seventh terms for RV curves of the fundamental-mode Cepheids. Black points and gray points are variables of Quality (1+1a) and 2, respectively (see Table 1). |
| In the text | |
|
Fig. 5 Histograms of (a) the standard deviation of the fits σfit and (b) the number of data points Ndat for our Cepheid sample. Histogram of uncertainties of low-order Fourier parameters are displayed for (c) σ(ϕ21), (d) σ(R21), (e) σ(ϕ31), and (f) σ(R31) for Cepheids of this paper and, for comparison, for Cepheids from Storm et al. (2011). In each plot, the median of each sample is represented by a vertical dashed line. See Sect. 3. |
| In the text | |
|
Fig. 6 Fourier phase ϕ21 and amplitude ratio R21 for the Gaia DR3 G-band light curves. Gray and red colors represent fundamental-mode Cepheids and first-overtone Cepheids, respectively, as classified with the SOS Cep&RRL pipeline, which is based primarily on the R21−P plane. The vertical line indicates P = 5.5 days, where R2ı and ϕ21 both merge for the two modes. |
| In the text | |
|
Fig. 7 (a) Velocity Fourier phases ϕ21 for first-overtone and short-period fundamental-mode Cepheids. Red labels correspond to overtone Cepheids for which our results disagree either with the Gaia SOS Cep&RRL pipeline or with reclassification by (Ripepi et al. 2023) (see Table 2). Purple symbols correspond to stars with uncertain or unknown pulsation mode according to our criteria based on ϕ21. V1726 Cyg and GH Lup cannot be plotted because the second Fourier term has not been detected in these stars, and V636 Cas has very high ϕ21 ≃ 4.5 rad. (b) Astrometry-based luminosities in the Wesenheit G-band for selected stars of Fig. 7a. Relations for the first-overtone and fundamental-mode Cepheids are also plotted as red and black curves, respectively. |
| In the text | |
|
Fig. 8 Relationships between low-order Fourier phases, and between Fourier phase ϕ21 and amplitude ratio R21. The meaning of the different symbols is indicated in figure (a). |
| In the text | |
|
Fig. A.1 Differences of the Fourier parameter derived with weighted and with unweighted fits (black and orange, respectively). The error bars represent the uncertainties of the parameters themselves. |
| In the text | |
Current usage metrics show cumulative count of Article Views (full-text article views including HTML views, PDF and ePub downloads, according to the available data) and Abstracts Views on Vision4Press platform.
Data correspond to usage on the plateform after 2015. The current usage metrics is available 48-96 hours after online publication and is updated daily on week days.
Initial download of the metrics may take a while.