| Issue |
A&A
Volume 669, January 2023
|
|
|---|---|---|
| Article Number | L10 | |
| Number of page(s) | 5 | |
| Section | Letters to the Editor | |
| DOI | https://doi.org/10.1051/0004-6361/202245077 | |
| Published online | 10 January 2023 | |
Letter to the Editor
Star formation in outer rings of S0 galaxies
V. UGC 4599: An S0 with gas probably accreted from a filament
1
Sternberg Astronomical Institute of the Lomonosov Moscow State University, University av. 13, 119234 Moscow, Russia
e-mail: This email address is being protected from spambots. You need JavaScript enabled to view it.
2
Special Astrophysical Observatory of the Russian Academy of Sciences, Nizhnij Arkhyz, 369167, Russia
e-mail: This email address is being protected from spambots. You need JavaScript enabled to view it.
; e-mail: This email address is being protected from spambots. You need JavaScript enabled to view it.
3
Instituto de Astrofísica de Canarias, C/Via Lactea s/n, 38205 La Laguna Tenerife, Spain
4
Departamento de Astrofísica, Universidad de La Laguna, 38206 La Laguna, Tenerife, Spain
5
Observatorio Gemini Sur, NOIRLAB, c/o Recinto AURA, Colina El Pino s/n, La Serena, Chile
Received:
28
September
2022
Accepted:
12
December
2022
Abstract
Aims. Though S0 galaxies are usually thought to be ‘red and dead’, they often demonstrate weak star formation organised in ring structures and located in their outer disks. We try to clarify the nature of this phenomenon and its difference from star formation in spiral galaxies. The nearby moderate-luminosity S0 galaxy UGC 4599 is studied here.
Methods. By applying long-slit spectroscopy at the Russian 6 m telescope, we have measured stellar kinematics for the main body of the galaxy and strong emission-line flux ratios in the ring. After inspecting the gas excitation in the ring using line ratio diagrams, and having shown that it is ionised by young stars, we determined the gas oxygen abundance by using conventional strong-line calibration methods. We inspected the gas kinematics in the ring with Fabry–Perot interferometer data obtained at the William Herschel Telescope. The pattern and properties of the brightest star formation regions were studied with the tunable filter MaNGaL at the 2.5 m telescope of the Caucasian Mountain Observatory of the SAI MSU.
Results. The gas metallicity in the ring is certainly subsolar, [O/H] = −0.4 ± 0.1 dex, which is different from the majority of the outer star-forming rings in S0s we have studied in the past, which typically have nearly solar metallicity. The total stellar component of the galaxy, which is old in the centre, is less massive than its extended gaseous disk. We conclude that the ring and the outer disk of UGC 4599 are probably a result of gas accretion from a cosmological filament.
Key words: galaxies: evolution / galaxies: structure; galaxies: elliptical and lenticular, cD / galaxies: kinematics and dynamics / galaxies: star formation / galaxies: individual: UGC 4599
© The Authors 2023
 Open Access article, published by EDP Sciences, under the terms of the Creative Commons Attribution License (https://creativecommons.org/licenses/by/4.0), which permits unrestricted use, distribution, and reproduction in any medium, provided the original work is properly cited.
This article is published in open access under the Subscribe-to-Open model. This email address is being protected from spambots. You need JavaScript enabled to view it. to support open access publication.
1. Introduction
The morphological type S0 was initially introduced to classify star-formation-free disk galaxies (Hubble 1936), and outer rings were early recognised as common attributes of S0 galaxies (de Vaucouleurs 1959). Later, a significant amount of cold gas was found in many S0 galaxies, and in half of gas-rich S0s the gas feeds star formation, which is organised in ring structures (Pogge & Eskridge 1993). Moreover, more than the half of outer stellar rings in S0s are bright in the ultraviolet (UV), thus betraying recent star formation on a timescale of a few hundred megayears (Kostiuk & Sil’chenko 2015). In the frame of the current paradigm, according to which the evolution of disk galaxies is driven by a persistent accretion of outer cold gas, this situation with S0s is quite understandable because in sparse environments the S0s may suffer the same outer gas accretion as spirals, with a possibility of star formation in accreted gas. However, the source of outer gas accretion remains unknown. Cosmologists are sure that this source is provided by large-scale Universe structure, in particular by large-scale filaments filled by dark matter and primordial gas (e.g., Ocvirk et al. 2008). Observations reveal nearly solar metallicity in the outer star-forming rings of S0 galaxies, favouring the merging of relatively gas-rich satellites (Sil’chenko et al. 2019; Sil’chenko & Moiseev 2020). In this Letter we examine an outer star-forming ring in UGC 4599, a nearby moderate-luminosity S0 galaxy, which indeed has a rather low metallicity and may therefore be fed by primordial gas from cosmological filaments.
The galaxy image taken from the Legacy Survey resource (Dey et al. 2019), including the data from the DECaLS (Dark Energy Camera Legacy Survey) photometric survey, is presented in Fig. 1. It is seen almost face-on and with the adopted distance of 32 Mpc, the cosmology-corrected luminosity distance from the NASA Extragalactic Database (NED), the radius of the ring is 7.7 kpc. Finkelman & Brosch (2011) claimed that UGC 4599 is an analogue of the famous Hoag galaxy and, thus, a small elliptical surrounded by a detached ring. However, there have also been other opinions: Dowell (2010) treated UGC 4599 as a classical S0, with the de Vaucouleurs’ bulge contributing only 32% to the total luminosity and a low-surface-brightness (LSB) exponential disk. Gutiérrez et al. (2011) found even more disks: they classified UGC 4599 as a Type-III-d after discovering not one but two LSB disks, with the exponential scale lengths of 6.5 kpc and 10 kpc. Indeed, the deep image in Fig. 1 allows us to trace the blue disk of UGC 4599, which extends well beyond the ring radius. The galaxy is extremely rich in HI: data from the ALFALFA (Arecibo Legacy Fast ALFA) survey reveal about 1010 M⊙ of neutral hydrogen and an HI disk diameter of ∼100 kpc (Grossi et al. 2009). We have undertaken a further investigation of the galaxy by applying long-slit spectroscopy, Fabry–Perot interferometry, and narrow-band imaging in the strong emission lines.
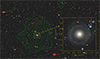 |
Fig. 1. Legacy Surveys colour image of UGC 4599 and its environments. The HI density contours are overlaid following Grossi et al. (2009). North is up, and east is to the left. |
2. Observations and the data involved
Our long-slit spectral observations were made with the multi-mode reducer SCORPIO-2 (Afanasiev & Moiseev 2011) at the prime focus of the Russian 6 m BTA telescope of the Special Astrophysical Observatory, Russian Academy of Sciences (SAO RAS). UGC 4599 was observed on February 25, 2014, at PA(slit) = 115°, with a total exposure time of 75 min; on March 26, 2015, in the orientation through the neighbouring galaxy (designated as ‘A’ in Fig. 2, the third plot), at PA(slit) = 132°, with a total exposure time of 60 min; and with a short exposure at PA(slit) = 49° in February 2022. The slit orientations are shown in Fig. 2. During the observations the range of airmass was 1.2–1.5. The seeing was ∼1″, and the VPHG1200 grism provided an intermediate spectral resolution full width at half maximum (FWHM) ≈ 5 Å in the wavelength region from 4000 Å to 7200 Å. This spectral range includes a set of strong absorption and emission lines, making it suitable for analysing both the stellar and gaseous kinematics of the galaxy, as well as the gas excitation and chemistry. The slit is 1″ in width and 6′ in length, allowing us to use the edge spectra to subtract the sky background. The CCD E2V 42-90, with a format of 2048 × 4600, used in the 1 × 2 binning mode provided a spatial scale of 0.357″ per px and a spectral sampling of 0.86 Å px−1. The data reduction as well as the derivation of the characteristics of the gaseous kinematics were standard for our SCORPIO-2 data (see for example Proshina et al. 2020). The profiles of the line-of-sight (LOS) stellar velocity were calculated via the cross-correlation of the galactic spectra binned along the slit with best-matched template spectra of K-type stars from the library MILES (Sánchez-Blázquez et al. 2006).
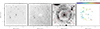 |
Fig. 2. MaNGaL images of UGC 4599, from left to right: in the emission line [OIII]λ5007; in the emission line [NII]λ6583; the GALEX (Galaxy Evolution Explorer) near-UV image with the SCORPIO-2 slit orientations overplotted; and the Hα velocity field taken with GHαFaS. In each plot, north is up, and east is to the left. |
To study the kinematics in the Hα emission, we obtained the data using the Fabry–Perot Interferometer GHαFaS (Hernandez et al. 2008) on the William Herschel Telescope (WHT) at the Roque de los Muchachos Observatory, La Palma. GHαFaS has a circular field of view of 3.4 arcmin, a free spectral range of 8 Å, which corresponds to 390 km s−1 with a velocity resolution of 8 km s−1, and a spatial sampling of 0.2″. The observations were undertaken on March 14, 2016, with a total exposure of 160 s in each of the 40 spectral channels. The seeing was 1.2″.
We also carried out observations at the 2.5 m Caucasian Mountain Observatory of the Sternberg Astronomical Institute (CMO SAI MSU) telescope with the tuned narrow-band photometer MaNGaL (Mapper of Narrow Galaxy Lines; Moiseev et al. 2020). The observations were performed in two redshifted emission lines, [OIII]λ5007 and [NII]λ6583, within the 13 Å band, to study the surface brightness distributions in these lines, which characterise the ionised gas in the ring. The detector, CCD iKon-M934 with the format of 1024 × 1024, provided the field of view of 5.4 arcmin and the sampling of 0.33″ per pixel. The observations were undertaken on November 14, 2020, for [NII]λ6583, with an exposure time of 75 min, and on November 17, 2020, for [OIII]λ5007, with an exposure time of 60 min. The seeing was 1.3″ on the first date and 1.9″ on the second date.
To study the large-scale structure of the galaxy, we used the gr-band images from the Legacy Survey (the DECaLS data).
3. Emission lines in the ring of UGC 4599
The ring of the galaxy at R ∼ 50″, prominent in the optical continuum (Fig. 1) and in the UV (Fig. 2), is also well traced by the emission-line regions in the [OIII]λ5007 line (Fig. 2, left): we can see more than a dozen compact emission-line sources in Fig. 2 (left). Only a few of these regions are also seen in the [NII]λ6583 emission line (Fig. 2), and these detections are mostly concentrated in the eastern half of the ring. This difference in the surface distributions of the high-excitation and low-excitation emission lines is confirmed by the literature data: Dowell (2010) and Finkelman & Brosch (2011) analysed the deep narrow-band images of UGC 4599 in Hα obtained within the spectral windows that include both Hα and [NII]λ6583 and also noted only HII regions concentrated in the eastern and northern part of the ring. Salzer et al. (2020) searched for compact star-forming galaxies by using deep narrow-band photometry in the Hα line and found four HII regions in the ring of UGC 4599 (their no. 103, 104, 105, and 106); for these ‘HaDots’ the full-range spectra were also obtained at the Hobby-Eberly 9.2 m telescope (HET). We used their emission-line ratios together with our results to inspect gas excitation (Fig. 3).
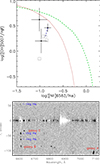 |
Fig. 3. Emission lines in the ring of UGC 4599 and nearby galaxies. Upper plot: BPT-diagram for the ring HII regions, both from our long-slit spectroscopy (with error bars) and from Salzer et al. (2020) (squares). The measurements for the common HII region are connected by a dashed blue line. The lines that divide excitation mechanisms are from Kewley et al. (2001) (the dashed green line) and from Kauffmann et al. (2003) (the red dotted line). Bottom plot: view of the red part of the continuum-subtracted long-slit spectrum at PA = 132°. |
Our long slit at PA(slit) = 115° crossed the eastern emission-line region, the brightest one in the ring, and our long slit at PA(slit) = 132° passed through a small galaxy to the north-west of UGC 4599 which is designated as ‘A’ in Fig. 2. In fact, when we looked at the spectrum we saw a lot of emission-line objects to the north-west of the centre of UGC 4599 (Fig. 3). Two of them belong to the ring of the galaxy, which is split into two arms to the west, and three of them are background galaxies, with redshifts of 0.08 (A), 0.360 (B), and 0.324 (C).
We used the strong emission-line flux ratios to check the gas excitation by inspecting the so-called Baldwin–Phillips–Terlevich (BPT) diagram (Baldwin et al. 1981) in Fig. 3. All the HII regions with full-range spectra – four are in the eastern part of the ring measured by Salzer et al. (2020) and from our data for the brightest eastern region, and two are measured in our cross-sections of the ring to the north-west from the centre – indeed show HII-type excitation, as they are located to the left of the dividing lines prescribed by Kewley et al. (2001) and Kauffmann et al. (2003). We were thus able to determine the ionised-gas oxygen abundances by using the strong-line calibrations. We used the widely known calibrations from Perez-Montero (2014) and Marino et al. (2013). By averaging the oxygen abundances derived from our measurements of N2 and O3N2 for three more bright HII regions, we obtained 12 + log(O/H) = 8.23 ± 0.05 dex from the Marino et al. (2013) calibrations. The models by Perez-Montero (2014) involving the measurements of six emission lines, Hβ, [OIII]λ5007, Hα, [NII]λ6583, and [SII]λλ6717,6731, gives 12 + log(O/H) = 8.40 ± 0.11 dex.
4. The central stellar spin and the gas kinematics in the ring of UGC 4599
For the main optical emission line of star-forming regions, Hα, we observed UGC 4599 with the scanning Fabry–Perot interferometer at the 4.2 m WHT in this emission line to derive not only the Hα map, but also the LOS velocity map which reflects the projection of the ionised-gas rotation in the ring. The results are presented in Fig. 2 (right panel). Under the assumption of planar circular gas rotation, we can restrict the gaseous disk orientation by using the two-dimensional LOS velocity distribution: at a fixed radius the projection of the tangential rotation velocity would be maximal at the line of nodes of the gaseous disk and would be zero in the orthogonal direction. Using the tilted-ring model of circular rotation as described in Sil’chenko et al. (2019), we obtained the orientation of the line of nodes of the gaseous disk at the radius of the ring: PA0 = 271° ±9°. As for the inclination, we can estimate it by plotting UGC 4599 – with its HI line width W50 = 148 km s−1 (Grossi et al. 2009) and its baryonic mass, stellar plus gaseous, log Mb = 10.18 (Huang et al. 2014) – onto the baryonic Tully-Fisher relation from, for example, Lelli et al. (2019), obtaining ig ≈ 32°. The orientation of the stellar rotation plane can be estimated from the long-slit data. The photometric inclination of the stellar disk was given by Gutiérrez et al. (2011) as i* = 24°, under the assumption of a relative disk thickness of q0 = 0.2. Under the more realistic assumption of q0 = 0.4 found by us for lenticular galaxies in sparse environments (Sil’chenko et al. 2020), this estimate transforms to i* = 26°. The model LOS velocity profiles calculated with this assumed inclination for three different stellar-disk line-of-nodes orientations are superposed onto our long-slit measurements in Fig. 4. It can be seen that the line-of-nodes position angle of the gaseous disk, PA0 = 271° ±9°, can be excluded for the stellar disk due to the zero velocity gradient along the PA = 49°. By fitting all three long-slit cross-sections (Fig. 4), the best estimate of the line-of-nodes position angle for the central stellar disk would be PA0 = 324° ±20°. Evidently, the plane of the gaseous disk is inclined with respect to the central stellar disk. This configuration is dynamically unstable and is evidence of recent gas accretion.
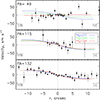 |
Fig. 4. LOS velocities of stars along three SCORPIO-2 slit position angles. Coloured lines show the projection of the second-degree polynomial fitting of the mean rotation curve for the various accepted PA0. LOS velocities of stars along three SCORPIO-2 slit position angles. Coloured lines show the projection of the second-degree polynomial fitting of the mean rotation curve for the various accepted PA0. |
5. Discussion
5.1. The structure and morphological type of UGC 4599
There are differences in the literature opinions regarding the luminosity and morphological type of UGC 4599. For example, Finkelman & Brosch (2011) treated UGC 4599 as a dwarf elliptical galaxy, with Mg = −17.9 (MB = −17.4) and a detached 8 kpc ring. However, researchers who focused on its extended HI disk also noted its large stellar disk and classified UGC 4599 as an intermediate-luminosity lenticular galaxy: Grossi et al. (2009) estimated its integrated absolute magnitude as MB = −19.07 and Dowell (2010) as MB = −19.42 ± 0.02.
We inspected the new, rather deep gr images of UGC 4599 provided by the DECaLS survey. We present our results of isophote analysis and the azimuthally averaged surface brightness profile of UGC 4599 in Fig. 5. Indeed, we do not see any gap between the central body (including perhaps the exponential pseudo-bulge) and the ring: the ring in the radius range 45″–65″ is superposed onto the extended exponential disk, which can be fitted over the R = 35″ − 100″ range by a model profile μr = 23.6 + 1.086R/49.1″. With respect to the measurements by Gutiérrez et al. (2011), we have obtained a slightly larger exponential scale length for the inner portion of the UGC 4599 disk because we excluded the ring from our fitting. In any case, with its scale length of 7.5 kpc and its central surface brightness of μ0(r)=23.6, the galaxy can be classified as an LSB disk galaxy. Moreover, when we estimate the integrated characteristics of the disk in Fig. 5 (right), MV = −19.8 and reff = 12.6 kpc, and compare them with the data in Fig. 12 of Greco et al. (2018) and with the data in Fig. 1 of Saburova et al. (2021), we ascertain that UGC 4599 belongs to the class of giant low surface brightness disk galaxies and resembles objects considered by Saburova et al. (2021), such as UGC 1378 or UGC 1382.
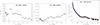 |
Fig. 5. Results of the analysis of the r-band UGC 4599 image from the DECaLS survey: isophote characteristics (the left and central plot) and the azimuthally averaged surface brightness profile with the pseudo-bulge and inner disk fitted by exponential relations (the right plot). The two fitted exponential relations are: μr = 20.5 + 1.086R/8.8″ (dashed blue line) and μr = 23.6 + 1.086R/49.1″ (dashed red line). |
5.2. The origin of the gaseous disk in UGC 4599
As found by Saburova et al. (2021), the most frequent scenario of giant LSB galaxy formation is accretion of high-momentum gas from an outside source. The second most favoured scenario, coplanar merging of two large spiral galaxies (which was also suggested by Finkelman & Brosch 2011), can be excluded for UGC 4599 by our data because the low oxygen abundance of the ionised gas in the star-forming ring contradicts the typically solar abundance of gas in non-dwarf spiral galaxies (Tremonti et al. 2004; Pilyugin et al. 2004). The outer gas accretion scenario is also more suitable because of the inclined orientation of the gaseous ring spin vector with respect to the collective stellar angular momentum. But a question remains as to the source of the outer gas.
The environment of UGC 4599 is rather sparse, though the galaxy has been included in galaxy groups in several catalogues: in USGC 191 by Ramella et al. (2002) and in the compact triplet UZC-CG 79 by Focardi & Kelm (2002). Indeed, the group contains three galaxies of comparable luminosities, UGC 4599, UGC 4590, and UGC 4550. The tightest pair separation, between UGC 4599 and UGC 4590, is 179 kpc, and the third galaxy, UGC 4550, is classified as completely isolated in the 2MIG (Two Micron all-sky survey Isolated Galaxies) catalogue (Karachentseva et al. 2010). It is important to note, though, that UGC 4590 is devoid of neutral hydrogen (Grossi et al. 2009). Grossi et al. (2009) proposed a hypothesis of gas flow to UGC 4599 from the nearby dwarf PGC 24666 (CGCG 061-011) because several HI clumps were detected between UGC 4599 and CGCG 061-011. But CGCG 061-011 is a very small galaxy, with a stellar mass of 3 × 10⁸ M⊙ (Alatalo et al. 2016) and an HI mass of 4 × 10⁸ M⊙ (Haynes et al. 2018). It seems improbable that CGCG 061-011 provides a two-order-larger mass of neutral hydrogen for UGC 4599. Moreover, the metallicity of the ionised gas may be higher in CGCG 061-011 than in UGC 4599. For the latter we measured log[NII]λ6583/Hα = −0.95 ± 0.01 by averaging our emission-line measurements for five HII regions (it corresponds to 12 + log(O/H) = 8.23 dex; Marino et al. 2013). For CGCG 061-011 we obtained a long-slit spectrum with SCORPIO-2 on October 31, 2022. After excluding the more metal-rich galaxy core, the remaining log[NII]λ6583/Hα profile up to r = 13″ appears to be flat, and it reveals a mean nitrogen-to-hydrogen line ratio of −0.809 ± 0.005, corresponding to 12 + log(O/H) = 8.30 ± 0.09 dex (Marino et al. 2013). Therefore, the ionised gas in the star-forming ring of UGC 4599 is oxygen-poorer than the gas in the dwarf galaxy CGCG 061-011: it cannot be a donor. The completed merger of a small gas-rich satellite would not explain the large HI disk of UGC 4599 either, because of its very large mass of accreted neutral hydrogen, 1.1 × 10¹⁰ M⊙ (Haynes et al. 2018); the total stellar mass of UGC 4599 is less than half of this, M* = 4 × 10⁹ M⊙ (Huang et al. 2014). Therefore, we cannot identify a suitable galaxy to play the role of gas donor in the vicinity of UGC 4599.
The metallicity of the ionised gas in the ring of UGC 4599 appears to be unusually low, −0.4 dex. Up to now we have studied a dozen outer star-forming rings in lenticular galaxies, and the gas metallicities in these rings are very homogeneous, −0.15 dex, independent of the galaxy luminosity or ring radius (Sil’chenko et al. 2019; Proshina et al. 2020). By confronting the high relative mass of HI and the low metallicity of the ionised gas, we reach the conclusion that this is perhaps the first clear case of gas accretion to a ring of an S0 galaxy from a cosmological filament. If so, the chain of HI clumps in the direction from UGC 4599 to PGC 24666 (Grossi et al. 2009) may trace this filament. A similar structure has been observed in 21 cm near the Hoag object, which is a recognised case of filamentary gas accretion onto an elliptical galaxy (Brosch et al. 2013).
Acknowledgments
This study is based on the data obtained at the unique scientific facility the Big Telescope Alt-azimuthal SAO RAS and was supported under the Ministry of Science and Higher Education of the Russian Federation grant 075-15-2022-262 (13.MNPMU.21.0003). The renovation of 6 m telescope equipment is currently provided within the national project “Science”. The work used the public data of the Legacy Surveys (http://legacysurvey.org) survey, that consists of three individual and complementary projects: the Dark Energy Camera Legacy Survey (DECaLS; Proposal ID ♯2014B − 0404; PIs: David Schlegel and Arjun Dey), the Beijing-Arizona Sky Survey (BASS; NOAO Prop. ID ♯2015A − 0801; PIs: Zhou Xu and Xiaohui Fan), and the Mayall z-band Legacy Survey (MzLS; Prop. ID ♯2016A − 0453; PI: Arjun Dey). DECaLS, BASS and MzLS together include data obtained, respectively, at the Blanco telescope, Cerro Tololo Inter-American Observatory, NSF’s NOIRLab; the Bok telescope, Steward Observatory, University of Arizona; and the Mayall telescope, Kitt Peak National Observatory, NOIRLab. The Legacy Surveys project is honored to be permitted to conduct astronomical research on Iolkam Duág (Kitt Peak), a mountain with particular significance to the Tohono Oódham Nation. The NASA GALEX mission data for our Fig. 2, were taken from the Mikulski Archive for Space Telescopes (MAST). The William Herschel Telescope is in the Isaac Newton Group of telescopes, situated at the Roque de los Muchachos Observatory, La Palma, of the Instituto de Astrofisica de Canarias (IAC).
References
- Afanasiev, V. L., & Moiseev, A. V. 2011, Baltic Astron., 20, 363 [NASA ADS] [Google Scholar]
- Alatalo, K., Cales, S. L., Rich, J. A., et al. 2016, ApJS, 224, 38 [NASA ADS] [CrossRef] [Google Scholar]
- Baldwin, J. A., Phillips, M. M., & Terlevich, R. 1981, PASP, 93, 5 [Google Scholar]
- Brosch, N., Finkelman, I., Oosterloo, T., et al. 2013, MNRAS, 435, 475 [NASA ADS] [CrossRef] [Google Scholar]
- de Vaucouleurs, G. 1959, Handbuch Phys., 53, 275 [Google Scholar]
- Dey, A., Schlegel, D. J., Lang, D., et al. 2019, AJ, 157, A168 [NASA ADS] [CrossRef] [Google Scholar]
- Dowell, J. D. 2010, PhD Thesis, Univ. of Indiana [Google Scholar]
- Finkelman, I., & Brosch, N. 2011, MNRAS, 413, 2621 [NASA ADS] [CrossRef] [Google Scholar]
- Focardi, P., & Kelm, B. 2002, A& A, 391, 35 [NASA ADS] [CrossRef] [EDP Sciences] [Google Scholar]
- Freeman, K. C. 1970, ApJ, 160, 767 [NASA ADS] [CrossRef] [Google Scholar]
- Greco, J. P., Greene, J. E., Strauss, M. A., et al. 2018, ApJ, 857, 104 [NASA ADS] [CrossRef] [Google Scholar]
- Grossi, M., di Serego Alighieri, S., Giovanardi, C., et al. 2009, A&A, 498, 407 [NASA ADS] [CrossRef] [EDP Sciences] [Google Scholar]
- Gutiérrez, L., Erwin, P., Aladro, R., & Beckman, J. E. 2011, AJ, 142, A145 [CrossRef] [Google Scholar]
- Haynes, M. P., Giovanelli, R., Kent, B. R., et al. 2018, ApJ, 861, 49 [Google Scholar]
- Hernandez, O., Nicolosi, V., Lotya, M., et al. 2008, PASP, 120, 665 [NASA ADS] [CrossRef] [Google Scholar]
- Huang, S., Haynes, M. P., Giovanelli, R., et al. 2014, ApJ, 793, 40 [NASA ADS] [CrossRef] [Google Scholar]
- Hubble, E. P. 1936, The Realm of the Nebulae (New Haven: Yale Univ. Press) [Google Scholar]
- Karachentseva, V. E., Mitronova, S. N., Melnyk, O. V., & Karachentsev, I. D. 2010, Astrophys. Bull., 65, 1 [NASA ADS] [CrossRef] [Google Scholar]
- Kauffmann, G., Heckman, T. M., Tremonti, Ch., et al. 2003, MNRAS, 346, 1055 [NASA ADS] [CrossRef] [Google Scholar]
- Kewley, L. J., Dopita, M. A., Sutherland, R. S., Heisler, C. A., & Trevena, J. 2001, ApJ, 556, 121 [Google Scholar]
- Kostiuk, I. P., & Sil’chenko, O. K. 2015, Astrophys. Bull., 70, 280 [NASA ADS] [CrossRef] [Google Scholar]
- Lelli, F., McGaugh, S. S., Schombert, J. M., et al. 2019, MNRAS, 484, 3267 [NASA ADS] [CrossRef] [Google Scholar]
- Marino, R. A., Rosales-Ortega, F. F., Sánchez, S. F., et al. 2013, A&A, 559, A114 [NASA ADS] [CrossRef] [EDP Sciences] [Google Scholar]
- Moiseev, A., Perepelitsyn, A., & Oparin, D. 2020, Exp. Astron., 50, 199 [NASA ADS] [CrossRef] [Google Scholar]
- Ocvirk, P., Pichon, C., & Teyssier, R. 2008, MNRAS, 390, 1326 [Google Scholar]
- Perez-Montero, E. 2014, MNRAS, 441, 2663 [CrossRef] [Google Scholar]
- Pilyugin, L. S., Vilchez, J. M., & Contini, T. 2004, A& A, 425, 849 [NASA ADS] [CrossRef] [EDP Sciences] [Google Scholar]
- Pogge, R. W., & Eskridge, P. B. 1993, AJ, 106, 1405 [NASA ADS] [CrossRef] [Google Scholar]
- Proshina, I., Sil’chenko, O., & Moiseev, A. 2020, A& A, 634, A102 [NASA ADS] [CrossRef] [EDP Sciences] [Google Scholar]
- Ramella, M., Geller, M. J., Pisani, A., & da Costa, L. N. 2002, AJ, 123, 2976 [NASA ADS] [CrossRef] [Google Scholar]
- Saburova, A. S., Chilingarian, I. V., Kasparova, A. V., et al. 2021, MNRAS, 503, 830 [NASA ADS] [CrossRef] [Google Scholar]
- Salzer, J. J., Feddersen, J. R., Derloshon, K., et al. 2020, AJ, 160, A242 [NASA ADS] [CrossRef] [Google Scholar]
- Sánchez-Blázquez, P., Peletier, R. F., Jiménez-Vicente, J., et al. 2006, MNRAS, 371, 703 [Google Scholar]
- Sil’chenko, O. K., & Moiseev, A. V. 2020, A& A, 638, L10 [CrossRef] [EDP Sciences] [Google Scholar]
- Sil’chenko, O. K., Moiseev, A. V., & Egorov, O. V. 2019, ApJ Suppl. Ser., 244, A6 [CrossRef] [Google Scholar]
- Sil’chenko, O. K., Kniazev, A. Yu., & Chudakova, E. M. 2020, AJ, 160, A95 [CrossRef] [Google Scholar]
- Tremonti, Ch. A., Heckman, T. M., Kauffmann, G., et al. 2004, ApJ, 613, 898 [CrossRef] [Google Scholar]
All Figures
|
Fig. 1. Legacy Surveys colour image of UGC 4599 and its environments. The HI density contours are overlaid following Grossi et al. (2009). North is up, and east is to the left. |
| In the text | |
|
Fig. 2. MaNGaL images of UGC 4599, from left to right: in the emission line [OIII]λ5007; in the emission line [NII]λ6583; the GALEX (Galaxy Evolution Explorer) near-UV image with the SCORPIO-2 slit orientations overplotted; and the Hα velocity field taken with GHαFaS. In each plot, north is up, and east is to the left. |
| In the text | |
|
Fig. 3. Emission lines in the ring of UGC 4599 and nearby galaxies. Upper plot: BPT-diagram for the ring HII regions, both from our long-slit spectroscopy (with error bars) and from Salzer et al. (2020) (squares). The measurements for the common HII region are connected by a dashed blue line. The lines that divide excitation mechanisms are from Kewley et al. (2001) (the dashed green line) and from Kauffmann et al. (2003) (the red dotted line). Bottom plot: view of the red part of the continuum-subtracted long-slit spectrum at PA = 132°. |
| In the text | |
|
Fig. 4. LOS velocities of stars along three SCORPIO-2 slit position angles. Coloured lines show the projection of the second-degree polynomial fitting of the mean rotation curve for the various accepted PA0. LOS velocities of stars along three SCORPIO-2 slit position angles. Coloured lines show the projection of the second-degree polynomial fitting of the mean rotation curve for the various accepted PA0. |
| In the text | |
|
Fig. 5. Results of the analysis of the r-band UGC 4599 image from the DECaLS survey: isophote characteristics (the left and central plot) and the azimuthally averaged surface brightness profile with the pseudo-bulge and inner disk fitted by exponential relations (the right plot). The two fitted exponential relations are: μr = 20.5 + 1.086R/8.8″ (dashed blue line) and μr = 23.6 + 1.086R/49.1″ (dashed red line). |
| In the text | |
Current usage metrics show cumulative count of Article Views (full-text article views including HTML views, PDF and ePub downloads, according to the available data) and Abstracts Views on Vision4Press platform.
Data correspond to usage on the plateform after 2015. The current usage metrics is available 48-96 hours after online publication and is updated daily on week days.
Initial download of the metrics may take a while.