Fig. 3.
Download original image
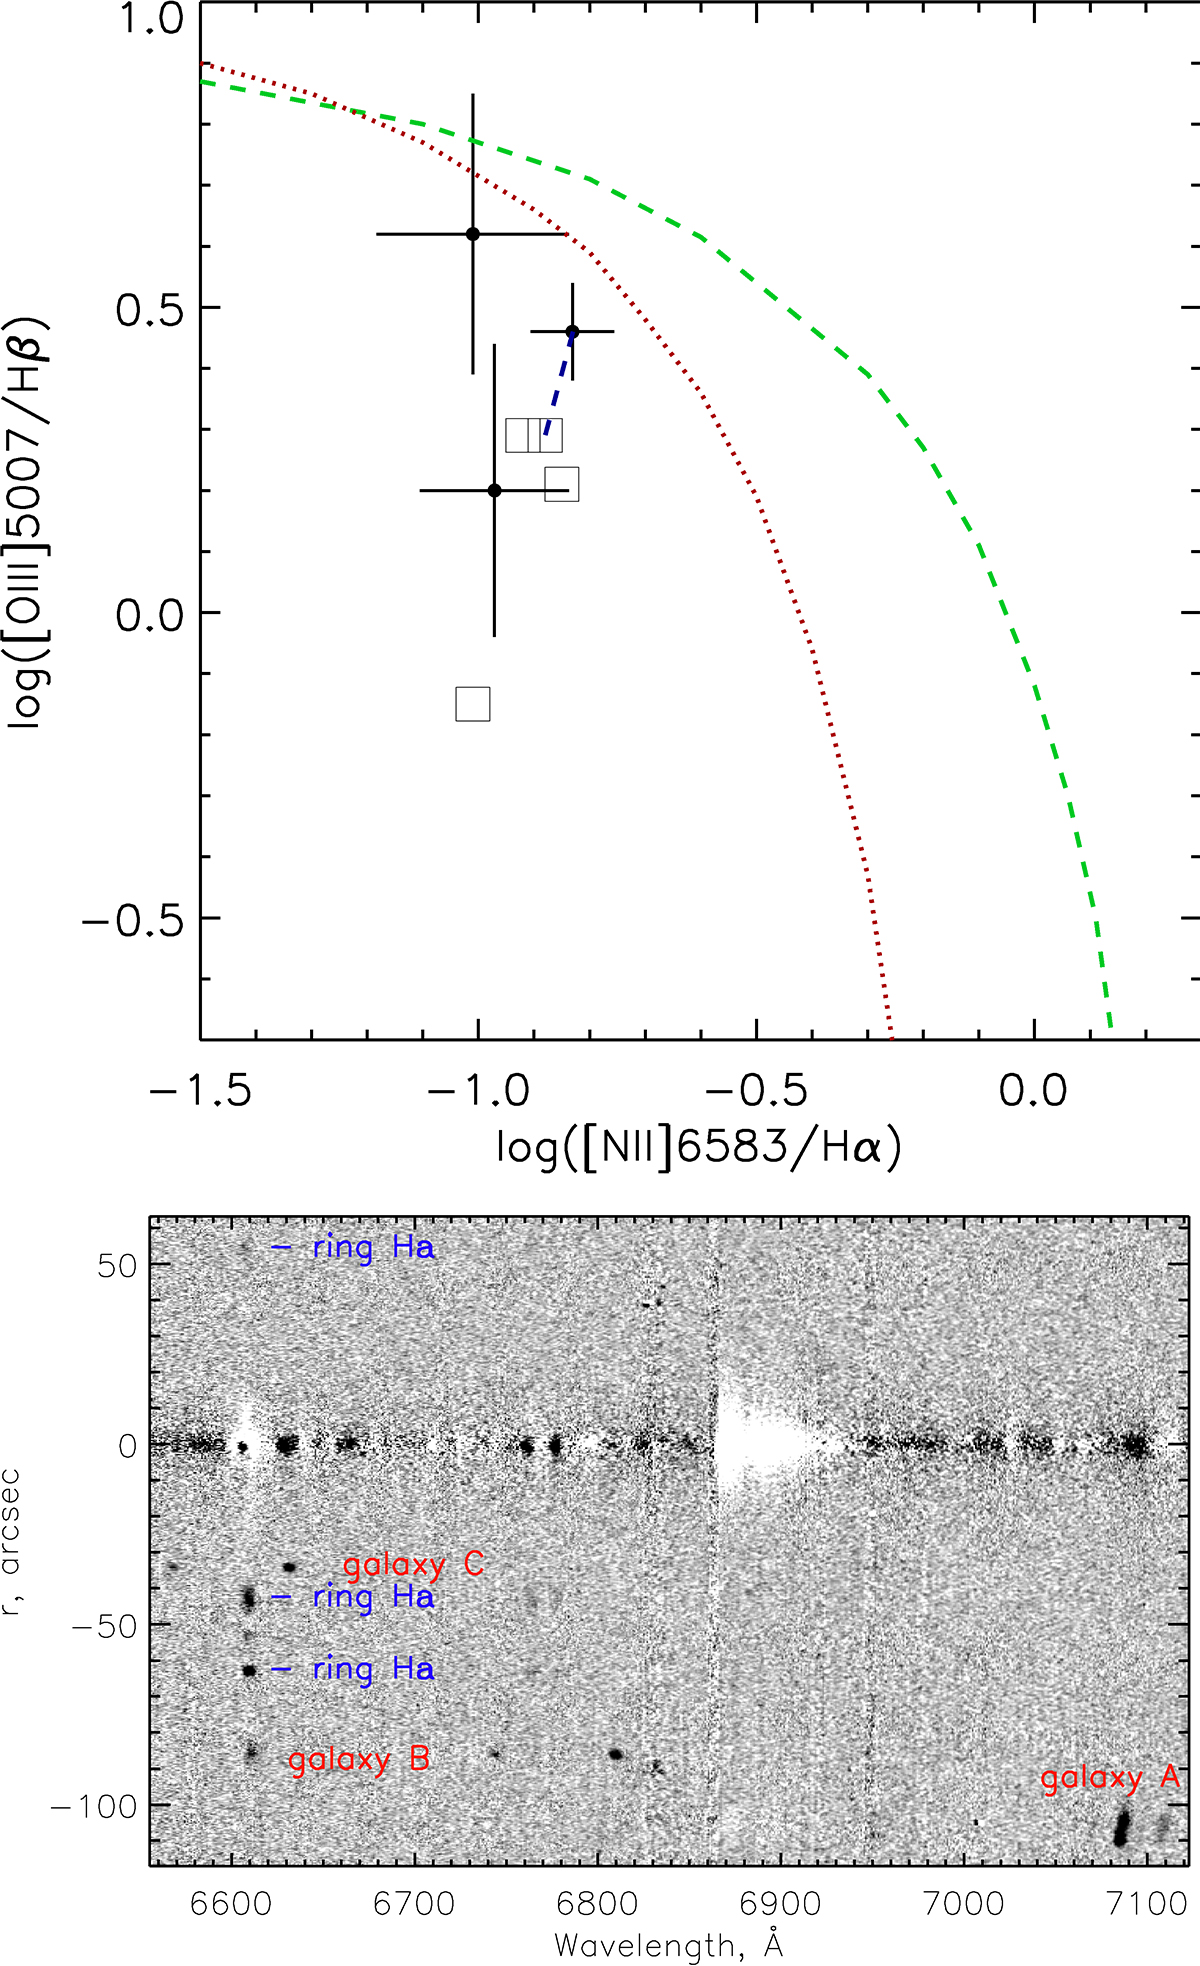
Emission lines in the ring of UGC 4599 and nearby galaxies. Upper plot: BPT-diagram for the ring HII regions, both from our long-slit spectroscopy (with error bars) and from Salzer et al. (2020) (squares). The measurements for the common HII region are connected by a dashed blue line. The lines that divide excitation mechanisms are from Kewley et al. (2001) (the dashed green line) and from Kauffmann et al. (2003) (the red dotted line). Bottom plot: view of the red part of the continuum-subtracted long-slit spectrum at PA = 132°.
Current usage metrics show cumulative count of Article Views (full-text article views including HTML views, PDF and ePub downloads, according to the available data) and Abstracts Views on Vision4Press platform.
Data correspond to usage on the plateform after 2015. The current usage metrics is available 48-96 hours after online publication and is updated daily on week days.
Initial download of the metrics may take a while.