Fig. 5.
Download original image
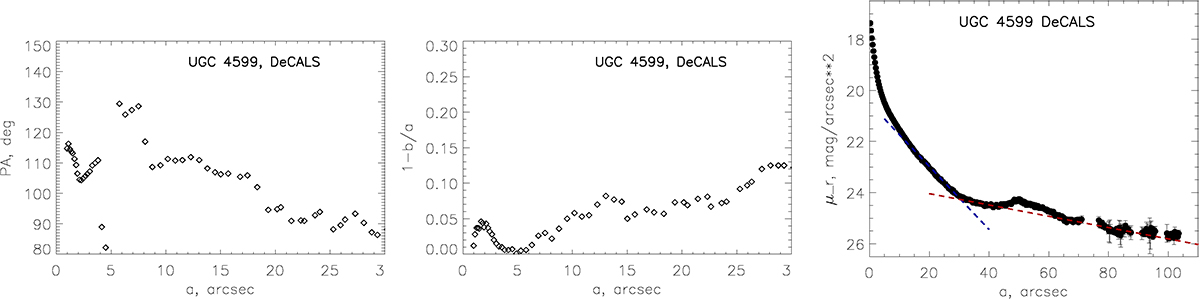
Results of the analysis of the r-band UGC 4599 image from the DECaLS survey: isophote characteristics (the left and central plot) and the azimuthally averaged surface brightness profile with the pseudo-bulge and inner disk fitted by exponential relations (the right plot). The two fitted exponential relations are: μr = 20.5 + 1.086R/8.8″ (dashed blue line) and μr = 23.6 + 1.086R/49.1″ (dashed red line).
Current usage metrics show cumulative count of Article Views (full-text article views including HTML views, PDF and ePub downloads, according to the available data) and Abstracts Views on Vision4Press platform.
Data correspond to usage on the plateform after 2015. The current usage metrics is available 48-96 hours after online publication and is updated daily on week days.
Initial download of the metrics may take a while.