| Issue |
A&A
Volume 669, January 2023
|
|
|---|---|---|
| Article Number | A31 | |
| Number of page(s) | 11 | |
| Section | Planets and planetary systems | |
| DOI | https://doi.org/10.1051/0004-6361/202244789 | |
| Published online | 03 January 2023 | |
The link between infall location, early disc size, and the fraction of self-gravitationally fragmenting discs
1
Physics Institute, University of Bern,
Gesellschaftsstrasse 6,
3012
Bern, Switzerland
e-mail: This email address is being protected from spambots. You need JavaScript enabled to view it.
2
Institute for Computational Science, Universität Zürich,
Winterthurerstrasse 190,
8057
Zürich, Switzerland
Received:
22
August
2022
Accepted:
10
November
2022
Abstract
Context. Many protoplanetary discs are self-gravitating early in their lives. If they fragment under their own gravity, they form bound gaseous clumps that can evolve to become giant planets. Today, the fraction of discs that undergo fragmentation, and therefore also the frequency of conditions that may lead to giant planet formation via gravitational instability, is still unknown.
Aims. We study the formation and evolution of a large number of star-disc systems, focusing on the early sizes of the discs and their likelihood to fragment. We investigate how the fraction of discs that fragments depends on the disc-size distribution at early times.
Methods. We performed a population synthesis of discs from formation to dispersal. Whilst varying the infall radius, we study the relationship between early disc size and fragmentation. Furthermore, we investigate how stellar accretion heating affects the fragmentation fraction.
Results. We find that discs fragment only if they become sufficiently large early in their lives. This size depends sensitively on where mass is added to the discs during the collapse of their parent molecular cloud core. Infall locations derived from pure hydrodynamic and non-ideal magnetised collapse simulations lead to large and small discs, respectively, and 22 and 0% fragmentation fractions, respectively, in populations representative of the initial mass function; however, the resulting synthetic disc size distribution is larger and smaller, respectively, than the observed Class 0 disc size distribution. By choosing intermediate infall locations, leading to a synthetic disc size distribution that is in agreement with the observed one, we find a fragmentation fraction of between 0.1 and 11%, depending on the efficiency of stellar accretion heating of the discs.
Conclusions. We conclude that the frequency of fragmentation is strongly affected by the early formation process of the disc and its interaction with the star. The early disc size is mainly determined by the infall location during the collapse of the molecular cloud core and controls the population-wide frequency of fragmentation. Stellar accretion heating also plays an important role in fragmentation and must be studied further. Our work is an observationally informed step towards a prediction of the frequency of giant planet formation by gravitational instability. Upcoming observations and theoretical studies will further our understanding of the formation and early evolution of discs in the near future. This will eventually allow us to understand how infall, disc morphology, giant planet formation via gravitational instability, and the observed extrasolar planet population are linked.
Key words: protoplanetary disks / instabilities / accretion, accretion disks / planets and satellites: formation / stars: formation
© The Authors 2023
 Open Access article, published by EDP Sciences, under the terms of the Creative Commons Attribution License (https://creativecommons.org/licenses/by/4.0), which permits unrestricted use, distribution, and reproduction in any medium, provided the original work is properly cited.
This article is published in open access under the Subscribe-to-Open model. This email address is being protected from spambots. You need JavaScript enabled to view it. to support open access publication.
1 Introduction
Protoplanetary discs are of central importance in astrophysics: they are the birth place of planets. Two main pathways for planet formation exist: core accretion (Safronov 1972; Pollack et al. 1996; Ida & Lin 2004; Mordasini et al. 2012) and gravitational instability (GI, Kuiper 1951; Cameron 1978; Boss 1997; Kratter & Lodato 2016). The latter remains the leading formation mechanism for some observed giant planets on wide orbits (Marois et al. 2008, 2010; Teague et al. 2018) and may explain the formation of giants around low-mass stars (Morales et al. 2019). GI has also been proposed for the formation of intermediate-mass planets (Deng et al. 2021) and very young giants (Currie et al. 2022; Cadman et al. 2021). Fragmentation, the collapse of parts of a protoplanetary disc to form a bound object, is a necessary condition for GI. It is still a matter of debate as to whether a bound clump formed by GI can survive to become a giant planet. The interplay among several physical processes, such as migration, accretion of gas and solids, dynamical collapse, grain sedimentation, and core formation, needs to be studied in order to answer this question (Bodenheimer et al. 1980; Helled et al. 2008; Helled & Schubert 2008; Forgan & Rice 2013; Nayakshin 2017; Forgan & Rice 2013).
While many questions around GI are still open, the first step of fragmentation has been studied extensively using 2D and 3D hydrodynamic simulations (Toomre 1964; Gammie 2001; Mayer et al. 2002; Vorobyov & Basu 2010; Baehr et al. 2017; Deng et al. 2017; Jin et al. 2020). Discs are found to be prone to fragmentation in the outer regions (tens of astronomical units (au)) if they are sufficiently cold and massive (Boss 1998, 2000; Gammie 2001; Clarke 2009; Rice et al. 2004, 2005). However, while many discs are expected to undergo a phase of gravitational instability early in their evolution (Durisen et al. 2007), the fraction of them that fragment is uncertain. Discs that are not massive enough to fragment on their own could also be triggered externally by a binary companion (Cadman et al. 2022). Gravitational instability also drives transport of angular momentum via spiral arms and discs can remain in a quasi-steady state of self-regulation (Lodato & Rice 2004; Cossins et al. 2009; Rice 2016). A better understanding of the frequency of fragmentation is important for population synthesis studies of GI as it determines the expected number of clumps. The number of clumps is in turn an upper bound for the number of planets that can form via gravitational instability. A theoretical prediction of the fragmentation fraction is therefore a necessary step towards a prediction of the frequency of planet formation via GI. This is of significant interest for comparisons with the extrasolar planet population.
Even if GI does not produce a significant number of planets, the formed clumps may still be responsible for free-floating planetary mass objects (Forgan et al. 2018) or episodic accretion (Audard et al. 2014). In previous work (Schib et al. 2021, hereafter Paper I), we performed a population synthesis of protoplanetary discs with a focus on fragmentation. We included the formation of the star-disc system by infall from the molecular cloud core (MCC), because fragmentation is most likely to occur during or shortly after disc formation where the disc-to-star mass ratio is highest. It was found that fragmentation depends sensitively on the disc-formation process. If young discs are compact, as predicted by some non-ideal magnetohydrodynamic (MHD) simulations of cloud collapse (Hennebelle et al. 2016), fragmentation is completely suppressed. If discs are large already early on, as expected from radiation hydrodynamic simulations (Bate 2018), fragmentation may be prevalent. Our comparison with observed sizes of Class 0 discs suggested that real disc sizes lie somewhere between the two extremes. This raises the question of the likelihood of discs to fragment if they have sizes that are consistent with observations. While we studied a broad parameter space in Paper I, in this paper we focus on a specific aspect: how the disc size distribution from infall affects the fraction of self-gravitationally fragmenting discs.
First, we briefly review the model. We then describe our analysis and present the results. A short discussion is then provided, followed by a summary and conclusions.
2 Model and investigated parameter space
Our model is described in detail in Paper I. We apply it without changes. The most important aspects of the model are summarised here for convenience.
The model consists of a 1D, vertically integrated gas disc around a single star. We use cylindrical polar coordinates, with r denoting the radial direction. The midplane of the disc is located at z = 0 au. The surface density Σ evolves in time t according to the viscous evolution equation (Lüst 1952 and Lynden-Bell & Pringle 1974):
![Mathematical equation: ${{\partial {\rm{\Sigma }}} \over {\partial t}} = {3 \over r}{\partial \over {\partial r}}\left[ {{r^{1/2}}{\partial \over {\partial r}}\left( {v{\rm{\Sigma }}{r^{1/2}}} \right)} \right] + S.$](/articles/aa/full_html/2023/01/aa44789-22/aa44789-22-eq1.png) (1)
(1)
S ≡ S (r, t) is a source/sink term:
 (2)
(2)
The summands describe, from left to right, the infall from the MCC, internal (Clarke et al. 2001) and external (Matsuyama et al. 2003) photoevaporation, and the removal of mass due to fragmentation. Detailed descriptions and analytical expressions are given in Paper I. We assume a short phase of infall at the beginning of our simulations. The precise implications of this assumption are difficult to assess. We discuss this further in Sect. 4. The constant infall rate is chosen based on a selection of systems from the radiation hydrodynamic simulation of star formation in Bate (2018, hereafter B18).
Our calculation of the viscosity is based on the α-prescription (Shakura & Sunyaev 1973):  , with cs the isothermal sound speed and Ω the angular frequency of the disc. We use different values for α to describe different physical processes. During the infall phase, the disc-to-star mass ratio can reach values of 0.5 or higher, and the transport of angular momentum is dominated by gravitational torques (Shu et al. 1990; Harsono et al. 2011). We use the prescription given in Eq. (32) of Kratter et al. (2010) to account for these effects. After the infall phase, the transport of angular momentum can remain very high as long as the disc is self-gravitating (Kratter et al. 2008). We use the corresponding parametrisation for the transport through spiral arms given in Zhu et al. (2010) in this case. In the absence of gravitational torques, we apply a minimal background value of 0.01 (Kimura et al. 2016), which describes any other physical process responsible for the transport of angular momentum, such as the magneto-rotational instability (MRI, Balbus & Hawley 1991), hydrodynamic instabilities, or MHD winds (Turner et al. 2014). We note that MRI is no longer considered the main source of turbulence in protoplanetary discs due to their weak ionisation (e.g. Lesur et al. 2022; Cui & Bai 2021). If the long-term evolution is indeed better described by a value of α between 10−4 and 10−3, our model would predict disc lifetimes that are much longer than those observed, as discussed in Paper I, unless photoevaporation is much stronger than we assume.
The temperature in the midplane of the disc is calculated assuming an energy balance on the surface. The following processes are considered: viscous heating, shock heating from the infall, irradiation from a constant background, and irradiation by the star. The irradiation temperature is calculated as (Hueso & Guillot 2005):
![Mathematical equation: ${T_{{\rm{irr}}}} = {T_{\rm{*}}}{\left[ {{2 \over {3\pi }}{{\left( {{{{R_*}} \over r}} \right)}^3} + {1 \over 2}{{\left( {{{{R_*}} \over r}} \right)}^2}\left( {{{\rm d\ln \left( H \right)} \over {\rm d ln\left( r \right)}} - 1} \right)} \right]^{1/4}}.$](/articles/aa/full_html/2023/01/aa44789-22/aa44789-22-eq4.png) (3)
(3)
In Eq. (3), T* and R* are the temperature and radius of the star, respectively. We set d ln(H)/d ln(r) = 9/7 for numerical reasons (Hueso & Guillot 2005). The intrinsic temperature and radius of the star are interpolated from stellar evolution tables (Yorke & Bodenheimer 2008). As the disc evolves, some of its mass crosses the inner truncation radius, which is assumed to be constant at 0.05 au. This mass is accreted onto the central star. For the majority of the simulations, we assume that half of the gravitational binding energy is radiated away, is thermalised, and heats the disc. For the total stellar luminosity L* we write (Baraffe et al. 2009; Vorobyov & Elbakyan 2018; Oliva & Kuiper 2020):
 (4)
(4)
where Lint is the intrinsic luminosity of the star and the second term is half the stellar accretion (shock) luminosity, with facc an efficiency factor, G the gravitational constant, M* the stellar mass, and  the accretion rate of disc material onto the star. The effective stellar temperature in Eq. (3) is then calculated as:
 (5)
(5)
with σ the Stefan-Boltzmann constant.
Nominally, we assume facc=1 (Baraffe et al. 2009; Kimura et al. 2016; Oliva & Kuiper 2020; Kuffmeier et al. 2018). Treating stellar irradiation this way is a strong assumption and likely an overestimate, because the accretion luminosity is absorbed or thermalised in the infalling material. We discuss this further in Sect. 4. There is also some shock heating related to material from the MCC as it reaches the disc. Our findings from the study presented in Paper I suggest that its effect is small compared to the accretion onto the star and we include it in all runs.
During the evolution of the disc, the criteria for fragmentation are checked in every time step. We use the same criteria as in Paper I. The main (necessary) condition is the Toomre criterion (Toomre 1964):
 (6)
(6)
where QToomre is the Toomre parameter and κ the epicyclic frequency. If the disc is supplied by infalling material faster than it can be transported away, it will invariably fragment when QToomre drops below unity (Boley 2009). This is called the ‘infall-dominated regime’. The condition for this regime is given in Paper I (Eq. (25). If the infall rates are not high enough, the disc transitions into the ‘cooling-dominated regime’. In this latter case, it can only fragment with sufficient cooling, which can be stated as tcool < βc (Gammie 2001), where we set the critical cooling βc to 3 (Deng et al. 2017). The cooling timescale tcool is given in Eq. (27) in Paper I.
When the disc fragments, a bound clump forms that is composed predominantly of gas. Such a clump may undergo a number of processes, such as migration, accretion, and disruption. The combined outcome of these is uncertain. In this work, we avoid this complexity and follow the approach described in Sect. 2 of Paper I: we assume the clump migrates to the inner disc quickly and accretes onto the central star. The initial fragment mass of
 (7)
(7)
(Boley et al. 2010, tough see also Forgan & Rice 2011) is removed from the disc an added to the star.
In Paper I, we performed a disc population synthesis with five runs, each of them consisting of 10 000 simulations. We varied several parameters to investigate how they affect the masses, sizes, and fragmentation of the discs. The run “hydro” (the baseline case) was set up with initial conditions extracted from results presented in the hydrodynamic simulation of star formation by Bate (2018). This includes the infall location, which was chosen to have approximately the same angular momentum as the discs modelled in Bate (2018). Based on the “hydro” run, we performed three additional runs where we varied the background viscosity, the accretion heating efficiency, and the initial fragment mass. We also performed a run where we chose a different infall location. The run “MHD” is described in more detail below. The simulations we present here were executed in an analogous fashion to the ones in Paper I: every simulation starts with a very low stellar mass and disc mass (~0.01 M⊙), is supplied with infalling material for a given length of time, and then evolves further until the disc dissolves. First, we investigated the dependency of the fragmentation fraction on the distribution of early disc size. For this, we performed a number of disc population syntheses where we varied the infall radii. A prediction for the early disc size is given in Hennebelle et al. (2016). The authors perform 3D non-ideal MHD simulations and show that the disc radii at early stages of disc formation agree within a factor of two with their analytic expression:
 (8)
(8)
In Eq. (8), A is a measure of the ambipolar diffusivity, Bz denotes the magnetic field in the inner part of the core, and M*d the combined mass of star and disc. In Paper I, we performed a run “MHD” in which the infalling material was deposited at an infall radius constant in time that lies close to the star (a few au, where the specific value depends on stellar mass). We demonstrate that the disc radii at the end of the infall phase agree well with Eq. (8) for A = 0.1 s and Bz = 0.1 G. We find that none of these discs fragment due to their small size. In Paper I, we also performed a “hydro” run, where the infall radii were taken from the (non-magnetised) radiation-hydrodynamic simulations of B18. This run produced discs of a much larger size, of which a significant fraction (22%) fragment1. Interestingly, the resulting synthetic disc radius distribution in these two runs brackets the observed disc radius distribution (Tobin et al. 2020).
For the present work we performed six new runs in total. In the first three new runs (“5× MHD”, “8× MHD”, and “12× MHD”), we subsequently increased the infall radius. We did this by multiplying the (small) infall radius from the “MHD” run from Paper I by a constant factor that differs in each of the new runs: 5, 8, and 12. A different value for the infall radius was used in the “MHD” run in each mass bin in order for the early disc radius to agree with Eq. (8). In all but the least massive system, this radius is close to 2 au. Therefore, typical values for the new runs are 10, 16 and 24 au.
In a second step, we modified the infall radii more finely in order to reproduce observed radii of Class 0 discs (run ‘OBS_IRR’). All these runs assume a full efficiency of stellar accretion heating (facc = 1). In a last step, we studied the effect of accretion heating. We performed two additional runs (‘OBS_NOIRR’ and ‘OBS_REDIRR’) with inactive (facc = 0) or reduced accretion heating (facc = 1/12). Table 1 gives an overview of the six runs performed in this work. As in Paper I, we chose the duration of the infall (the length of the constant infall phase) in such a way that the distribution of stellar masses at the end of the simulations agrees with the observed initial mass function (IMF; Chabrier 2005). A figure demonstrating this can be found in Appendix A. It shows the stellar number density in pc−3 per logarithmic interval of mass for all the runs performed in this work. The agreement is reasonable for all runs across the parameter space studied from 0.05 M⊙ to 5 M⊙. In order to compensate for the decreasing number density towards high masses, we divided this parameter space into 100 logarithmically spaced mass bins and set up our simulations in such a way that we obtain approximately 100 systems with a final stellar mass lying in each bin. This ensures our statistics are reasonably robust across the entire mass range.
Overview of the runs.
An overview of the results.
3 Results
In this section, we present the results of our simulations. First, we discuss how different infall radii influence the early disc sizes, and then we concentrate on the influence of stellar accretion heating on discs with similar early disc sizes.
An overview of the results for all six runs is given in Table 2. The numbers shown represent weighted mean values calculated assuming that the final distribution of stellar masses agrees with the IMF. The disc sizes increase from run “5× MHD” to “12× MHD” as expected, while they remain the same for the remaining runs, as further discussed in Sect. 3.1. The fragmentation fractions change significantly for different runs as discussed in Sects. 3.1–3.3. On the contrary, disc masses and lifetimes are very similar. We discuss these in Appendix A.
3.1 Infall radii and early disc radii
Figure 1 depicts the disc radii of the first three runs – measured at the end of the infall phase – as cumulative distributions. The disc radius is defined as the radius containing 63.2% of the mass of the disc (B18). The figure also shows the observational result from Tobin et al. (2020). These latter authors perform a multi-wavelength survey of hundreds of protostars and use dust continuum emission to measure Class 0 dust disc radii. During this early phase, the gas disc radii should not yet differ very much from those obtained from continuum emission (Birnstiel & Andrews 2014; B18). Nevertheless, this is a clear limitation of our study and we discuss this further in Sect. 4.
Figure 1 shows that runs 1–3 cover a region of parameter space much closer to observed disc radii than the “hydro” and “MHD” runs that we performed in Paper I. It is therefore interesting to check which of these systems fragment. The region in a disc prone to fragmentation is typically outside of ~50 au. There, run “5× MHD” has radii at the lower end of the observed population, run “8× MHD” is roughly in agreement, and run “12× MHD” exhibits larger radii. This increase in disc size is reflected in an increasing fragmentation fraction: we find that in run “5× MHD”, none of the systems fragment. For run “8× MHD”, we find 0.19% of systems fragment, while in run “12× MHD” the fraction of fragmenting systems is 3.5%. These values are computed by weighting the different mass bins such that the final stellar masses are consistent with the IMF.
Taken at face value, this puts the observed disc radii right at the edge of fragmentation, with only about 2 out of 1000 discs fragmenting. This would imply that a necessary condition for giant planet formation via gravitational instability is only very rarely met (but also not never). However, the observed distribution of radii has a different, broader shape in comparison to our syntheses.
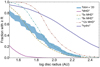 |
Fig. 1 Cumulative distributions of the disc radii at the end of the infall phase for runs “5× MHD”, “8× MHD” and “12× MHD”. The runs “MHD” and “hydro” from Paper I are shown for reference. The blue shaded region shows the sizes of observed Class 0 discs for systems in isolation from Tobin et al. (2020). |
3.2 Agreement with observed radii
The different shapes of the size distributions discussed raise the question of whether a synthetic population of discs with a distribution of radii in (better) agreement with observations can also be simulated. This is not straightforward, because there is no simple relationship between the infall radius and the early disc radius. The radius of the disc changes with time through the evolution of the disc and this effect depends on the mass of the disc. In Sect. 2, we describe how our simulations are distributed in different mass bins. More massive systems tend to produce larger discs in our model. Such a correlation is also seen in the hydro-dynamic simulations of Bate (2018) as well as in observed discs (Tobin et al. 2020); it is also expected from Eq. (8). Increasing the infall radii in the bins corresponding to higher masses would therefore lead to a broader distribution of radii. Of course, for such a modified set of initial conditions, the infall times need to be adapted again in order to satisfy the requirement to fit the IMF (Sect. 2), which would affect the distribution of radii. After iterations, we infer the distribution of infall radii that satisfies both constraints at the same time (run OBS_IRR). The resulting distribution of radii is shown in Fig. 2 (orange solid line). The fraction of discs fragmenting in run OBS_IRR is 0.12%, similar to run “8× MHD”. This is expected as these two runs have a very similar distribution of radii above 80 au, where fragmentation is most likely. If this result is robust, it means that fragmentation is very rare indeed, independently of subtleties in the disc radius distribution.
3.3 Irradiation from stellar accretion heating
Next we revisit our assumption concerning stellar accretion (shock) heating. If this effect is indeed overestimated by our treatment as mentioned in Sect. 2 and discussed below, this would lead to too high temperatures in the outer discs and inhibit fragmentation through Eq. (6). We tested this hypothesis by setting as a limiting case the second summand in Eq. (4) to zero (facc = 0), effectively reducing the irradiation to the intrinsic luminosity of the star. We then constructed a new set of initial conditions that again satisfies the constraints in stellar mass and disc radius: run OBS_NOIRR. This run is also shown in Fig. 2. In run OBS_NOIRR, a high fraction of 25% of the systems fragment, demonstrating the strong influence of accretion heating on fragmentation besides disc size. The assumptions about accretion heating made in runs OBS_IRR (facc = 1) and OBS_NOIRR (facc = 0) are likely extremes. However, the former case appears clearly more likely than the latter, because there are direct observations (Cieza et al. 2016) that the high stellar luminosity during episodes of strong accretion shifts the water iceline to large orbital distance, implying that facc must be larger than zero. We discuss this in more detail in Sect. 4.
Figure 3 shows the stellar luminosities at the end of the infall phase together with the observed luminosities of isolated Class 0 protostars (Tobin et al. 2020). The figure shows first that a very large range in luminosities is covered. Second, we note that the synthetic luminosity distributions when including only the intrinsic luminosity (facc = 0) or when considering the sum of intrinsic and full accretion luminosity facc = 1) are bracketing the observed luminosity distribution. This suggests that we should consider an intermediate value for facc. In run OBS_REDIRR, we therefore assess a scenario with such a reduced accretion heating. To roughly reproduce the observed luminosity distribution, we find that the accretion term (second summand in Eq. (4)) needs to be reduced by about a factor of 12, that is, facc = 1/12. Again we chose infall radii and infall times in such a way that the constraints from both disc sizes and final lead are satisfied. The fraction of systems that fragment is 11% in run OBS_REDIRR. This fragmentation fraction lies between what we found for runs OBS_IRR (facc = 1, 0.12% fragmentation) and OBS_NOIRR (facc = 0, 25% fragmentation) as expected: fragmentation is reduced less than in run OBS_IRR because the discs are not as strongly heated and are therefore stabilised. The number is also interesting in another context: the frequency of substellar companions on wide orbits, which might have formed via gravitational instability, is on the order of a few to a few tens of percent (Vigan et al. 2021).
Even though our approach to fitting the luminosity distribution is simplistic, run OBS_REDIRR is still our most realistic, observationally informed scenario; it satisfies the constraints from observed stellar masses and disc sizes while also exhibiting luminosities in the same range as those observed. We discuss some limitations of our study in the following section. In Appendix A we show additional results for runs OBS_IRR, OBS_NOIRR and OBS_REDIRR: early disc masses, final stellar masses, and disc lifetimes of these systems. The infall radii used in these runs are given in Appendix B, the infall times in Appendix C.
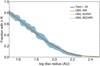 |
Fig. 2 Cumulative distributions of the disc radii at the end of the infall phase for runs OBS_IRR, OBS_NOIRR, and OBS_REDIRR together with observed radii. |
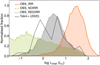 |
Fig. 3 Total luminosities (intrinsic and accretion) at the end of the infall phase for runs OBS_IRR, OBS_NOIRR, and OBS_REDIRR. The black solid line shows observed luminosities of isolated Class 0 protostars from Tobin et al. (2020). |
Fragment properties for runs OBS_IRR, OBS_NOIRR and OBS_REDIRR.
3.4 Fragmentation
The likelihood that the disc will fragment and the location of the instability depend on the evolution of the surface density and temperature of the disc. Table 3 gives an overview of the most important properties for our runs OBS_NOIRR and OBS_REDIRR. Figure 4 shows the fraction of fragmenting discs as a function of final stellar mass as well as the mean values of the number, location, and mass of the fragments. The top left panel reveals that fragmentation only becomes important for systems with a final stellar mass ≳0.3 M⊙, with typical values of ~40% in run OBS_REDIRR and ~90% in run OBSNOIRR. The fraction decreases slightly for final stellar masses above 3M⊙. This was not seen in Paper I and is a consequence of the different choice of infall radii. Interestingly, a similar trend is found in radial velocity surveys. An increase in giant planet occurrence rate with host star mass is found up to a host star mass of 1.9 M⊙ with a decline at higher host masses (e.g. Reffert et al. 2015). It is still unclear whether the trend in fragmentation fractions persists in fully formed giant planets. Also, it is still unknown whether a similar decrease at higher stellar masses exists in directly imaged planets, because of insufficient detections at higher stellar masses (Vigan et al. 2021, see also Janson et al. 2021; Wagner et al. 2022). The top right panel of Fig. 4 shows that the number of fragments depends strongly on irradiation. While the runs with accretion heating of the outer disc (OBSJRR and OBS_REDIRR) typically have around ten fragments, this number is larger without accretion heating and can lead to more than a hundred fragments. The number of fragments in runs OBSJRR and OBS_REDIRR is less than half of what we found for the run “hydro” in Paper I. This is a consequence of the more compact discs.
The location where the discs fragment (bottom left panel in Fig. 4) depends mainly on the accretion heating: the hotter the outer discs are, the further out they fragment, in agreement with Paper I.
The initial fragment mass (bottom right panel) is influenced both by the location of fragmentation and the accretion heating. More accretion heating means higher temperatures in the outer disc, which leads to more massive fragments through Eq. (7) directly; this also leads to more massive fragments indirectly by moving the location of fragmentation further out, which is in good agreement with what was found in Paper I. Run OBS_REDIRR features quite low initial fragment masses, typically 0.5 MJ−1MJ.
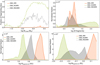 |
Fig. 4 Results related to fragmentation for runs OBS_IRR, OBS_NOIRR, and OBS_REDIRR. Top left: fraction of fragmenting discs as a function of final stellar mass. Top right: mean number of fragments (for systems that do fragment). Bottom left: location where the discs fragment. Bottom right: initial fragment masses. |
4 Discussion
In our analysis, we had to make several strong assumptions due to theoretical and observational uncertainties. Here, we discuss how these may influence our results.
The most important assumption is the comparability of gas and dust disc radii. For older discs, such as those in Class II, this would certainly not be justified, as dust would have had time to grow and drift (Birnstiel et al. 2010; Testi et al. 2014; Tobin et al. 2020). As we compare the sizes of young discs (Class 0), the differences are expected to be smaller. However, it is still possible that there is a mismatch between observed Class 0 dust disc sizes and the sizes of the corresponding gas discs in both directions.
The definition of the disc radius used in this work (63.2 % of the mass) is identical to that used in Bate (2018). It is well suited for comparisons with observations of discs with truncated power-law surface density profiles Σ ∝ r−γ, independently of the index γ (as long as γ < 2, see the discussion in Sect. 2.3.1 in Bate 2018). For our comparison, we evaluate the disc radii at a well-defined point in time: the end of the infall phase. If this coincides with the end of the Class 0 phase, this means we overestimate the disc sizes, because the observed discs are expected to represent an (unknown) distribution of Class 0 ages. If, on the contrary, the Class 0 phase lasts longer than our infall phase and the discs have more time to spread, or if the size of the observed gas disc is smaller due to growth or drift of dust particles, this would make our discs too small. Based on our discussion in Sect. 3, an overestimate of the disc sizes would lead to an overestimate of the fraction of discs that fragment. Conversely, if our discs are too small, we are likely to underestimate the occurrence rate of fragmentation.
Our results indicate that only a minority of discs undergo fragmentation. However, this does not mean that gravitational instabilities are not important in the non-fragmenting bulk of the population. Most of the discs in run OBS_REDIRR have QToomre < 2 somewhere, at some point during their evolution. This suggests that these discs were self-gravitating for at least a short period during their early lives.
In comparing the size distribution of our full sample with the sample from Tobin et al. (2020) we also implicitly assume that the sample of these latter authors will be representative of the IMF. Unfortunately, it is very difficult to measure stellar masses of such young systems, and the precise distribution of the stellar masses of the observed sample is unknown. The observed luminosities cannot be translated into masses directly due to accretion. Our comparison of luminosities with and without accretion (Fig. 3) demonstrates the potential extent of this discrepancy: the total luminosities in our run OBS_IRR are higher by more than an order of magnitude than observations, which are again much higher than our intrinsic luminosities. This could be explained in part by a different distribution of masses in the observed sample. Our populations have a stellar mass distribution as in the Chabrier (2005) IMF. However, a different ΓMF dominated by less massive stars may be more adequate for the Orion region (Da Rio et al. 2012; see also Luhman 2000). The difference could also be caused by the way the stars accrete. The difference between observed and theoretically expected luminosities has long been discussed and is historically known as the protostellar luminosity problem (Kenyon et al. 1990). This apparent problem has been solved by demonstrating that both episodic accretion and a longer accretion phase can produce luminosities that are in line with observations (e.g. Offner & McKee 2011; Dunham & Vorobyov 2012).
The precise manner in which accretion happens is still not fully understood. Also, the degree to which the two proposed mechanisms described above contribute to the explanation of the ‘protostellar luminosity spread’ is still unknown (Sect. 3 in Fischer et al. 2022). It is therefore unclear how our assumption of a phase of constant accretion should be modified in order to account for the observed luminosity spread. This is an important topic that needs to be studied further. The exact nature of accretion affects the stellar evolution, and therefore also disc fragmentation. A study that assesses the interplay between episodic accretion and stellar evolution in a 3D MHD simulation is presented by Kuffmeier et al. (2018).
Finally, we also assumed that once the disc fragments, a clump of a given mass MF (Eq. (7)) forms, migrates inwards quickly, and accretes onto the star. While this work does not focus on the fate of the clumps, it should be noted that our simplifying assumptions could influence the evolution of the disc and its fragmentation at later stages. While MF is the mass of the initial clump, it could be significantly different from the mass accreted onto the star and/or the final mass of the surviving clump. The mass of the clump is expected to decrease via mass loss (e.g. tidal disruption in the inner disc; Boley et al. 2010; Nayakshin 2010). The forming clump could also grow in mass via further accretion of disc gas, bringing it into the brown dwarf or stellar mass regime. If gas accretion is rapid, a gap may form which would slow down migration (D’Angelo & Lubow 2008; Rowther & Meru 2020; Zhu et al. 2012; Oliva & Kuiper 2020; Schib et al. 2022). A deep gap could reduce gas flow to the inner disc and make the outer disc prone to further fragmentation.
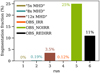 |
Fig. 5 Fraction of discs that fragment for all the runs studied. Each run consists of 10 000 simulations and the results are representative of a distribution of final masses in agreement with the IMF. The most realistic scenario is run OBS_REDIRR, where the stellar shock luminosity is scaled to agree with observed luminosities of Class 0 protostars. |
5 Summary, conclusions, and outlook
We performed a population synthesis of protoplanetary discs focusing on disc sizes and the fragmentation likelihood. In three sets of initial simulations (runs “5× MHD”, “8× MHD” and “12× MHD”), we demonstrate how increasing the infall radii controls the fragmentation of protoplanetary discs. We then constructed initial conditions (infall locations) in such a way that the synthetic disc radius distribution at the end of the infall phase agrees with the observed radius distribution of Class 0 discs, while the distribution of stellar masses at the end of our simulations agrees with the IMF (runs OBSJRR, OBS_NOIRR and OBS_REDIRR). For these three runs, we also investigated how fragmentation is influenced by accretion heating. Our most important results are summarised in Fig. 5. Our key conclusions can be summarised as follows:
Protoplanetary discs need to reach a certain size while they are massive in order to fragment. Observed discs appear to have radii just large enough to fragment in a few cases.
The early disc size distribution is mainly determined by the infall location. To get a synthetic size distribution that is in agreement with the observed one, we find infall locations that are between those predicted by some magnetised and pure hydrodynamic star formation simulations. Specifically, the infall locations need to be increased by factors of 5–8 relative to the MHD simulations of Hennebelle et al. (2016) which corresponds to a reduction by factors of 2–3 relative to pure HD simulations B18.
However, the fraction of discs that actually fragments not only depends on their early sizes, but also on the frequency with which stellar accretional (shock) luminosity contributes to heating the outer disc facc.
In disc population syntheses fitting the observed Class 0 disc radius distribution, we find fragmentation fractions of 0.12 and 25% for the limiting cases of facc = 1 and 0, respectively. Here, the former scenario is more likely than the latter, because heating of discs by stellar accretion luminosity is an observed phenomenon Cieza et al. (2016).
Finally, in our most realistic case, we empirically determine facc ≈ 1/12 by requiring that our synthetic luminosity distribution be in approximate agreement with the observed luminosity distribution of Class 0 protostars (while still also fitting the observed disc radius distribution). In this case, the fragmentation fraction is 11%, which is our observationally informed best estimate of the fraction.
A better understanding of accretion is crucial for understanding the evolution of protoplanetary discs and the formation of planets. This phenomenon needs to be investigated further using simulations of discs with an evolving dust component, including radiative transport, and evolution models of accreting stars.
The discovery of AB Aurigae b (Currie et al. 2022) as a massive, still actively accreting giant planet at a large orbital distance of 93 au has recently given observational support to gravitational instability as a giant planet formation mechanism. However, the frequency with which GI leads to giant planet formation is still unknown. Qualitatively, it is often assumed to be a rather rare process (Vigan et al. 2021), but quantitative theoretical predictions are currently sparse.
A necessary condition for giant planet formation is disc fragmentation. The fragmentation fractions of about 0.1 to 11% that we find in this work are therefore an upper bound for the frequency of giant planet formation via GI. Our work represents a step towards a quantitative theoretical prediction of the importance of GI as a giant planet formation mechanism.
Future work promises to help in our understanding of the formation and evolution of stars, discs, and planets. Simulations of star formation are becoming increasingly detailed, allowing for a more precise treatment of the interaction between stars and discs (Jensen & Haugb0lle 2018; Kuiper & Hosokawa 2018). The study of disc kinematics continues to improve our understanding of the mass distribution and motion of the gas in the outer discs and the presence of structures and embedded protoplanets (Teague et al. 2019; Pinte et al. 2020; Terry et al. 2022). Observations of the gas emission of discs may help to constrain young disc sizes in the near future (e.g. Rota et al. 2022). Finally, exoplanet surveys continue to improve our understanding of the demographics of planets, including, in particular, distant and forming planets, which are prime candidates for a formation via GI (Marois et al. 2008; Chauvin et al. 2017; Currie et al. 2022). Such progress will eventually allow us to understand how star formation, infall, disc morphology, giant planet formation via gravitational instability, and the observed extrasolar planet population are connected.
Acknowledgements
We thank the anonymous referee for valuable comments. We also thank Til Birnstiel, Rolf Kuiper and Lucio Mayer for the insightful discussions. The authors acknowledge the financial support of the SNSF. O.S. and C.M. acknowledge the support from the Swiss National Science Foundation under grant 200021_204847 “PlanetsInTime”. R.H. acknowledges support from SNSF grant 200020_188460. Parts of this work has been carried out within the framework of the NCCR PlanetS supported by the Swiss National Science Foundation under grants 51NF40_182981 and 51NF40_205606.
Appendix A Properties of runs OBS_IRR, OBS_NOIRR, and OBS_REDIRR
Here we show some additional results for runs OBS_IRR, OBS_NOIRR, and OBS_REDIRR. This can be useful when comparing these runs to the ones from Paper I or other studies. An overview of these results is given in Table 2. Fig. A.1 depicts the distributions of stellar masses at the end of the simulations (i.e. when the disc is gone). It shows that the agreement with the IMF is reasonable for all runs. In Fig. A.2 we show the distribution of disc masses at the end of the infall phase. Also shown is the observational result from Tychoniec et al. (2018). The masses are similar for runs OBS_IRR, OBS_NOIRR and OBS_REDIRR. They are comparable, tough somewhat larger than the observed Class 0 masses. Systems with less accretion heating are slightly less massive. This result may seem counterintuitive, because lower disc temperatures should lead to less accretion to the star and therfore more massive discs. However, the infall radii in the less massive (and more abundant) systems are lower for systems with less accretion heating. Therefore more gas is accreted on the star early, which explains the lower masses. Figure A.3 depicts the disc fractions based on the reduced near-infrared lifetimes tlife. It shows excellent agreement with the disc fractions based on the fits from Richert et al. (2018), when the ‘magnetic’ pre main sequence (PMS) model from Feiden (2016) is used to determine cluster ages. The reduction is based on the beginning of PMS (Kimura et al. 2016). We note that there is substantial uncertainty involved when comparing disc lifetimes from simulations to observed disc fractions. A detailed discussion of this is found in Sect. 6.3 of Paper I.
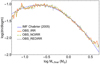 |
Fig. A.1 Stellar masses at the end of the simulation for runs OBS_IRR, OBS_NOIRR and OBS_REDIRR, compared to the Chabrier (2005) IMF. |
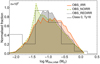 |
Fig. A.2 Disc masses at the end of the infall phase for runs OBS_IRR, OBS_NOIRR and OBS_REDIRR, compared to observed Class 0 discs. |
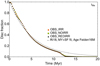 |
Fig. A.3 Disc fractions based on reduced disc lifetimes as a function of time for runs OBS_IRR, OBS_NOIRR and OBS_RDIRR compared to a fit to observed disc fractions (Richert et al. 2018). |
Appendix B Infall radii
In Sect. 2 we describe how we vary the infall radii (the locations, where the infalling material from the MCC is deposited in the disc). Figure B.1 displays the radii chosen for runs OBS_IRR, OBS_NOIRR and OBS_REDIRR for reference. A reduction of the accretion heating means the infall radii need to be reduced in bins with lower index (corresponding to smaller, less massive systems) and increased in the systems with higher index. The definitions of the bins is given in Table D.1 of Paper I.
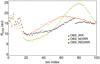 |
Fig. B.1 Infall radii for OBS_IRR, OBS_NOIRR and OBS_REDIRR. |
Appendix C Infall times
The infall times (duration of the infall phase) need to be varied slightly from run to run in order for the finall stellar masses to agree with the IMF. The distributions used in runs OBS_IRR, OBS_NOIRR and OBS_REDIRR are shown in Fig. C.1. They should be compared to the bottom right panel of Fig. E.1 in Paper I. The distributions shown in Fig. C.1 are kernel density estimates from which the infall time for each system is drawn. The same is done for the initial values for the stellar mass, disc mass and infall rate. In contrast to the infall times, the distributions for the other initial values are identical to what is used in Paper I and are given there (Appendix E).
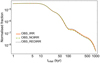 |
Fig. C.1 Infall times for runs OBS_IRR, OBS_NOIRR, and OBS_REDIRR. |
References
- Audard, M., Ábrahám, P., Dunham, M., et al. 2014, in Protostars and Planets VI, eds. H. Beuther, R. S. Klessen, C. P. Dullemond, & T. Henning (Tucson: University of Arizona Press), 387 [Google Scholar]
- Baehr, H., Klahr, H., & Kratter, K. M. 2017, ApJ, 848, 40 [Google Scholar]
- Balbus, S. A., & Hawley, J. F. 1991, ApJ, 376, 214 [Google Scholar]
- Baraffe, I., Chabrier, G., & Gallardo, J. 2009, ApJ, 702, L27 [NASA ADS] [CrossRef] [Google Scholar]
- Bate, M. R. 2018, MNRAS, 475, 5618 [Google Scholar]
- Birnstiel, T., & Andrews, S. M. 2014, ApJ, 780, 153 [Google Scholar]
- Birnstiel, T., Dullemond, C., & Brauer, F. 2010, A&A, 513, A79 [NASA ADS] [CrossRef] [EDP Sciences] [Google Scholar]
- Bodenheimer, P., Grossman, A. S., DeCampli, W. M., Marcy, G., & Pollack, J. B. 1980, Icarus, 41, 293 [NASA ADS] [CrossRef] [Google Scholar]
- Boley, A. C. 2009, ApJ, 695, L53 [NASA ADS] [CrossRef] [Google Scholar]
- Boley, A. C., Hayfield, T., Mayer, L., & Durisen, R. H. 2010, Icarus, 207, 509 [Google Scholar]
- Boss, A. 1997, Science, 276, 1836 [NASA ADS] [CrossRef] [Google Scholar]
- Boss, A. P. 1998, ApJ, 503, 923 [Google Scholar]
- Boss, A. P. 2000, ApJ, 536, L101 [CrossRef] [Google Scholar]
- Cadman, J., Rice, K., & Hall, C. 2021, MNRAS, 504, 2877 [NASA ADS] [CrossRef] [Google Scholar]
- Cadman, J., Hall, C., Fontanive, C., & Rice, K. 2022, MNRAS, 511, 457 [NASA ADS] [CrossRef] [Google Scholar]
- Cameron, A. A. 1978, Moon Planets, 18, 5 [NASA ADS] [CrossRef] [Google Scholar]
- Chabrier, G. 2005, The Initial Mass Function: From Salpeter 1955 to 2005 (Berlin: Springer), 327, 41 [NASA ADS] [Google Scholar]
- Chauvin, G., Desidera, S., Lagrange, A. M., et al. 2017, A&A, 605, L9 [NASA ADS] [CrossRef] [EDP Sciences] [Google Scholar]
- Cieza, L. A., Casassus, S., Tobin, J., et al. 2016, Nature, 535, 258 [Google Scholar]
- Clarke, C. J. 2009, MNRAS, 396, 1066 [Google Scholar]
- Clarke, C., Gendrin, A., & Sotomayor, M. 2001, MNRAS, 328, 485 [NASA ADS] [CrossRef] [Google Scholar]
- Cossins, P., Lodato, G., & Clarke, C. J. 2009, MNRAS, 393, 1157 [Google Scholar]
- Cui, C., & Bai, X.-N. 2021, MNRAS, 507, 1106 [NASA ADS] [CrossRef] [Google Scholar]
- Currie, T., Lawson, K., Schneider, G., et al. 2022, Nat. Astron., 6, 751 [NASA ADS] [CrossRef] [Google Scholar]
- Da Rio, N., Robberto, M., Hillenbrand, L., Henning, T., & Stassun, K. 2012, ApJ, 748, 14 [NASA ADS] [CrossRef] [Google Scholar]
- D’Angelo, G., & Lubow, S. H. 2008, ApJ, 685, 560 [CrossRef] [Google Scholar]
- Deng, H., Mayer, L., & Meru, F. 2017, ApJ, 847, 43 [NASA ADS] [CrossRef] [Google Scholar]
- Deng, H., Mayer, L., & Helled, R. 2021, Nat. Astron., 5, 440 [NASA ADS] [CrossRef] [Google Scholar]
- Dunham, M. M., & Vorobyov, E. I. 2012, ApJ, 747, 52 [NASA ADS] [CrossRef] [Google Scholar]
- Durisen, R., Boss, A., Mayer, L., et al. 2007 Protostars and Planets V, eds. B. Reipurth, D. Jewitt, & K. Keil, (University of Arizona Press: Tucson), 951, 607 [NASA ADS] [Google Scholar]
- Feiden, G. A. 2016, A&A, 593, A99 [NASA ADS] [CrossRef] [EDP Sciences] [Google Scholar]
- Fischer, W. J., Hillenbrand, L. A., Herczeg, G. J., et al. 2022, ArXiv e-prints [arXiv:2203.11257] [Google Scholar]
- Forgan, D., & Rice, K. 2011, MNRAS, 417, 1928 [NASA ADS] [CrossRef] [Google Scholar]
- Forgan, D., & Rice, K. 2013, MNRAS, 432, 3168 [Google Scholar]
- Forgan, D., Hall, C., Meru, F., & Rice, W. 2018, MNRAS, 474, 5036 [NASA ADS] [CrossRef] [Google Scholar]
- Gammie, C. F. 2001, ApJ, 553, 174 [Google Scholar]
- Harsono, D., Alexander, R., & Levin, Y. 2011, MNRAS, 413, 423 [NASA ADS] [CrossRef] [Google Scholar]
- Helled, R., & Schubert, G. 2008, Icarus, 198, 156 [NASA ADS] [CrossRef] [Google Scholar]
- Helled, R., Podolak, M., & Kovetz, A. 2008, Icarus, 195, 863 [NASA ADS] [CrossRef] [Google Scholar]
- Hennebelle, P., Commerçon, B., Chabrier, G., & Marchand, P. 2016, ApJ, 830, L8 [Google Scholar]
- Hueso, R., & Guillot, T. 2005, A&A, 442, 703 [NASA ADS] [CrossRef] [EDP Sciences] [Google Scholar]
- Ida, S., & Lin, D. 2004, ApJ, 604, 388 [NASA ADS] [CrossRef] [Google Scholar]
- Janson, M., Squicciarini, V., Delorme, P., et al. 2021, A&A, 646, A164 [NASA ADS] [CrossRef] [EDP Sciences] [Google Scholar]
- Jensen, S. S., & Haugbølle, T. 2018, MNRAS, 474, 1176 [Google Scholar]
- Jin, L., Liu, F., Jiang, T., Tang, P., & Yang, J. 2020, ApJ, 904, 55 [NASA ADS] [CrossRef] [Google Scholar]
- Kenyon, S. J., Hartmann, L. W., Strom, K. M., & Strom, S. E. 1990, AJ, 99, 869 [Google Scholar]
- Kimura, S. S., Kunitomo, M., & Takahashi, S. Z. 2016, MNRAS, 461, 2257 [NASA ADS] [CrossRef] [Google Scholar]
- Kratter, K., & Lodato, G. 2016, Annu. Rev. Astron. Astrophys., 54, 271 [CrossRef] [Google Scholar]
- Kratter, K. M., Matzner, C. D., & Krumholz, M. R. 2008, ApJ, 681, 375 [NASA ADS] [CrossRef] [Google Scholar]
- Kratter, K. M., Matzner, C. D., Krumholz, M. R., & Klein, R. I. 2010, ApJ, 708, 1585 [NASA ADS] [CrossRef] [Google Scholar]
- Kuffmeier, M., Frimann, S., Jensen, S. S., & Haugbølle, T. 2018, MNRAS, 475, 2642 [NASA ADS] [CrossRef] [Google Scholar]
- Kuiper, G. P. 1951, Proc. Natl. Acad. Sci., 37, 1 [Google Scholar]
- Kuiper, R., & Hosokawa, T. 2018, A&A, 616, A101 [NASA ADS] [CrossRef] [EDP Sciences] [Google Scholar]
- Lesur, G., Ercolano, B., Flock, M., et al. 2022, ArXiv e-prints [arXiv:2203.09821] [Google Scholar]
- Lodato, G., & Rice, W. 2004, MNRAS, 351, 630 [NASA ADS] [CrossRef] [Google Scholar]
- Luhman, K. 2000, ApJ, 544, 1044 [NASA ADS] [CrossRef] [Google Scholar]
- Lüst, R. 1952, Zeitschrift Naturforschung Teil A, 7, 87 [CrossRef] [Google Scholar]
- Lynden-Bell, D., & Pringle, J. 1974, MNRAS, 168, 603 [Google Scholar]
- Marois, C., Macintosh, B., Barman, T., et al. 2008, Science, 322, 1348 [Google Scholar]
- Marois, C., Zuckerman, B., Konopacky, Q. M., Macintosh, B., & Barman, T. 2010, Nature, 468, 1080 [NASA ADS] [CrossRef] [Google Scholar]
- Matsuyama, I., Johnstone, D., & Hartmann, L. 2003, ApJ, 582, 893 [NASA ADS] [CrossRef] [Google Scholar]
- Mayer, L., Quinn, T., Wadsley, J., & Stadel, J. 2002, Science, 298, 1756 [NASA ADS] [CrossRef] [Google Scholar]
- Morales, J., Mustill, A., Ribas, I., et al. 2019, Science, 365, 1441 [NASA ADS] [CrossRef] [Google Scholar]
- Mordasini, C., Alibert, Y., Benz, W., Klahr, H., & Henning, T. 2012, A&A, 541, 97 [Google Scholar]
- Nayakshin, S. 2010, MNRAS, 408, L36 [NASA ADS] [CrossRef] [Google Scholar]
- Nayakshin, S. 2017, PASA, 34, e002 [NASA ADS] [CrossRef] [Google Scholar]
- Offner, S. S., & McKee, C. F. 2011, ApJ, 736, 53 [NASA ADS] [CrossRef] [Google Scholar]
- Oliva, G. A., & Kuiper, R. 2020, A&A, 644, A41 [NASA ADS] [CrossRef] [EDP Sciences] [Google Scholar]
- Pinte, C., Price, D., Ménard, F., et al. 2020, ApJ, 890, L9 [CrossRef] [Google Scholar]
- Pollack, J. B., Hubickyj, O., Bodenheimer, P., et al. 1996, Icarus, 124, 62 [NASA ADS] [CrossRef] [Google Scholar]
- Reffert, S., Bergmann, C., Quirrenbach, A., Trifonov, T., & Künstler, A. 2015, A&A, 574, A116 [NASA ADS] [CrossRef] [EDP Sciences] [Google Scholar]
- Rice, K. 2016, PASA, 33, e053 [NASA ADS] [CrossRef] [Google Scholar]
- Rice, W., Lodato, G., Pringle, J., Armitage, P., & Bonnell, I. 2004, MNRAS, 355, 543 [NASA ADS] [CrossRef] [Google Scholar]
- Rice, W., Lodato, G., & Armitage, P. 2005, MNRAS, 364, L56 [NASA ADS] [CrossRef] [Google Scholar]
- Richert, A. J., Getman, K. V., Feigelson, E. D., et al. 2018, MNRAS, 477, 5191 [NASA ADS] [CrossRef] [Google Scholar]
- Rota, A., Manara, C., Miotello, A., et al. 2022, A&A, 662, A121 [NASA ADS] [CrossRef] [EDP Sciences] [Google Scholar]
- Rowther, S., & Meru, F. 2020, MNRAS, 496, 1598 [Google Scholar]
- Safronov, V. 1972, Evolution of the Protoplanetary Cloud and Formation of the Earth and Planets (Jerusalem: Keter Publishing House) [Google Scholar]
- Schib, O., Mordasini, C., Wenger, N., Marleau, G. D., & Helled, R. 2021, A&A, 645, A43 [NASA ADS] [CrossRef] [EDP Sciences] [Google Scholar]
- Schib, O., Mordasini, C., & Helled, R. 2022, A&A, 664, A138 [NASA ADS] [CrossRef] [EDP Sciences] [Google Scholar]
- Shakura, N., & Sunyaev, R. 1973, A&A, 24, 337 [Google Scholar]
- Shu, F. H., Tremaine, S., Adams, F. C., & Ruden, S. P. 1990, ApJ, 358, 495 [Google Scholar]
- Teague, R., Bae, J., Bergin, E. A., Birnstiel, T., & Foreman-Mackey, D. 2018, ApJ, 860, L12 [NASA ADS] [CrossRef] [Google Scholar]
- Teague, R., Bae, J., & Bergin, E. A. 2019, Nature, 574, 378 [NASA ADS] [CrossRef] [Google Scholar]
- Terry, J., Hall, C., Longarini, C., et al. 2022, MNRAS, 510, 1671 [Google Scholar]
- Testi, L., Birnstiel, T., Ricci, L., et al. 2014, in Protostars and Planets VI, eds. H. Beuther, R. S. Klessen, C. P. Dullemond, & T. Henning (Tucson: University of Arizona Press), 339 [Google Scholar]
- Tobin, J. J., Sheehan, P. D., Megeath, S. T., et al. 2020, ApJ, 890, 130 [CrossRef] [Google Scholar]
- Toomre, A. 1964, ApJ, 139, 1217 [Google Scholar]
- Turner, N., Fromang, S., Gammie, C., et al. 2014, in Protostars and Planets VI, eds. H. Beuther, R. S. Klessen, C. P. Dullemond, & T. Henning (Tucson: University of Arizona Press), 411 [Google Scholar]
- Tychoniec, Ł., Tobin, J. J., Karska, A., et al. 2018, ApJS, 238, 19 [Google Scholar]
- Vigan, A., Fontanive, C., Meyer, M., et al. 2021, A&A, 651, A72 [EDP Sciences] [Google Scholar]
- Vorobyov, E. I., & Basu, S. 2010, ApJ, 719, 1896 [NASA ADS] [CrossRef] [Google Scholar]
- Vorobyov, E. I., & Elbakyan, V. G. 2018, A&A, 618, A7 [NASA ADS] [CrossRef] [EDP Sciences] [Google Scholar]
- Wagner, K., Apai, D., Kasper, M., McClure, M., & Robberto, M. 2022, AJ, 163, 80 [NASA ADS] [CrossRef] [Google Scholar]
- Yorke, H. W., & Bodenheimer, P. 2008, ASP Conf. Ser. 387, 189 [Google Scholar]
- Zhu, Z., Hartmann, L., & Gammie, C. 2010, ApJ, 713, 1143 [Google Scholar]
- Zhu, Z., Hartmann, L., Nelson, R. P., & Gammie, C. F. 2012, ApJ, 746, 110 [Google Scholar]
We note that the fragmentation fractions given in Paper I were calculated as the ratio of simulations that fragment to the total number of simulations (10 000). Here we are including the relative likelihoods of different final stellar masses according to the IMF in the calculation. This leads to lower values for the fragmentation fraction (e.g. 22% instead of 45% reported in Paper I). We do this throughout the present work for consistency.
All Tables
All Figures
|
Fig. 1 Cumulative distributions of the disc radii at the end of the infall phase for runs “5× MHD”, “8× MHD” and “12× MHD”. The runs “MHD” and “hydro” from Paper I are shown for reference. The blue shaded region shows the sizes of observed Class 0 discs for systems in isolation from Tobin et al. (2020). |
| In the text | |
|
Fig. 2 Cumulative distributions of the disc radii at the end of the infall phase for runs OBS_IRR, OBS_NOIRR, and OBS_REDIRR together with observed radii. |
| In the text | |
|
Fig. 3 Total luminosities (intrinsic and accretion) at the end of the infall phase for runs OBS_IRR, OBS_NOIRR, and OBS_REDIRR. The black solid line shows observed luminosities of isolated Class 0 protostars from Tobin et al. (2020). |
| In the text | |
|
Fig. 4 Results related to fragmentation for runs OBS_IRR, OBS_NOIRR, and OBS_REDIRR. Top left: fraction of fragmenting discs as a function of final stellar mass. Top right: mean number of fragments (for systems that do fragment). Bottom left: location where the discs fragment. Bottom right: initial fragment masses. |
| In the text | |
|
Fig. 5 Fraction of discs that fragment for all the runs studied. Each run consists of 10 000 simulations and the results are representative of a distribution of final masses in agreement with the IMF. The most realistic scenario is run OBS_REDIRR, where the stellar shock luminosity is scaled to agree with observed luminosities of Class 0 protostars. |
| In the text | |
|
Fig. A.1 Stellar masses at the end of the simulation for runs OBS_IRR, OBS_NOIRR and OBS_REDIRR, compared to the Chabrier (2005) IMF. |
| In the text | |
|
Fig. A.2 Disc masses at the end of the infall phase for runs OBS_IRR, OBS_NOIRR and OBS_REDIRR, compared to observed Class 0 discs. |
| In the text | |
|
Fig. A.3 Disc fractions based on reduced disc lifetimes as a function of time for runs OBS_IRR, OBS_NOIRR and OBS_RDIRR compared to a fit to observed disc fractions (Richert et al. 2018). |
| In the text | |
|
Fig. B.1 Infall radii for OBS_IRR, OBS_NOIRR and OBS_REDIRR. |
| In the text | |
|
Fig. C.1 Infall times for runs OBS_IRR, OBS_NOIRR, and OBS_REDIRR. |
| In the text | |
Current usage metrics show cumulative count of Article Views (full-text article views including HTML views, PDF and ePub downloads, according to the available data) and Abstracts Views on Vision4Press platform.
Data correspond to usage on the plateform after 2015. The current usage metrics is available 48-96 hours after online publication and is updated daily on week days.
Initial download of the metrics may take a while.