| Issue |
A&A
Volume 671, March 2023
|
|
|---|---|---|
| Article Number | A137 | |
| Number of page(s) | 13 | |
| Section | Stellar atmospheres | |
| DOI | https://doi.org/10.1051/0004-6361/202244646 | |
| Published online | 17 March 2023 | |
Sulfur abundances in three Galactic clusters: Ruprecht 106, Trumpler 5, and Trumpler 20★
1
Departamento de Ciencias Fisicas, Faculdad de Ciencias Exactas, Universidad Andres Bello,
Av. Fernandez Concha 700,
Las Condes, Santiago,
Chile
e-mail: lucertini.fra@gmail.com
2
ESO – European Southern Observatory,
Alonso de Cordova
3107,
Vitacura, Santiago,
Chile
3
GEPI, Observatoire de Paris, Université PSL, CNRS,
Place Jules Janssen,
92195
Meudon,
France
4
Dipartimento di Fisica e Astronomía, Università degli Studi di Bologna,
Via Gobetti 93/2,
40129
Bologna,
Italy
5
INAF – Osservatorio di Astrofísica e Scienza dello Spazio di Bologna,
Via Gobetti 93/3,
40129
Bologna,
Italy
6
Departamento de Astronomia, Casilla 160-C, Universidad de Concepcion,
Cooncepción,
Chile
Received:
31
July
2022
Accepted:
5
October
2022
Context. Sulfur (S) is one of the lesser-studied α-elements. Published investigations of its behavior have so far focused on local stars, and only a few clusters of the Milky Way have been considered to study this topic. We aim to study the S content of the globular cluster Ruprecht 106 – which has never before been studied for this purpose, but is known to present low levels of the [α/Fe] abundance ratio – and the open cluster Trumpler 5. The only star studied so far in Trumpler 5 shows an unexpectedly low abundance of S.
Aims. With this work, we aim to provide the first S abundance in Ruprecht 106 and to investigate the S content of Trumpler 5 with a larger sample of stars. The open cluster Trumpler 20 is considered as a reference object.
Methods. We performed a standard abundance analysis based on 1D model atmospheres in local thermodynamical equilibrium (LTE) and on high-resolution and high-signal-to-noise-ratio UVES-slit and UVES/FLAMES spectra. We also applied corrections for nonLTE. The metallicities of the targets were obtained by studying equivalent widths. Sulfur abundances were derived from multiplets 1, 6, and 8 by spectrosynthesis.
Results. We find that the metallicities of Ruprecht 106 and Trumpler 5 are [Fe/H] = −1.37±0.11 and [Fe/H] = −0.49±0.14, respectively. Ruprecht 106 is less S-rich than the other Galactic clusters at similar metallicity. The low S content of Ruprecht 106, [S/Fe]NLTE = −0.52±0.13, is consistent with its shortage of α-elements. This supports an extra-galactic origin of this cluster. We obtained a new and more robust S content value of Trumpler 5 of about [S/Fe]NLTE = 0.05±0.20. According to our results, Trumpler 5 follows the trend of the Galactic disk in the [S/Fe]LTE versus [Fe/H] diagram. Our results for Trumpler 20, of namely [Fe/H]= 0.06±0.15 and [S/Fe]NLTE = −0.28±0.21, are in agreement with those in the literature.
Key words: stars: abundances / globular clusters: individual: Rup106 / open clusters and associations: individual: Tr5 / open clusters and associations: individual: Tr20
© The Authors 2023
 Open Access article, published by EDP Sciences, under the terms of the Creative Commons Attribution License (https://creativecommons.org/licenses/by/4.0), which permits unrestricted use, distribution, and reproduction in any medium, provided the original work is properly cited.
This article is published in open access under the Subscribe to Open model. Subscribe to A&A to support open access publication.
1 Introduction
The α-elements (O, Ne, Mg, Si, S, Ar, Ca and Ti) are recognized by the scientific community as a powerful tool for reconstructing the chemical evolution of stellar populations and galaxies. They are produced by successive fusions of helium nuclei (α particles) in massive stars (M* > 8 M⊙), which explode as type-II supernovae (SNe II) at the end of their life and eject their material into the interstellar medium (ISM). On the other hand, type-Ia SNe (SNe Ia) mainly release iron-peak elements (Cr, Mn, Fe, Co, Ni Cu, Zn) in the ISM over longer timescales. The time delay between the explosion of SNe II and SNe Ia, and consequently the [α/Fe] ratio, provide crucial clues with which to infer the star formation history and the evolution of a system. For these kinds of investigations, the works in the literature usually skip the analysis of sulfur (S) in favor of other α-elements. Consequently, our knowledge about S is far from complete.
In agreement with the α-elements behavior, the [S/Fe] versus [Fe/H] diagram for Milky Way (MW) stars shows a plateau around [S/Fe] ~ 0.4 at low [Fe/H], followed by a decrease in [S/Fe] with increasing metallicity until reaching [S/Fe] = 0 at about [Fe/H] = 0 (Clegg et al. 1981; François 1987; Nissen et al. 2007). This trend is confirmed by studies of halo (François 1988; Nissen et al. 2004; Caffau et al. 2010) and disk (Chen et al. 2002; Ryde 2006; Takeda & Takada-Hidai 2011; Duffau et al. 2017) Galactic stars, but the situation is less clear in the low-metallicity regime. The [S/Fe] value obtained by Israelian & Rebolo (2001) constantly increases as the metallicity decreases, until ~0.7–0.8 dex at −2.3 <[Fe/H] < −1.9. These authors explain this value by proposing that hypernovae contributed to the nucleosynthesis of elements in early galaxies. The time-delay deposition of iron into the ISM could be another explanation (Ramaty et al. 2001). Instead, Caffau et al. (2005a) found a bimodal behavior of [S/Fe] (both stars with [S/Fe] ~ 0.4 and higher values) at metallicities lower than [Fe/H] < −1.0. On the other hand, the S trend presented by Matrozis et al. (2013) in the metallicity range −2.5 < [Fe/H] < −1.0 is characterized by a plateau at [S/Fe] ~ 0.4, which is typical of α–elements. Finally, Spite et al. (2011) investigated S in extremely metal-poor stars (−3.2 < [Fe/H] < −2.0) and found no correlation between [S/Fe] and [Fe/H].
Recently, Griffith et al. (2021) and Lucertini et al. (2022) confirmed that the behavior of S resembles that of α-elements within the Galactic bulge. However, these authors found conflicting results comparing sulfur abundances (referred to hereafter as A(S)) of disk and bulge stars in the MW. Griffith et al. (2021) found that the disk and the bulge have similar S trends, while the Galactic bulge is S-rich with respect to both the thick and the thin disk according to Lucertini et al. (2022).
So far, A(S) have only been obtained for a few globular clusters (GCs) and open clusters (OCs). Sbordone et al. (2009) estimated the first A(S) in subgiant stars of NGC 6752 and 47 Tucanae (47 Tuc). The GC NGC 6397 was analyzed by Koch & Caffau (2011). Kacharov et al. (2015) obtained A(S) for the GCs M 4, M 20, and M 30. The most inconsistent result was obtained by Caffau et al. (2014) for the OC Trumpler 5. Indeed, the only analyzed star of this object was found to be characterized by a low A(S) value. In the same work, the authors studied the GC M 4, and the OCs NGC 2477 and NGC 5822. Finally, Duffau et al. (2017) made a significant contribution, studying five new GCs and 16 OCs. All these authors concluded that S behaves like the other α-elements.
Considering that the MW hosts more than 150 GCs1 and less than one-tenth have been taken into account for the investigation of S, it is clear that more effort should be devoted in this subject. The aim of the present study is to increase the numbers of clusters and stars of known A(S) content. In particular, we are presenting Fe and S abundances for the GC Ruprecht 106 (Rup 106) and the OCs Trumpler 5 (Tr 5) and Trumpler 20 (Tr 20).
The paper is structured as follows: in Sect. 2, we summarize the relevant information gathered so far about the clusters considered in this study and our reasons for analyzing them. Observational data are described in Sect. 3. Section 4 presents our data analysis and chemical abundance estimations. In Sect. 5, we discuss our results and compare them with the literature. Finally, our conclusions are summarized in Sect. 6.
2 The targets
2.1 Ruprecht 106
Rup 106 is a GC located in the MW halo (RA, Dec) = (12h38m40.2s, −51°09′01′′) at 21.2 kpc from the Sun and 18.5 kpc from the Galactic center (Harris 2010). At an apparent visual distance modulus (m – M)v = 17.25, its reddening is E(B – V) = 0.20 (Harris 2010). With an age of 12 Gyr (Da Costa et al. 1992; VandenBerg et al. 2013; Frelijj et al. 2021), Rup 106 is younger than the bulk of the Galactic GCs (Buonanno et al. 1993; Dotter et al. 2011). The works in the literature agree on the metal-poor nature of Rup 106, and provide values of between [Fe/H] = −1.66 (Da Costa et al. 1992; François et al. 1997; Harris 2010) and [Fe/H] = −1.45 (Pritzl et al. 2005; Frelijj et al. 2021). Rup 106 is considered the first convincing example of a single stellar population GC (Villanova et al. 2013; Dotter et al. 2018; Frelijj et al. 2021). This assessment is supported by the absence of an Na-O anti-correlation (Buonanno et al. 1990; Villanova et al. 2013; Frelijj et al. 2021). Moreover, the color–magnitude diagram (CMD) of Rup 106 shows a very narrow red-giant branch (RGB; Dotter et al. 2018; Frelijj et al. 2021). From a chemical point of view, Rup 106 is over-deficient in α-elements (Brown et al. 1996, Brown et al. 1997, Villanova et al. 2013, François 2014). In particular, its chemical composition is consistent with Local Group (LG) dwarf galaxies, and it is representative of nucleosynthesis processes different from those that have taken place in the majority of the Galactic halo and nearby clusters (Villanova et al. 2013). For these reasons, it has been proposed that Rup 106 formed outside the Milky Way, and was accreted by our galaxy (Lin & Richer 1992; Brown et al. 1996; François 2014).
Rup 106 has never before been considered for the study of S. In this work, we provide the first A(S) in this cluster. In particular, we investigated whether or not Rup 106 is characterized by a low content of S, in agreement with the behavior of the other α-elements.
2.2 Trumpler 5
Tr 5 is an OC located in the MW disk (RA, Dec) = (6h36m42s, +09°26′00′′), at 3.1 ± 0.1 kpc from the Sun (Kim et al. 2009). Piatti et al. (2004) estimated an angular radius of 7.7 arcmin (5.4 pc) for this object. The distance modulus and the reddening of Tr 5 are (m – M)v=12.4 and E(B – V) = 0.58 (Kaluzny 1998; Kim et al. 2009; Donati et al. 2015), respectively. Due to its old age (4 Gyr, Kaluzny 1998; Donati et al. 2015), Tr 5 is an ideal laboratory for studying the formation and early evolution of the Milky Way disk. Indeed, old OCs constitute only ~ 15% of those known so far (Dias et al. 2002; Cantat-Gaudin et al. 2020), and are probes of the structure and chemical distribution of the Galactic disk. Tr 5 is a metal-poor OC with [Fe/H] = −0.4±0.1 (Kaluzny 1998; Piatti et al. 2004; Kim et al. 2009; Donati et al. 2015), and is characterized by solar abundance ratios (Donati et al. 2015; Monaco et al. 2014). Moreover, Donati et al. (2015) and Monaco et al. (2014) found slightly super-solar abundances of Mg and Al, in agreement with the results obtained in other OCs of similar metallicity (Bragaglia et al. 2008; Sestito et al. 2008; Pancino et al. 2010; Carrera & Pancino 2011; Yong et al. 2012). Caffau et al. (2014) estimated A(S) in only one member star of Tr 5. According to these latter authors, this star is under-abundant in S with respect to the Galactic disk. In particular, Caffau et al. (2014) claim a similar S behavior for Tr 5 and the GC Terzan 7, which belongs to the Sagittarius dwarf galaxy.
In this work, we present A(S) for the same target analyzed by Caffau et al. (2014) and another five stars in order to investigate the low S content of Tr 5.
2.3 Trumpler 20
The OC Trumpler 20 (Tr 20) is located in the inner disc of the MW (RA, Dec) = (12h39m34s, −60°37′00′′) at ~3.3 kpc from the Sun and ~7 kpc from the Galactic center (Donati et al. 2014). Platais et al. (2008) obtained (m – M)v = 12.00 and E(B – V) = 0.46 for Tr 20. The CMD for Tr 20 shows a broadened main sequence turn off and a prominent and extended red clump (RC; Platais et al. 2012; Donati et al. 2014). Considering the age of Tr 20 ( Gyr, Carraro et al. 2014), these features are not easily explained by classical evolutionary models, making this object an interesting target with which to investigate the formation and the evolution of the MW disk. According to the works in the literature, the metallicity of Tr 20 is slightly supersolar: [Fe/H] = 0.10±0.08 (Carraro et al. 2014; Donati et al. 2014; Tautvaišienė et al. 2015). Moreover, Carraro et al. (2014) found solar abundances of α-elements in Tr 20, which follow the trend of giant stars located in the inner disk and other old OCs with similar metallicity. Similarly, Duffau et al. (2017) found a solar [S/Fe] ratio in Tr 20. We considered this OC in our work as a reference object.
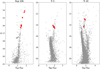 |
Fig. 1 G versus GBP – GRP CMD of the clusters considered in this work: Rup 106 (left), Tr 5 (middle), and Tr 20 (right). The sample of stars analyzed in this work is shown by the red squares. |
3 Observational data
The aim of this work is to provide the first A(S) in Rup 106 and to investigate the behavior of S in Tr 5. We analyzed seven RGB stars of Rup 106, six RC stars of Tr 5, and four giant stars (RGB and RC) of Tr 20. Our sample of stars is shown by the red squares in the Gaia (Gaia Collaboration 2016) EDR3 (Gaia Collaboration 2021) G versus Gbp – Grp CMDs of Fig. 1. The ID, coordinates, and G, GBP – GRP magnitudes of the targets are reported in Table 1.
All the data considered in this work are available in the ESO archive2. We retrieved the red-arm UVES (Dekker et al. 2000) spectra of the targets collected with the multi-object fiber-fed FLAMES facility (Pasquini et al. 2002) mounted on the ESO-VLT/UT2 telescope at the Paranal observatory (Chile). We selected the spectra observed with the 860 nm setting (here-after R860), which are characterized by R ~ 47 000 and cover the wavelength range where S lines lie (675–1050 nm). These data were reduced using the ESO–CPL-based FLAMES/UVES pipeline. We also collected the data for our targets observed with the 580 nm setting (hereafter R580), which cover the 480–680 nm wavelength range. In particular, we used the R580 UVES-slit data of Rup 106 studied by Villanova et al. (2013). Instead, the R580 FLAMES/UVES data of Tr 5 are those analyzed by Monaco et al. (2014). We also considered the spectrum of Tr 5 star #3416 analyzed in Monaco et al. (2014). This was obtained with the MIKE spectrograph (Bernstein et al. 2003) at the MAGELLAN telescope at the Las Campanas observatory (Chile). We refer the reader to Monaco et al. (2014) for details of the data reduction of this spectrum. Finally, the R580 FLAMES/UVES data for Tr 20 were obtained from the Gaia ESO Survey3 (Gilmore et al. 2012; Randich et al. 2013).
The dates of observation and the signal-to-noise ratios (S/Ns) of the spectra are reported in Table 1. In particular, the dates reported are indicative, as the data were collected during different nights and epochs, as specified in the notes of the table.
4 Analysis
4.1 Atmospheric parameters
In order to derive the chemical abundances from the spectra, we first need to obtain an initial estimate of the atmospheric parameters. For this purpose, we used the Gaia EDR3 photometry (Riello et al. 2021) combined with the 2MASS photometry (Cutri et al. 2003). This is a homogeneous and wide base photometry of the targets, which is ideal to better estimate the reddening. Only the stars with Gaia EDR3 proper motions compatible with cluster membership were taken into account. We first apply the isochrone fitting method, where an isochrone is adjusted to the CMD. We used Padova isochrones (Bressan et al. 2012) for this purpose. For Ruprecht 106, we used an age of 12 Gyr (VandenBerg et al. 2013) and isochrones spanning a range of metallicities between −2.00 and −1.00 in steps of 0.05 dex. For Trumpler 5 and Trumpler 20 instead, data were deep enough to estimate ages from the turn-off (TO) magnitude, and so we treated this as a free parameter to be estimated during the isochrone fitting. For the two clusters, we used a metallicity range from −0.5 to +0.20, with a step of 0.05 dex. The interstellar absorption was taken into consideration using the Cardelli et al. (1989) relation, applying a point-by-point correction to the isochrones. In this case, the free parameters are the V band absorption (Av) and the reddening-law coefficient (Rv).
For Ruprecht 106, we obtained the best fit of the RGB for a distance of 22080 pc (intrinsic distance modulus of (m – M)0 = 16.72), AV = 0.71, RV = 2.70 (which translates into E(B – V) = 0.26), and a global metallicity [M/H] = −1.85. Harris (2010) gives a distance modulus in the V band of 17.25 and a reddening E(B – V) = 0.20. Our reddening and distance modulus are slightly higher, because (m – M)V = 17.25 translates into (m – M)0=16.63 if E(B – V) = 0.20 and Rv = 3.1 are assumed. The global metallicity [M/H] we find is lower than the iron content of the cluster ([Fe/H] = −1.68) as given by Harris (2010). This is due to the fact that [M/H] is affected not only by the iron content, but also by the amount of all the other elements in the atmosphere, including C, N, and O, which are the most abundant. Our finding could mean that Ruprecht 106 is particularly low in one of those elements. Indeed, several works in the literature show that Rup 106 is poor in Na and not enhanced in a-elements (Buonanno et al. 1990; Brown et al. 1997; Villanova et al. 2013; Frelijj et al. 2021).
For Trumpler 5 and Trumpler 20 instead, we obtained the best fit for distances of 2900 and 2800 pc (intrinsic distance modulus of (m-M)0 = 12.31 and 12.24, respectively), Av = 2.05 and AV = 1.55, RV = 3.1 for both clusters (that translates into E(B – V) = 0.66 and E(B – V) = 0.50), a global metallicity of [M/H] = −0.40 and [M/H] = +0.15, and ages of 4.0 Gyr and 1.6 Gyr, respectively. The WEBDA database4 gives a distance of 3000 pc, a reddening of 0.58 and an age of 4.0 Gyr for Trumpler 5, while for Trumpler 20 it gives a distance of 2420 pc, a reddening of 0.26, and an age of 0.15 Gyr. In the case of Trumpler 5, these values are in very good agreement with our findings, while for Trumpler 20, reddening and especially age are significantly discrepant. We attribute this to the fact that this cluster is strongly affected by field contamination, and previous studies did not have proper motions in order to remove it. Instead, with proper motions, we were able to obtain a clean CMD and therefore to determine a reliable age.
After that, for Ruprecht 106 we derived Teff –K and log ɡ –K relations using the RGB part of the isochrone. We obtained temperature and gravity for our targets by simply entering their K magnitudes into these relations. Indeed, as all the targets of Rup 106 are RGB stars, it is possible to define a unique relation between Teff and magnitude. Microturbulence (vt) instead was calculated using the equation from Dutra-Ferreira et al. (2016), which takes both temperature and gravity into account. In particular, these authors presented a relation based on 3D atmospheric models for a sample of subgiant and dwarf stars.
For Trumpler 5 and Trumpler 20 instead, we preferred to derive temperature from the Teff –(GBP – K) relation obtained from the RGB part of the isochrone. This is because the targets of Tr 5 are RC, while the sample of stars in Tr 20 includes RGB and RC. Therefore, due to the fact that we have stars with different Teff at the same magnitude, it was not possible to derive a unique Teff –magnitude relation. The gravity was again obtained from the log ɡ–K relation. Also in this case, the microturbulence was calculated using the equation from Dutra-Ferreira et al. (2016).
The obtained atmospherical parameters are listed in Table 2. The typical errors in Teff and log ɡ are 50 K and 0.1 dex, respectively. These values were derived introducing the photometrical uncertainties in the Teff –K, Teff –(GBP – K) and log ɡ–K relations. We stress the fact that these are internal uncertainties; external or systematic errors can be larger and are mainly related to uncertainties on isochrone fitting.
Observational dataset.
4.2 Radial velocities
As the spectra of the targets were collected during different nights or epochs, we computed the radial velocities (RVs) of each spectrum. We used the IRAF/fxcor5 task to cross correlate the observed spectra with a synthetic one. The theoretical spectra were computed with the code SYNTHE (Kurucz 1993b, 2005) using ATLAS9 model atmospheres (Kurucz 1993a) based on opacity distribution functions (ODFs) by Castelli & Kurucz (2003), with the atmospheric parameters in Table 2.
Our choice to use ATLAS models is driven by the fact that the code is open source and we can compute models for the desired parameters. We prefer to compute models, of which we can check the convergence, rather than to use pre-computed grids of models, which provide no information on the convergence. Furthermore, to use a model grid it is necessary to interpolate and it is not guaranteed that the interpolated model satisfies the constraint of constant flux and zero-flux derivative from layer to layer. The referee raised the issue of the pertinence of using plane parallel models versus spherical models for our stars. The effect is very small. We compared synthetic spectra of the S I Mult.1 lines, computed with turbospectrum (Plez 2012; which can treat both spherical and plane parallel radiative transfer) for a MARCS (Gustafsson et al. 2008) spherical model of Teff 4250 K, log ɡ = 0.5, microturbulence 2 km s−1, metallicity −1.5, and α enhancement +0.4, and an ATLAS 9 model with identical parameters, which were computed by us. These parameters are close to those of stars # 1614 and # 2004 in Ruprecht 106, which are the two most luminous giants in our sample, for which the sphericity effects are largest. In terms of abundance, the difference between the two synthetic spectra can be quantified as 0.08 dex, in the sense that use of plane parallel models results in smaller abundances. We underline that the for plane parallel models, ATLAS and MARCS models are well known to be equivalent (e.g., Bonifacio et al. 2009, Appendix A). It is impossible to compare a MARCS spherical with a MARCS plane parallel model with the same parameters using the models available online6, because there is no overlap of the two classes of models. Nevertheless, we believe our test provides the correct order of magnitude of the sphericity effect. This is an upper limit for our sample of stars, as all have higher surface gravities. It has not been demonstrated that spherical 1D models provide a better modeling of the optical and near-infrared (NIR) spectra of K giants. We conclude that there is no reason to use spherical 1D models for our analysis. We decided to use ATLAS 9 models rather than ATLAS 12 models (which use opacity sampling instead of ODFs) since they can be computed faster (a factor of 30) and for this kind of stars the two class of models are equivalent, as discussed in Appendix A.
We corrected to the rest frame and combined the spectra of each star. The RVs obtained in this work for the sample of stars are listed in Table 3. In particular, the RVs reported are the mean value obtained from each exposure. In the case of Tr 5 R580 data, we used and reported the RVs estimated by Monaco et al. (2014).
Atmospheric parameters and metallicities obtained in this work.
Radial velocities and dates of observation of the stars of our sample.
4.3 Iron abundances
To estimate the metallicity of the targets, we created our iron (Fe I and Fe II) linelist. For this purpose, we used the R580 datasets to create an iron linelist for each cluster by comparing observational and synthetic spectra. The linelists of the three clusters were joined and matched with the Gaia-ESO linelist (Heiter et al. 2021) to get more precise atomic data. The final linelist is composed of 258 Fe I and 42 Fe II lines, for a total of 300 features in the wavelength range 480–680 nm.
The iron abundances of the targets were derived from line equivalent widths (EWs) using the code GALA (Mucciarelli et al. 2013). We measured the EW with the software DAOSPEC (Stetson & Pancino 2008). We want to emphasize that each line was carefully checked against blending before being selected for the estimation of iron abundances. Moreover, we selected Fe lines with EW < 100 mÅ and excitation potential χ > 1.2 eV. We investigated the uncertainty on A(Fe) due to atmospheric parameter errors. From the process adopted to estimate the atmospheric parameters, the typical uncertainties are σT ~ 50 K, σlog ɡ ~ 0.1 and σξ ~ 0.1 km s−1. We found that the A(Fe) uncertainties due to σT, σlog ɡ, and σξ are 0.05, 0.02, and 0.02 dex, respectively. A variation about 0.1 dex in metallicity leads to an A(Fe) uncertainty of 0.01 dex. Table 2 reports the stellar metallicities obtained; we assume the solar value A(Fe)⊙ = 7.52 ± 0.06 (Caffau et al. 2011) based on the investigations by Caffau & Ludwig (2007) and Caffau et al. (2007).
The dataset for Tr 5 does not include the R580 spectra of all the stars. Furthermore, we were not able to measure the [Fe/H] ratio from these data for #3678 due to the low S/N of the spectrum. For these reasons, we created an Fe linelist and estimated the metallicity of Tr 5 targets using the data collected with the R860 setting. In the case of the star #3416, we used the MIKE spectrum due to its higher S/N. For #1318, the [Fe/H] values obtained from R580 and R860 datasets are comparable within the errors. Similarly, for #3416, we found good agreement between the metallicities estimated from MIKE and R860 data. This implies that there is not a systematic offset between [Fe/H] as derived from different datasets. This supports the reliability of the metallicity estimated from only the R860 data. On the other hand, the final metallicities of the stars #1318 and #3416 were measured using Fe linelists created from both datasets (R580 or MIKE, and R860).
We found a mean [Fe/H] = −1.37 + 0.11 for Rup 106, in agreement with previous works (François et al. 1997; Brown et al. 1997; Pritzl et al. 2005; Villanova et al. 2013; Frelijj et al. 2021). The mean metallicy of Tr 5 is [Fe/H] = −0.49 + 0.14. This result is consistent with that of Cole et al. (2004); Piatti et al. (2004); Carrera et al. (2007); Kim et al. (2009) and Donati et al. (2015). According to several works in the literature (Platais et al. 2008; Carraro et al. 2014; Tautvaišienė et al. 2015; Donati et al. 2014), Tr 20 is characterized by a slightly super-solar metallicity. We obtained an iron content for the ОС Tr 20 of about 0.06 + 0.15.
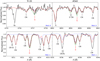 |
Fig. 2 Observed spectrum of the Tr 20 star #542 (black) superimposed with the best-fit synthetic spectrum (dashed red). The green and purple profiles are synthetic spectrum with +0.2 dex and −0.2 dex in A(S), respectively. The TAPAS profile is also shown (dotted blue). The red vertical lines indicate the sulfur features. |
4.4 Sulfur abundances
The S I lines that we analyzed in this work are reported in Table 4. Thanks to the high resolution and the high S/N of the R860 data, we were able to consider the weak lines of multiplet (Mult.) 8 and 6 besides those of Mult. 1. However, these lines were not identifiable in the stellar spectra of Rup 106 due to the low metallicity of the cluster. Consequently, the A(S) in Rup 106 were estimated from Mult. 1 features only.
The possible telluric lines contamination was taken into account using TAPAS atmospheric transmission spectra (Bertaux et al. 2014). We want to underline that, as opposed to the other clusters, Tr 5 data were observed in different epochs. In this case, we created a TAPAS profile for each epoch. As S lines of Mult. 6 and 8 are not affected by telluric lines, we combined the spectra of each epoch to measure A(S) from these lines. The line at 9212 Å was not found to be contaminated in October and November epochs, and so these last were combined to calculate A(S). Similarly, the epochs of December were combined to estimate the A(S) from the lines at 9228 and 9237 Å. In the case of Rup 106 and Tr 20, the Mult. 1 in the different exposures of each star were not found to be contaminated by telluric lines. Consequently, we combined all the R860 data of Rup 106 and Tr 20 stars to estimate their A(S).
Once the suitability of the S lines had been evaluated, we measured A(S) by spectrosynthesis. Employing our code SALVADOR (Mucciarelli in prep.), the chemical abundance is found when the minimum χ2 between the observed and the synthetic spectra is reached. Figure 2 shows the observed spectrum (black) of the Tr 20 star #542 with the best-fit synthetic spectrum (dashed red) and the TAPAS profile (dotted blue) superimposed. We estimated the [S/Fe] ratio considering the solar value A(S)⊙ = 7.16 (Caffau et al. 2011). The mean A(S)LTE with their standard deviations of each target are reported in Table 5. We investigated the uncertainty in chemical abundance determination due to the error on stellar parameters. Adopting the typical uncertainties σT ~ 50 K, σlog ɡ ~ 0.1, and σξ ~ 0.1 km s−1, we found errors on A(S) of about 0.06 dex, 0.04 dex, and 0.02 dex, respectively. Finally, considering σ[Fe/H] = 0.1, we found σa(S) = 0.02.
Atomic parameters of the sulfur lines.
LTE and NLTE sulfur abundances obtained line by line for the stars analyzed in this work.
4.5 NLTE corrections
Following Takeda et al. (2005), we derived the nonlocal thermodynamic equilibrium (NLTE) corrections for lines of Mult. 6 and 1. Table 5 reports the LTE and NLTE A(S) obtained from each line of our targets and the mean A(S)LTE and A(S)NLTE with their standard deviations. The mean LTE and NLTE line-to-line scatter for Rup 106 stars are both 0.06 dex. We obtained a mean NLTE correction of < Δ >~ −0.18 and < Δ >~ −0.11 for the lines at 9212 and 9228 Å, respectively. We find a mean LTE line-to-line scatter of 0.10 dex for Tr 5. As expected from Korotin et al. (2020), Mult. 6 is less affected by LTE deviations,−0.05 < Δ < −0.02, than Mult. 1, −0.47 < Δ < −0.25. As a consequence, the mean NLTE line-to-line scatter increases to 0.14 dex due to the difference between the A(S) values obtained from Mult. 8 and Mult. 1 lines. This is also the case for Tr 20 stars, where we find < Δ > ~ −0.05 for Mult. 6 line, < Δ > ~ −0.3 and < Δ >~ −0.23 for lines at 9212 and 9228 Å, respectively. The mean LTE and NLTE line-to-line scatter for Tr 20 stars are respectively 0.01 dex and 0.16 dex.
In order to better see the effect of NLTE corrections, we compared the mean LTE (black) and NLTE (red) A(S) obtained for the stars of each cluster from the different lines in Fig. 3. The error bars are the standard deviation of the A(S) obtained from the lines. It is clear from this plot that the A(S)LTE obtained from the different Mult, are consistent between each other. In contrast, this agreement is no longer found when comparing A(S)NLTE obtained from Mult. 8, 6, and 1. In conclusion, it is evident that the increased scatter in A(S)NLTE is due to NLTE corrections.
This may lead us to question the NLTE corrections; specifically, we suspect the predicted NLTE effects for Mult. 1 lines in the Tr 5 and Tr 20 stars are overestimated. We suggest the problem lies in collisions with H atoms, which is treated by Takeda et al. (2005) using the Drawin formalism (Drawin 1969) as generalized by Steenbock & Holweger (1984). Although the Drawin formalism is usually employed, in the absence of theoretical or experimental data on the cross-sections of collisions with H atoms, Barklem et al. (2011) showed that such formalism does not contain the essential physics to explain H atom collisions from a quantum mechanical point of view. Takeda et al. (2005) used a scaling factor h, which corresponds to the logarithm of the correction factor applied to the results of the Drawin formalism. Takeda et al. (2005) analyzed the cases of h = +1,0,−1,−2, and −3, where h = 0 corresponds to the classical formula. The NLTE effect increases as h decreases. Increasing the number of collisions drives the system toward LTE. Moreover, NLTE corrections are negative and larger (in absolute value) for low log ɡ, high Teff, and low metallicity. Takeda et al. (2005) tabulated NLTE abundance corrections (Δh) for lines of Mult. 6 and 1 for an extensive grid of 210 model atmospheres (Teff = 4000 – 7000 K, log ɡ = 1.0 – 5.0, ξ = 2 km s−1, [Fe/H]= +0.5, 0.0, −0.5, −1.0, −2.0, −3.0, −4.0). From Table 2 of Takeda et al. (2005), the corrections Δ+ļ = −0.14, Δ0 = −0.32, Δ−1 = −0.46, Δ−2 = −0.52, Δ−3 = −0.54 correspond to the model with Teff = 4500, log ɡ = 2.0, [Fe/H] = 0.0 for the S line at 9212 Å. In Fig. 3, it is possible to see that the < Δ > for 9212 Å line is around 0.3 dex, in agreement with what is expected using h = 0. However, this kind of correction leads to a discrepancy between the A(S) estimated from lines at 6757 and 9212 Å. Nevertheless, this difference is reduced when assuming h = +1, and a lower (negative) NLTE correction for 9212 Å line is obtained. We conclude that the disagreement in A(S)NLTE obtained from Mult. 8,6, and 1 (shown in Fig. 3) might be related to the role of collisions with H atoms and the inadequacy of the Drawins formalism. The close agreement of the LTE abundances derived from the different multiplets suggests that they are all formed close to LTE conditions.
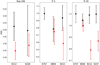 |
Fig. 3 Mean LTE (black) and NLTE (red) sulfur abundances obtained from the different lines in the spectra of Rup 106 (left panel), Tr 5 (middle panel), and Tr 20 (right panel). The error bars are the standard deviation of the A(S) measures for each line, from all the stars in a cluster. |
4.6 Comparison with the literature
Figure 4 shows the [S/Fe] versus [Fe/H] diagrams of the targets before (bottom panel) and after (top panel) the NLTE corrections. The error bars were calculated with the error propagation, combining the uncertainties on A(S) and [Fe/H] in quadrature.
We find Rup 106 to be the object with the lowest S content in both diagrams. These results represent the first A(S) measurement for the stars of Rup 106. Therefore, a comparison with the literature cannot be shown.
Caffau et al. (2014) analyzed the star #3416 of Tr 5 (blue circle in Fig. 4). In this work, we analyzed the same star (green circle in Fig. 4) and a further five targets in Tr 5. Our [S/Fe]LTE value for star #3416 is in good agreement with the findings of Caffau et al. (2014). On the other hand, after NLTE corrections, our value of [S/Fe]NLTE = 0.19 is higher than that of Caffau et al. (2014, [S/Fe]NLTE = −0.20) by ~0.4 dex. We investigated the origin of this discrepancy. The first factor to take into account is the features used. For #3416, we measured A(S) from lines at 6757 Å (Mult. 8), 8694 Å (Mult. 6), and 9212 Å (Mult. 1), while Caffau et al. (2014) used the two Mult. 1 lines at 9212 and 9228 Å. As previously shown, the line of Mult. 6 is less affected by LTE deviation than those of Mult. 1. Instead, the NLTE corrections for the line at 6757 Å are negligible (Takeda et al. 2005). Consequentially, our result for A(S)NLTE is given considering two lines almost at LTE and one line that is strongly affected by LTE deviations. On the other hand, Caffau et al. (2014) used only lines with high NLTE corrections. For #3416, we obtain A(S)LTE = 7.05, 6.85, and 7.04 from Mult. 8, 6, and 1, respectively. The NLTE corrections lead to A(S)NLTE = 6.81 and 6.67 from Mult. 6 and 1, respectively. Thus, the main contribution to our NLTE correction for star #3416 is given by the Δ = −0.37 for line at 9212 Å. Instead, Caffau et al. (2014) found Δ ~ −0.51 for Mult. 1 lines.
The atmospheric parameters is another factor to consider. We analyzed the effect of varying the atmospheric parameters on NLTE corrections. Indeed, we found Teff = 4869, log ɡ = 2.52, ξ=1.27, and [Fe/H] = −0.51 for #3416, while Caffau et al. (2014) adopted Teff=4870, log ɡ = 2.05, ξ = 1.33, and [Fe/H] = −0.53. Therefore, it is the surface gravity that is different by almost 0.5 dex. According to Takeda et al. (2005) and Korotin et al. (2020), the NLTE corrections and the surface gravity are inversely proportional. Varying the surface gravity of 0.5 dex, we obtained a difference in the A(S)NLTE from the lines of ~0.18 dex. We infer that the difference between the Caffau et al. (2014) [S/Fc]NLTE values and ours is due to the different features used and to the different surface gravity used.
In the right panels of Fig. 4, we compared our results for Tr 20 and those obtained by Duffau et al. (2017). In general, we find a lower [S/Fe] value by ~0.19 dex. Also in this case, we investigated the origin of this difference. Duffau et al. (2017) used Mult. 8 lines, which are almost unaffected by LTE deviations. Instead, our results were obtained from Mult. 8, 6, and 1. Table 5 shows the A(S)LTE and A(S)NLTE obtained from each line. As mentioned above, we found < Δ >~ −0.05 for Mult. 6 lines. On the other hand, the NLTE corrections of Mult. 1 lines lead to a difference of ~0.2 dex between S abundances obtained from them and Mult. 8 lines. Considering the atmospheric parameters, the mean difference between our values and those obtained by Duffau et al. (2017) are < ΔTeff >= 97 K, < Δ log ɡ >= 0.05, < Δξ >= 0.29 km s−1, < Δ[Fe/H] >= 0.05. According to our uncertainty analysis, these values lead to a difference in S abundance of about 0.18 dex. In conclusion, the different features and the atmospheric parameters adopted explain the difference between our analysis and that of Duffau et al. (2017).
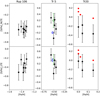 |
Fig. 4 [S/Fe] versus [Fe/H] diagram before (bottom panels) and after (top panels) NLTE corrections applied to the A(S) obtained in this work for Rup 106 (left), Tr 5 (middle), and Tr2O (right) stars. In the middle panels, the results obtained by Caffau et al. (2014) for the star #3416 are reported in blue. Our results for the same star are highlighted in green. In the right panels, our results are compared with those of Duffau et al. (2017, red points). |
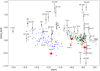 |
Fig. 5 [S/Fe]NLTE vs. [Fe/H] for the clusters analyzed in this work (red squares) compared to the literature. The blue open circles are the results obtained by Jönsson et al. (2011) for metal-poor stars. The Sculptor dSph galaxy (Skúladóttir et al. 2015) and the Galactic bulge (Lucertini et al. 2022) are shown as blue and gray stars, respectively. The green squares are the results of Ecuvillon et al. (2004) for planet-host stars and solar-type dwarfs. The black diamond symbols represent the Galactic halo GCs M4, M22, and M3O analyzed by Kacharov et al. (2015). The extremely metalpoor stars from the large program “First stars” (Cayrel & Spite 2004) analyzed by Spite et al. (2011) are shown by the LP point. The point MP stars are targets with [Fe/H] < −1.0 analyzed by Matrozis et al. (2013). The black points are GCs and OCs: NGC 6397 (Koch & Caffau 2011); NGC 6752 and 47 Tue (Sbordone et al. 2009); Terzan 7 (Caffau et al. 2005b); M 4, Trumpler 5, NGC 5822, and NGC 2477 (Caffau et al. 2014). The clusters from Duffau et al. (2017) and GES DR5 are shown as crossed squares and triangles, respectively. All the points have been scaled to our adopted solar abundances A(S)⊙ = 7.16 and A(Fe)⊙ = 7.52 (Caffau et al. 2011). |
5 Discussion
So far, only a few clusters of the MW were considered to investigate the behavior of S. In this work, we present S abundances in the GC Rup 106 and the OCs Tr 5 and Tr 20.
We decided to compare our results (red squares) with the literature in the [S/Fe]NLTE versus [Fe/H] (Fig. 5) and [S/Fc]LTE versus [Fe/H] (Fig. 6) diagrams. These figures are updated versions of Fig. 9 of Duffau et al. (2017). The blue open circles are the results obtained by Jönsson et al. (2011) for metal-poor giant stars using Mult. 3 and the forbidden [SI] line at 1082 nm. The results obtained by Skúladóttir et al. (2015) for the stars of the Sculptor dwarf spheroidal (dSph) galaxy are shown as blue stars. These latter authors estimated A(S) from Mult. 1 features. The gray stars are Galactic bulge stars analyzed by Lucertini et al. (2022) using Mult. 8, 6, and 1. Ecuvillon et al. (2004) estimated S abundances in a large set of planet host stars and solar-type dwarfs with no known planetary-mass companions. Their S abundances, which were obtained from Mult. 8, are reported in Fig. 5 as green squares. The black diamonds symbols represent the Galactic halo GCs M4, M22, and M30 analyzed by Kacharov et al. (2015) using Mult. 3 lines. The average in metallicity and [S/Fe] for the stars with [Fe/H]< −2.9 found by Spite et al. (2011) from Mult. 1 lines is reported as “LP stars” (where LP refers to the ESO large programme “First Stars” described in Cayrel & Spite 2004). Matrozis et al. (2013) analyzed metal-poor giant stars in the metallicity range −2.5 < [Fe/H] < 0.0 in order to obtain A(S) from the forbidden [SI] line at 1082 nm. The MP star point represents the average in metallicity and [S/Fe] for the stars with [Fe/H] < −1.0 from this work. The black points are the GCs and OCs results in the literature, which were obtained using Mult. 1 and 8: NGC 6397 from Koch & Caffau (2011); NGC 6752 and 47 Tuc from Sbordone et al. (2009); Terzan7 from Caffau et al. (2005b); and M4, Trumpler 5, NGC 5822, and NGC 2477 from Caffau et al. (2014). The [S/Fe] values measured by Duffau et al. (2017) are displayed in Fig. 5 as crossed black squares. Finally, we updated the diagram adding the results from the Gaia-ESO Survey Data Release 5 (GES DR5, black triangles). In particular, we selected targets with a membership probability of MEM3D > 0.9 and reliable S abundances (σA(S) ≤ 0.2 dex). In order to facilitate the comparison with our outcomes, we highlighted the results for Tr 5 from Caffau et al. (2014, red point) and those for Tr 20 from Duffau et al. (2017, crossed red square) and GES DR5 (red triangle).
5.1 [S/Fe]NLTE versus [Fe/H] diagram
Tr 20 is characterized by nearly solar [α/Fe] ratios (Magrini et al. 2014; Carraro et al. 2014; Donati et al. 2014). Among the different works in the literature, Duffau et al. (2017) and GES DR5 are the only ones that estimated S abundances in Tr 20. These works confirmed that S behaves like the other a-elements in this OC. We find an S content of Tr 20 of about [S/Fe]NLTE = −0.28 ±0.21. In Fig. 5, this value (red square) is in agreement within errors with that from GES DR5 (red triangle). On the other hand, it is lower than that obtained by Duffau et al. (2017, crossed red square) by ~0.19 dex. We claim that this discrepancy is due to the choice of atmospheric parameters and lines analyzed.
Figure 5 reveals the low S content of Rup 106 (red square) with respect to the other Galactic objects of similar metallicity. In particular, we obtained a mean [S/Fe]NLTE = −0.52±0.13 for Rup 106. This confirms that S behaves like the other α-elements in this GC. Indeed, the over-deficiency of α-elements in Rup 106 was already assessed by Brown et al. (1996, 1997), Pritzl et al. (2005), Villanova et al. (2013), François (2014), and Frelijj et al. (2021). The low content of a-elements suggests that Rup106 experienced different nucleosynthesis processes from the majority of the Galactic halo and nearby clusters. Therefore, it is reasonable to propose an extragalactic origin for this object, as suggested by several works in the literature (Lin & Richer 1992; Brown et al. 1996; Villanova et al. 2013; François 2014; Frelijj et al. 2021; Callingham et al. 2022).
For Tr 5 stars (red square), we found a mean [S/Fe]NLTE value of 0.05±0.20. As shown in Fig. 5, this value is ~0.4 dex higher than that of Caffau et al. (2014, red point). Caffau et al. (2014) concluded that the Tr 5 star #3416 is S-poor with respect to the Galactic clusters at the same metallicity. Moreover, these authors found a similar behavior for Tr 5 and the Sagittarius cluster Terzan 7 in the [S/Fe]NLTE versus [Fe/H] diagram. According to our results, the S content of Tr 5 is higher than that of Terzan 7 by ~0.16 dex. In Fig. 5, Tr 5 lies close to the Galactic OCs NGC 2243 and Berkely 25 analyzed by Duffau et al. (2017, black crossed squares). Comparing our result with those of Lucertini et al. (2022), Tr 5 is located in the region of the [S/Fe]NLTE versus [Fe/H] diagram that describes the Galactic thick disk. In conclusion, we can confirm that Tr 5 shows a similar behavior to that of the Galactic disk.
5.2 [S/Fe]LTE versus [Fe/H] diagram
We reproduced Fig. 5 in the [S/Fe]LTE versus [Fe/H] diagram (Fig. 6) with the available data. The samples displayed are the same as those described above.
In Fig. 6, Tr 20 (red square) is in agreement within the errors with the findings of Duffau et al. (2017, crossed red square) and GES DR5 (red triangle). In the [S/Fe]LTE versus [Fe/H] diagram, Rup 106 is characterized by a lower S content than the Galactic clusters and the Local Group Sculptor dSph galaxy (blue stars). This supports the extragalactic origin of Rup 106. The Magellanic Clouds (Lin & Richer 1992), Sagittarius dSph galaxy (Bellazzini et al. 2003; Frelijj et al. 2021), and the Helmi stream (Massari et al. 2019; Bajkova et al. 2020) were proposed as progenitors of Rup 106. As no S abundances were estimated in these objects, a direct comparison is impossible. Consequently, to date, the investigation of S does not provide further clues as to the origin of Rup 106.
Our result (red square) and that obtained by Caffau et al. (2014, red point) for Tr 5 are in agreement within their errors. In the [S/Fe]LTE versus [Fe/H] diagram, our result for Tr 5 lies in the Galactic thick-disk region.
6 Summary and conclusions
Here, we present our study of the sulfur content of the GC Rup 106 and the OC Tr 5. In particular, we investigated the S abundances in Rup 106 for the first time to investigate the low level of a-elements in this object. As the only star of Tr 5 studied so far has been claimed to be S-poor, we analyzed a larger sample in order to obtain clues as to the behavior of S in Tr 5. This work provides the Fe and S abundances for Rup 106, Tr 5, and the OC Tr 20. This latter object was taken into account for reference, and its results are consistent within the errors with those of Duffau et al. (2017) and GES DR5. Below we summarize our main findings for the clusters analyzed in this work.
The Fe contents of Rup 106 and Tr 5 are −1.37±0.11 and −0.49±0.14, respectively.
Rup 106 is S-poor with respect to the other Galactic clusters of similar metallicity. We obtain [S/Fe]NLTE = −0.52±0.13 for this GC, which is in agreement with the low a-element content of this object (Brown et al. 1996, 1997, Pritzl et al. 2005, Villanova et al. 2013, François 2014, Frelijj et al. 2021).
Our S abundance measurement for the star #3416 of Tr 5 is in agreement within the errors with the findings of Caffau et al. (2014). We obtained a new and more robust result for S in this OC based on a larger sample of targets. We found an S content for Tr 5 of about [S/Fe]NTLE = 0.05±0.20.
The metallicity and the S content of Tr 20 are [Fe/H] = 0.06±0.15 and [S/Fe]NLTE = −0.28±0.21, respectively.
In summary, our conclusions are that Tr 5 behaves similarly to the Galactic disk and that Rup 106 experienced a different nucleosynthesis process from the Galactic halo clusters, supporting the notion that it is an accreted GC that formed outside the MW. Finally, Tr 20 is an OC belonging and formed in the MW.
Acknowledgements
Support for the author F.L. is provided by CONICYTPFCHA/Doctorado Nacional año 2020-folio 21200677. E.C. and P.B. acknowledge support from the Agence Nationale de la Recherche (ANR project ANR-18-CE31-0017). S.V. gratefully acknowledges the support provided by Fondecyt reg. 1220264, the ANID BASAL projects ACE210002 and FB210003. This work has made use of data from the European Space Agency (ESA) mission Gaia (https://www.cosmos.esa.int/gaia), processed by the Gaia Data Processing and Analysis Consortium (DPAC, https://www.cosmos.esa.int/web/gaia/dpac/consortium). Funding for the DPAC has been provided by national institutions, in particular the institutions participating in the Gaia Multilateral Agreement. The Gaia-ESO Survey is based on observations made with ESO Telescopes at the La Silla or Paranal Observatories under programme ID(s) 072.D-0019(B), 072.D-0309(A), 072.D-0337(A), 072.D-0406(A), 072.D-0507(A), 072.D-0742(A), 072.D-0777(A), 073.C-0251(B), 073.C-0251(C), 073.C-0251(D), 073.C-0251(E), 073.C-0251(F), 073.D-0100(A), 073.D-0211(A), 073.D-0550(A), 073.D-0695(A), 073.D-0760(A), 074.D-0571(A), 075.C-0245(A), 075.C-0245(C), 075.C-0245(D), 075.C-0245(E), 075.C-0245(F), 075.C-0256(A), 075.D-0492(A), 076.B-0263(A), 076.D-0220(A), 077.C-0655(A), 077.D-0246(A), 077.D-0484(A), 078.D-0825(A), 078.D-0825(B), 078.D-0825(C), 079.B-0721(A), 079.D-0178(A), 079.D-0645(A), 079.D-0674(A), 079.D-0674(B), 079.D-0674(C), 079.D-0825(B), 079.D-0825(C), 079.D-0825(D), 080.B-0489(A), 080.B-0784(A), 080.C-0718(A), 081.D-0253(A), 081.D-0287(A), 082.D-0726(A), 083.B-0083(A), 083.D-0208(A), 083.D-0671(A), 083.D-0682(A), 083.D-0798(B), 084.D-0470(A), 084.D-0693(A), 084.D-0933(A), 085.D-0205(A), 086.D-0141(A), 087.D-0203(B), 087.D-0230(A), 087.D-0276(A), 088.B-0403(A), 088.B-0492(A), 088.C-0239(A), 088.D-0026(A), 088.D-0026(B), 088.D-0026(C), 088.D-0026(D), 088.D-0045(A), 089.D-0038(A), 089.D-0298(A), 089.D-0579(A), 090.D-0487(A), 091.D-0427(A), 092.D-0171(C), 092.D-0477(A), 093.D-0286(A), 093.D-0818(A), 094.D-0363(A), 094.D-0455(A), 171.D-0237(A), 187.B-0909(A), 188.B-3002(A), 188.B-3002(B), 188.B-3002(C), 188.B-3002(D).
Appendix A ATLAS 9 versus ATLAS 12 models
The comparison of these two classes of models has been made several times; we here refer the reader to section 9 of Castelli (2005). In that paper, the algorithm of opacity sampling is described and details on how to run ATLAS 12 are provided. It has to be understood that the two versions of ATLAS codes are not identical, meaning that some small differences between the models are to be expected. In Fig. A.1 we compare the temperature structures of two models appropriate for the study of star # 1318 in Trumpler 5. Up to log(τ) = −2.8 the two models are identical, for the outer layers the ATLAS 12 model is about 70 K cooler. For all lines that form deeper than log(τ) = −2.8, that is the case of the sulfur lines, the two models will provide identical results. A comparison of the accuracy or strength of the two classes of models has not been carried out. Computationally, the ATLAS 12 model takes over 30 times longer than the ATLAS 9 model.
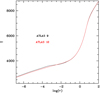 |
Fig. A.1 Comparison of the temperature structure of an ATLAS 9 (black) and an ATLAS 12 model with Teff= 4582, log g = 2.55, metallicity −0.5, and microturbulence 2 km s−1. |
References
- Bajkova, A.T., Carraro, G., Korchagin, V.I., Budanova, N.O., & Bobylev, V.V. 2020, ApJ, 895, 69 [NASA ADS] [CrossRef] [Google Scholar]
- Barklem, P.S., Belyaev, A.K., Guitou, M., et al. 2011, A&A, 530, A94 [NASA ADS] [CrossRef] [EDP Sciences] [Google Scholar]
- Bellazzini, M., Ferraro, F.R., & Ibata, R. 2003, AJ, 125, 188 [NASA ADS] [CrossRef] [Google Scholar]
- Bernstein, R., Shectman, S.A., Gunnels, S.M., Mochnacki, S., & Athey, A.E. 2003, SPIE Conf. Ser., 4841, 1694 [NASA ADS] [Google Scholar]
- Bertaux, J.-L., Lallement, R., Ferron, S., & Boonne, C. 2014, in 13th International HITRAN Conference, 8 [Google Scholar]
- Bonifacio, P., Spite, M., Cayrel, R., et al. 2009, A&A, 501, 519 [NASA ADS] [CrossRef] [EDP Sciences] [Google Scholar]
- Bragaglia, A., Sestito, P., Villanova, S., et al. 2008, A&A, 480, 79 [NASA ADS] [CrossRef] [EDP Sciences] [Google Scholar]
- Bressan, A., Marigo, P., Girardi, L., et al. 2012, MNRAS, 427, 127 [NASA ADS] [CrossRef] [Google Scholar]
- Brown, J.A., Wallerstein, G., & Zucker, D. 1996, ASP Conf. Ser., 92, 355 [NASA ADS] [Google Scholar]
- Brown, J.A., Wallerstein, G., & Zucker, D. 1997, AJ, 114, 180 [NASA ADS] [CrossRef] [Google Scholar]
- Buonanno, R., Buscema, G., Fusi Pecci, F., Richer, H.B., & Fahlman, G.G. 1990, AJ, 100, 1811 [NASA ADS] [CrossRef] [Google Scholar]
- Buonanno, R., Corsi, C.E., Pecci, F.F., Richer, H.B., & Fahlman, G.G. 1993, AJ, 105, 184 [NASA ADS] [CrossRef] [Google Scholar]
- Caffau, E., & Ludwig, H.G. 2007, A&A, 467, L11 [NASA ADS] [CrossRef] [EDP Sciences] [Google Scholar]
- Caffau, E., Bonifacio, P., Faraggiana, R., et al. 2005a, A&A, 441, 533 [NASA ADS] [CrossRef] [EDP Sciences] [Google Scholar]
- Caffau, E., Bonifacio, P., Faraggiana, R., & Sbordone, L. 2005b, A&A, 436, L9 [NASA ADS] [CrossRef] [EDP Sciences] [Google Scholar]
- Caffau, E., Faraggiana, R., Bonifacio, P., Ludwig, H.G., & Steffen, M. 2007, A&A, 470, 699 [NASA ADS] [CrossRef] [EDP Sciences] [Google Scholar]
- Caffau, E., Sbordone, L., Ludwig, H.G., Bonifacio, P., & Spite, M. 2010, Astron. Nachr., 331, 725 [NASA ADS] [CrossRef] [Google Scholar]
- Caffau, E., Ludwig, H.G., Steffen, M., Freytag, B., & Bonifacio, P. 2011, Sol. Phys., 268, 255 [NASA ADS] [CrossRef] [Google Scholar]
- Caffau, E., Monaco, L., Spite, M., et al. 2014, A&A, 568, A29 [NASA ADS] [CrossRef] [EDP Sciences] [Google Scholar]
- Callingham, T.M., Cautun, M., Deason, A.J., et al. 2022, MNRAS, 513, 4107 [NASA ADS] [CrossRef] [Google Scholar]
- Cantat-Gaudin, T., Anders, F., Castro-Ginard, A., et al. 2020, A&A, 640, A1 [NASA ADS] [CrossRef] [EDP Sciences] [Google Scholar]
- Cardelli, J.A., Clayton, G.C., & Mathis, J.S. 1989, IAU Symp., 135, 5 [NASA ADS] [Google Scholar]
- Carraro, G., Villanova, S., Monaco, L., et al. 2014, A&A, 562, A39 [NASA ADS] [CrossRef] [EDP Sciences] [Google Scholar]
- Carrera, R., & Pancino, E. 2011, A&A, 535, A30 [NASA ADS] [CrossRef] [EDP Sciences] [Google Scholar]
- Carrera, R., Gallart, C., Pancino, E., & Zinn, R. 2007, AJ, 134, 1298 [NASA ADS] [CrossRef] [Google Scholar]
- Castelli, F. 2005, Mem. della Soc. Astron. It. Suppl., 8, 25 [Google Scholar]
- Castelli, F., & Kurucz, R.L. 2003, IAU Symp. 210, A20 [NASA ADS] [Google Scholar]
- Cayrel, R., & Spite, M. 2004, The Messenger, 118, 58 [NASA ADS] [Google Scholar]
- Chen, Y.Q., Nissen, P.E., Zhao, G., & Asplund, M. 2002, A&A, 390, 225 [NASA ADS] [CrossRef] [EDP Sciences] [Google Scholar]
- Clegg, R.E.S., Lambert, D.L., & Tomkin, J. 1981, ApJ, 250, 262 [NASA ADS] [CrossRef] [Google Scholar]
- Cole, A.A., Smecker-Hane, T.A., Tolstoy, E., Bosler, T.L., & Gallagher, J.S. 2004, MNRAS, 347, 367 [NASA ADS] [CrossRef] [Google Scholar]
- Cutri, R.M., Skrutskie, M.F., van Dyk, S., et al. 2003, VizieR Online Data Catalog: II/246 [Google Scholar]
- Da Costa, G.S., Armandroff, T.E., & Norris, J.E. 1992, AJ, 104, 154 [CrossRef] [Google Scholar]
- Dekker, H., D’Odorico, S., Kaufer, A., Delabre, B., & Kotzlowski, H. 2000, SPIE, 4008, 534 [Google Scholar]
- Dias, W.S., Alessi, B.S., Moitinho, A., & Lépine, J.R.D. 2002, A&A, 389, 871 [NASA ADS] [CrossRef] [EDP Sciences] [Google Scholar]
- Donati, P., Cantat Gaudin, T., Bragaglia, A., et al. 2014, A&A, 561, A94 [NASA ADS] [CrossRef] [EDP Sciences] [Google Scholar]
- Donati, P., Cocozza, G., Bragaglia, A., et al. 2015, MNRAS, 446, 1411 [NASA ADS] [CrossRef] [Google Scholar]
- Dotter, A., Sarajedini, A., & Anderson, J. 2011, ApJ, 738, 74 [NASA ADS] [CrossRef] [Google Scholar]
- Dotter, A., Milone, A.P., Conroy, C., Marino, A.F., & Sarajedini, A. 2018, ApJ, 865, L10 [NASA ADS] [CrossRef] [Google Scholar]
- Drawin, H.W. 1969, Z. Phys., 228, 99 [NASA ADS] [CrossRef] [Google Scholar]
- Duffau, S., Caffau, E., Sbordone, L., et al. 2017, A&A, 604, A128 [NASA ADS] [CrossRef] [EDP Sciences] [Google Scholar]
- Dutra-Ferreira, L., Pasquini, L., Smiljanic, R., Porto de Mello, G.F., & Steffen, M. 2016, A&A, 585, A75 [NASA ADS] [CrossRef] [EDP Sciences] [Google Scholar]
- Ecuvillon, A., Israelian, G., Santos, N.C., et al. 2004, A&A, 426, 619 [NASA ADS] [CrossRef] [EDP Sciences] [Google Scholar]
- François, P. 1987, A&A, 176, 294 [NASA ADS] [Google Scholar]
- François, P. 1988, IAU Symp., 132, 521 [Google Scholar]
- François, P. 2014, Mem. Soc. Astron. Ital Suppl., 85, 303 [Google Scholar]
- François, P., Danziger, J., Buonanno, R., & Perrin, M.N. 1997, A&A, 327, 121 [Google Scholar]
- Frelijj, H., Villanova, S., Muñoz, C., & Fernández-Trincado, J.G. 2021, MNRAS, 503, 867 [NASA ADS] [CrossRef] [Google Scholar]
- Gaia Collaboration (Prusti, T., et al.) 2016, A&A, 595, A1 [NASA ADS] [CrossRef] [EDP Sciences] [Google Scholar]
- Gaia Collaboration (Brown, A.G.A., et al.) 2021, A&A, 649, A1 [NASA ADS] [CrossRef] [EDP Sciences] [Google Scholar]
- Gilmore, G., Randich, S., Asplund, M., et al. 2012, The Messenger, 147, 25 [NASA ADS] [Google Scholar]
- Griffith, E., Weinberg, D.H., Johnson, J.A., et al. 2021, ApJ, 909, 77 [NASA ADS] [CrossRef] [Google Scholar]
- Gustafsson, B., Edvardsson, B., Eriksson, K., et al. 2008, A&A, 486, 951 [NASA ADS] [CrossRef] [EDP Sciences] [Google Scholar]
- Harris, W.E. 2010, ArXiv e-prints [arXiv:1012.3224] [Google Scholar]
- Heiter, U., Lind, K., Bergemann, M., et al. 2021, A&A, 645, A106 [EDP Sciences] [Google Scholar]
- Israelian, G., & Rebolo, R. 2001, ApJ, 557, L43 [Google Scholar]
- Jönsson, H., Ryde, N., Nissen, P.E., et al. 2011, A&A, 530, A144 [NASA ADS] [CrossRef] [EDP Sciences] [Google Scholar]
- Kacharov, N., Koch, A., Caffau, E., & Sbordone, L. 2015, A&A, 577, A18 [NASA ADS] [CrossRef] [EDP Sciences] [Google Scholar]
- Kaluzny, J. 1998, A&AS, 133, 25 [NASA ADS] [CrossRef] [EDP Sciences] [Google Scholar]
- Kim, S.C., Kyeong, J., & Sung, E.-C. 2009, J. Korean Astron. Soc., 42, 135 [NASA ADS] [CrossRef] [Google Scholar]
- Koch, A., & Caffau, E. 2011, A&A, 534, A52 [NASA ADS] [CrossRef] [EDP Sciences] [Google Scholar]
- Korotin, S.A., Andrievsky, S.M., Caffau, E., Bonifacio, P., & Oliva, E. 2020, MNRAS, 496, 2462 [NASA ADS] [CrossRef] [Google Scholar]
- Kurucz, R. 1993a, ATLAS9 Stellar Atmosphere Programs and 2 km/s grid. Kurucz CD-ROM No. 13. Cambridge, 13 [Google Scholar]
- Kurucz, R.L. 1993b, SYNTHE Spectrum Synthesis Programs and Line Data (Cambridge, Mass.: Smithsonian Astrophysical Observatory) [Google Scholar]
- Kurucz, R.L. 2005, Mem. Soc. Astron. Ital Suppl., 8, 14 [Google Scholar]
- Lin, D.N.C., & Richer, H.B. 1992, ApJ, 388, L57 [NASA ADS] [CrossRef] [Google Scholar]
- Lucertini, F., Monaco, L., Caffau, E., Bonifacio, P., & Mucciarelli, A. 2022, A&A, 657, A29 [NASA ADS] [CrossRef] [EDP Sciences] [Google Scholar]
- Magrini, L., Randich, S., Romano, D., et al. 2014, A&A, 563, A44 [NASA ADS] [CrossRef] [EDP Sciences] [Google Scholar]
- Massari, D., Koppelman, H.H., & Helmi, A. 2019, A&A, 630, L4 [NASA ADS] [CrossRef] [EDP Sciences] [Google Scholar]
- Matrozis, E., Ryde, N., & Dupree, A.K. 2013, A&A, 559, A115 [NASA ADS] [CrossRef] [EDP Sciences] [Google Scholar]
- Monaco, L., Boffin, H.M.J., Bonifacio, P., et al. 2014, A&A, 564, L6 [NASA ADS] [CrossRef] [EDP Sciences] [Google Scholar]
- Mucciarelli, A., Pancino, E., Lovisi, L., Ferraro, F.R., & Lapenna, E. 2013, Astrophysics Source Code Library [record ascl:1302.011] [Google Scholar]
- Nissen, P.E., Chen, Y.Q., Asplund, M., & Pettini, M. 2004, A&A, 415, 993 [NASA ADS] [CrossRef] [EDP Sciences] [Google Scholar]
- Nissen, P.E., Akerman, C., Asplund, M., et al. 2007, A&A, 469, 319 [NASA ADS] [CrossRef] [EDP Sciences] [Google Scholar]
- Pancino, E., Carrera, R., Rossetti, E., & Gallart, C. 2010, A&A, 511, A56 [NASA ADS] [CrossRef] [EDP Sciences] [Google Scholar]
- Pasquini, L., Avila, G., Blecha, A., et al. 2002, The Messenger, 110, 1 [Google Scholar]
- Piatti, A.E., Clariá, J.J., & Ahumada, A.V. 2004, MNRAS, 349, 641 [NASA ADS] [CrossRef] [Google Scholar]
- Platais, I., Melo, C., Fulbright, J.P., et al. 2008, MNRAS, 391, 1482 [NASA ADS] [CrossRef] [Google Scholar]
- Platais, I., Melo, C., Quinn, S.N., et al. 2012, ApJ, 751, L8 [NASA ADS] [CrossRef] [Google Scholar]
- Plez, B. 2012, Astrophysics Source Code Library [record ascl:1205.004] [Google Scholar]
- Pritzl, B.J., Venn, K.A., & Irwin, M. 2005, AJ, 130, 2140 [NASA ADS] [CrossRef] [Google Scholar]
- Ramaty, R., Lingenfelter, R.E., & Kozlovsky, B. 2001, New A Rev., 45, 587 [NASA ADS] [CrossRef] [Google Scholar]
- Randich, S., Gilmore, G., & Gaia-ESO Consortium. 2013, The Messenger, 154, 47 [NASA ADS] [Google Scholar]
- Riello, M., De Angeli, F., Evans, D.W., et al. 2021, A&A, 649, A3 [NASA ADS] [CrossRef] [EDP Sciences] [Google Scholar]
- Ryde, N. 2006, A&A, 455, L13 [NASA ADS] [CrossRef] [EDP Sciences] [Google Scholar]
- Sbordone, L., Limongi, M., Chieffi, A., et al. 2009, A&A, 503, 121 [NASA ADS] [CrossRef] [EDP Sciences] [Google Scholar]
- Sestito, P., Bragaglia, A., Randich, S., et al. 2008, A&A, 488, 943 [NASA ADS] [CrossRef] [EDP Sciences] [Google Scholar]
- Skúladóttir, Á., Andrievsky, S.M., Tolstoy, E., et al. 2015, A&A, 580, A129 [NASA ADS] [CrossRef] [EDP Sciences] [Google Scholar]
- Spite, M., Caffau, E., Andrievsky, S.M., et al. 2011, A&A, 528, A9 [NASA ADS] [CrossRef] [EDP Sciences] [Google Scholar]
- Steenbock, W., & Holweger, H. 1984, A&A, 130, 319 [NASA ADS] [Google Scholar]
- Stetson, P.B., & Pancino, E. 2008, PASP, 120, 1332 [NASA ADS] [CrossRef] [Google Scholar]
- Takeda, Y., & Takada-Hidai, M. 2011, PASJ, 63, 537 [NASA ADS] [Google Scholar]
- Takeda, Y., Hashimoto, O., Taguchi, H., et al. 2005, PASJ, 57, 751 [NASA ADS] [Google Scholar]
- Tautvaišienė, G., Drazdauskas, A., Mikolaitis, S., et al. 2015, A&A, 573, A55 [NASA ADS] [CrossRef] [EDP Sciences] [Google Scholar]
- VandenBerg, D.A., Brogaard, K., Leaman, R., & Casagrande, L. 2013, ApJ, 775, 134 [NASA ADS] [CrossRef] [Google Scholar]
- Villanova, S., Geisler, D., Carraro, G., Moni Bidin, C., & Muñoz, C. 2013, ApJ, 778, 186 [Google Scholar]
- Yong, D., Carney, B.W., & Friel, E.D. 2012, AJ, 144, 95 [NASA ADS] [CrossRef] [Google Scholar]
All Tables
LTE and NLTE sulfur abundances obtained line by line for the stars analyzed in this work.
All Figures
|
Fig. 1 G versus GBP – GRP CMD of the clusters considered in this work: Rup 106 (left), Tr 5 (middle), and Tr 20 (right). The sample of stars analyzed in this work is shown by the red squares. |
| In the text | |
|
Fig. 2 Observed spectrum of the Tr 20 star #542 (black) superimposed with the best-fit synthetic spectrum (dashed red). The green and purple profiles are synthetic spectrum with +0.2 dex and −0.2 dex in A(S), respectively. The TAPAS profile is also shown (dotted blue). The red vertical lines indicate the sulfur features. |
| In the text | |
|
Fig. 3 Mean LTE (black) and NLTE (red) sulfur abundances obtained from the different lines in the spectra of Rup 106 (left panel), Tr 5 (middle panel), and Tr 20 (right panel). The error bars are the standard deviation of the A(S) measures for each line, from all the stars in a cluster. |
| In the text | |
|
Fig. 4 [S/Fe] versus [Fe/H] diagram before (bottom panels) and after (top panels) NLTE corrections applied to the A(S) obtained in this work for Rup 106 (left), Tr 5 (middle), and Tr2O (right) stars. In the middle panels, the results obtained by Caffau et al. (2014) for the star #3416 are reported in blue. Our results for the same star are highlighted in green. In the right panels, our results are compared with those of Duffau et al. (2017, red points). |
| In the text | |
|
Fig. 5 [S/Fe]NLTE vs. [Fe/H] for the clusters analyzed in this work (red squares) compared to the literature. The blue open circles are the results obtained by Jönsson et al. (2011) for metal-poor stars. The Sculptor dSph galaxy (Skúladóttir et al. 2015) and the Galactic bulge (Lucertini et al. 2022) are shown as blue and gray stars, respectively. The green squares are the results of Ecuvillon et al. (2004) for planet-host stars and solar-type dwarfs. The black diamond symbols represent the Galactic halo GCs M4, M22, and M3O analyzed by Kacharov et al. (2015). The extremely metalpoor stars from the large program “First stars” (Cayrel & Spite 2004) analyzed by Spite et al. (2011) are shown by the LP point. The point MP stars are targets with [Fe/H] < −1.0 analyzed by Matrozis et al. (2013). The black points are GCs and OCs: NGC 6397 (Koch & Caffau 2011); NGC 6752 and 47 Tue (Sbordone et al. 2009); Terzan 7 (Caffau et al. 2005b); M 4, Trumpler 5, NGC 5822, and NGC 2477 (Caffau et al. 2014). The clusters from Duffau et al. (2017) and GES DR5 are shown as crossed squares and triangles, respectively. All the points have been scaled to our adopted solar abundances A(S)⊙ = 7.16 and A(Fe)⊙ = 7.52 (Caffau et al. 2011). |
| In the text | |
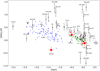 |
Fig. 6 Same as Fig. 5 in the [S/Fe]LTE vs. [Fe/H] diagram. |
| In the text | |
|
Fig. A.1 Comparison of the temperature structure of an ATLAS 9 (black) and an ATLAS 12 model with Teff= 4582, log g = 2.55, metallicity −0.5, and microturbulence 2 km s−1. |
| In the text | |
Current usage metrics show cumulative count of Article Views (full-text article views including HTML views, PDF and ePub downloads, according to the available data) and Abstracts Views on Vision4Press platform.
Data correspond to usage on the plateform after 2015. The current usage metrics is available 48-96 hours after online publication and is updated daily on week days.
Initial download of the metrics may take a while.