Open Access
Fig. 2
Download original image
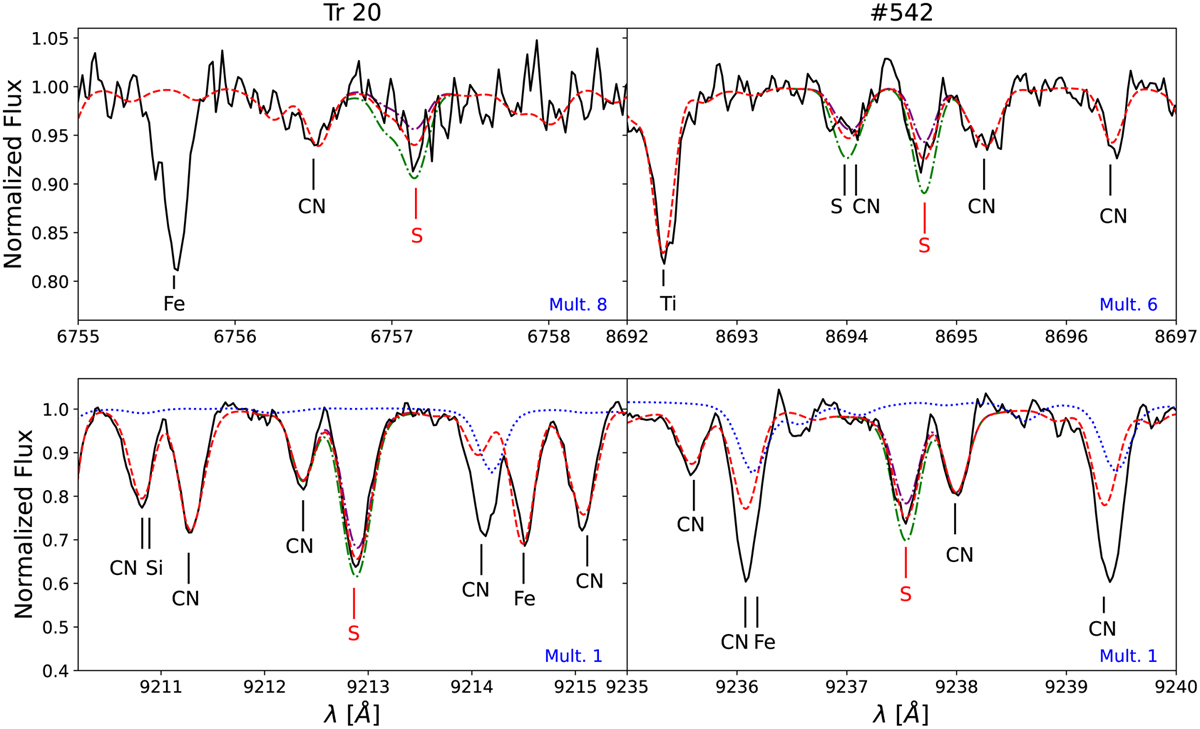
Observed spectrum of the Tr 20 star #542 (black) superimposed with the best-fit synthetic spectrum (dashed red). The green and purple profiles are synthetic spectrum with +0.2 dex and −0.2 dex in A(S), respectively. The TAPAS profile is also shown (dotted blue). The red vertical lines indicate the sulfur features.
Current usage metrics show cumulative count of Article Views (full-text article views including HTML views, PDF and ePub downloads, according to the available data) and Abstracts Views on Vision4Press platform.
Data correspond to usage on the plateform after 2015. The current usage metrics is available 48-96 hours after online publication and is updated daily on week days.
Initial download of the metrics may take a while.