| Issue |
A&A
Volume 659, March 2022
|
|
|---|---|---|
| Article Number | A150 | |
| Number of page(s) | 10 | |
| Section | Stellar structure and evolution | |
| DOI | https://doi.org/10.1051/0004-6361/202142341 | |
| Published online | 21 March 2022 | |
The composition of massive white dwarfs and their dependence on C-burning modeling
1
Instituto de Astrofísica, Pontificia Universidad Católica de Chile, Av. Vicuña Mackenna 4860, 7820436 Macul, Santiago, Chile
e-mail: This email address is being protected from spambots. You need JavaScript enabled to view it.
2
Millennium Institute of Astrophysics, Nuncio Monseñor Sotero Sanz 100, Of. 104, Providencia, Santiago, Chile
e-mail: This email address is being protected from spambots. You need JavaScript enabled to view it.
3
Instituto de Astrofísica de La Plata, CONICET-UNLP, La Plata, Argentina
e-mail: This email address is being protected from spambots. You need JavaScript enabled to view it.
4
Facultad de Ciencias Astronómicas y Geofísicas, UNLP, La Plata, Argentina
Received:
30
September
2021
Accepted:
13
January
2022
Abstract
Context. Recent computations of the interior composition of ultra-massive white dwarfs (WDs) have suggested that some WDs could be composed of neon (Ne)-dominated cores. This result is at variance with our previous understanding of the chemical structure of massive WDs, where oxygen is the predominant element. In addition, it is not clear whether some hybrid carbon (C) oxygen (O)-Ne WDs might form when convective boundary mixing is accounted for during the propagation of the C-flame in the C-burning stage. Both the Ne-dominated and hybrid CO-Ne core would have measurable consequences for asteroseismological studies based on evolutionary models.
Aims. In this work, we explore in detail to which extent differences in the adopted micro- and macro-physics can explain the different final WD compositions that have been found by different authors. Additionally, we explore the impact of such differences on the cooling times, crystallization, and pulsational properties of pulsating WDs.
Methods. We performed numerical simulations of the evolution of intermediate massive stars from the zero age main sequence to the WD stage varying the adopted physics in the modeling. In particular, we explored the impact of the intensity of convective boundary mixing during the C-flash, extreme mass-loss rates, and the size of the adopted nuclear networks on the final composition, age, as well crystallization and pulsational properties of WDs.
Results. In agreement with previous authors, we find that the inclusion of convective boundary mixing quenches the carbon flame leading to the formation of hybrid CO-Ne cores. Based on the insight coming from 3D hydro-dynamical simulations, we expect that the very slow propagation of the carbon flame will be altered by turbulent entrainment affecting the inward propagation of the flame. Also, we find that Ne-dominated chemical profiles of massive WDs recently reported appear in their modeling due to a key nuclear reaction being overlooked. We find that the inaccuracies in the chemical composition of the ultra-massive WDs recently reported lead to differences of 10% in the cooling times and degree of crystallization and about 8% in the period spacing of the models once they reach the ZZ Ceti instability strip.
Key words: stars: evolution / stars: interiors / white dwarfs
© ESO 2022
1. Introduction
White dwarf (WD) stars are the most common end product of stellar evolution. Stars with initial masses below Mini ∼ 8 − 10 M⊙ are known to end their lives as WDs (Winget & Kepler 2008; Althaus et al. 2010). These stars are valuable tools for a wide variety of applications in astrophysics, from being age and distance indicators (García-Berro & Oswalt 2016; Kilic et al. 2017) to laboratories to test extreme physical conditions (Winget et al. 2009; Tremblay et al. 2019; Camisassa et al. 2021). While most of these stars have gone through He-core burning and the asymptotic giant branch (AGB), leading to the formation of carbon (C)-oxygen (O) cores, some other evolutionary paths are possible. Low-mass WDs (M ≲ 0.45 M⊙) are formed by stars in binary systems or with primordially high initial He abundances, which avoid He-core burning and lose their H-rich envelopes already on the first giant branch (RGB), thus harboring He-cores (Althaus et al. 2010). Stars at the boundary between intermediate- and high-mass stars (Mini ∼ 8 − 10 M⊙) are particularly interesting in this respect. These stars reach temperatures that are high enough to ignite their CO cores under degenerate conditions (Garcia-Berro & Iben 1994), and then they evolve into the so-called super AGB (SAGB) phase. Although the basic global properties of SAGB stars are relatively well determined, the final chemical structure left at the end of the phase is still a matter of debate. Classic works by Garcia-Berro & Iben (1994), Ritossa et al. (1996), García-Berro et al. (1997), and Iben et al. (1997) showed that the C-flash and subsequent C-burning leads to a oxygen-neon (ONe) core and, consequently, to an ONe WD (see Siess 2006, 2007, 2010; Camisassa et al. 2019, and references therein) or an electron-capture supernova (Tominaga et al. 2013), depending on the intensity of winds. Denissenkov et al. (2013) claimed that the existence of even a small amount of convective boundary mixing (CBM) below the convective zone generated by the C-flash leads to the quenching of the C-flame and the formation of a hybrid CO-Ne degenerate core. Recently, from the computation of fully evolutionary sequences, Lauffer et al. (2018) found models of WDs with masses higher than 1.15 M⊙, harboring Ne-dominated cores (Ne-O-Mg WDs), and hybrid CO-Ne WD models with a composition significantly different from that obtained by previous works.
As is well known, the properties of the nonradial g-mode pulsations of pulsating WDs are tightly connected to their chemical structure (see, for example Althaus et al. 2021; De Gerónimo et al. 2017). Thus, the precise internal chemical profile of SAGB stars is of the utmost importance for the proper employment of the asteroseismological techniques based on the fully evolutionary models applied to ultra-massive pulsating WDs (see Córsico et al. 2019a; De Gerónimo et al. 2019, and references therein). In this regard, the discrepancy seen in the abundances reported by different authors may alter the results derived not only from asteroseismological analysis, but also from cooling studies. It is not unthinkable that the disparity in the compositions derived by previous authors could be due to the differences in the adopted physical ingredients. In particular, extreme assumptions about the micro- and macro-physics, particularly in regard to overshooting, stellar winds, and/or key nuclear reaction rates, could plausibly lead to the (spurious) predicted formation of exotic objects.
In this paper we assess how the different physical ingredients adopted during C-burning affect the final composition of massive WDs. We specifically focus on the impact of mass-loss rates, the size of the nuclear networks, and the intensity of convective boundary mixing. The paper is organized as follows: in Sect. 2 we provide a brief description of the typical chemical structures on the SAGB. In Sect. 3 we explore the impact of CBM, extreme winds, and the size of the nuclear network, and we discuss their consequences for the final composition of the WD model. Section 4 is devoted to exploring the impact of the different chemical compositions on the cooling times, crystallization, and pulsational properties of DA WDs. Finally, in Sect. 5, we provide some concluding remarks.
2. Chemical signatures of SAGB stars
The evolutionary behavior of SAGB progenitors before carbon ignition is very similar to that of intermediate-mass stars that end up as CO WDs, and it is well documented in a myriad of papers (Garcia-Berro & Iben 1994; Siess 2006, 2010). For the sake of completeness, and to set the stage for the study of the C-burning phase in the next sections, we provide here only a brief description of the previous evolutionary stages.
During the main sequence, SAGB progenitors undergo hydrogen burning via the CNO cycle inside a convective core. Immediately after central hydrogen (H) exhaustion, H-burning sets in in a shell and the helium (He)-core contracts, with the consequent increase in temperature. During this brief red giant phase, the star experiences the first dredge up, polluting the envelope with material previously processed by H-burning. Once temperatures exceed ∼2 × 10⁸ K, helium ignites in the core under nondegenerate conditions, and it burns in a convective core. It is known that CBM during both core H- and He-burning leads to larger convective cores (e.g., Castellani et al. 1985; Ekström et al. 2012; Constantino et al. 2016; Wagstaff et al. 2020) than those predicted by a strict application of the Schwarzschild criterion (Schwarzschild 1906). In our work, CBM during both core H- and He-burning was not included. This choice was motivated by our desire to more directly compare our simulations with those presented by Lauffer et al. (2018), who did not take CBM into account during these earlier phases. The main impact of CBM in these stages is to decrease the initial mass required for a progenitor star to reach C-ignition by about 2 M⊙ (the minimal mass for C-ignition shifting from MZAMS ∼ 8.5 M⊙ to ∼6.5 M⊙ for standard assumptions in CBM, where ZAMS stands for the zero-age main sequence). After the end of core He burning, these objects experience the second dredge up, as do their lower mass counterparts. The second dredge up reduces the mass of the contracting CO core, preventing the ignition of carbon in nondegenerate conditions. Finally, the degenerate CO core eventually reaches a critical mass of MCO ∼ 1.05 M⊙, and carbon ignites.
The detailed chemical structure of SAGB stars is expected to leave its imprint in the interiors of ultra-massive WDs. These features are the signatures of the different physical processes that are operative during the whole evolution in such a way that different regions of the chemical profile can be the trace of individual processes. In particular, the expected core chemical structure found at the SAGB phase for massive progenitors is the result of the evolution through the C-burning stage. Under the assumption of a strict Schwarzschild criterion (Schwarzschild 1906) and no additional mixing processes, the development of carbon burning is characterized by two stages that are clearly different (Garcia-Berro & Iben 1994; Siess 2006). The first corresponds to the ignition of C at the point of maximum temperature inside the partially degenerate CO core, inducing a thermal runaway which is referred to as the carbon flash. The sudden energy injection by the C-flash leads to the development of a convective zone, which extends outward from the point of maximum temperature. The second stage corresponds to the development of a flame which propagates all the way to the center and transforms the CO core into an ONe core (Garcia-Berro & Iben 1994; Siess 2006).
In Fig. 1 we show the Kippenhahn diagram for a 10 M⊙ and Z = 0.02 model for which no CBM was adopted. During the C-flash, a convective region develops and lasts a few thousand years. The next convective region develops during C-burning and remains until the C-flame turns off at the center of the star. However, Denissenkov et al. (2013) show that the inclusion of even a small amount of CBM during the propagation of the C-flame removes the necessary conditions for further propagation of the C-flame, inducing an anticipated halt of the carbon flame. In this context, if a reasonable amount of CBM is considered, the C-burning phase proceeds as a main flash and subsequent subflashes of less intensity, also neither the flame nor mixing reaches the center (for a detailed discussion, see Farmer et al. 2015, and references therein). This is seen in Fig. 2, where the Kippenhahn diagram is displayed for the same model, but adopting diffusive overshooting with f = 0.007 during the C-burning phase (see Sect. 3 from Denissenkov et al. 2013). Thus, those objects should show a marked contrast in the chemical structure at the end of the C-burning phase, which is expected to be composed of a pure unaltered CO-core, produced during the core helium burning (CHeB) phase, surrounded by an ONe mantle.
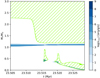 |
Fig. 1. Kippenhahn diagram during the C-burning phase for a model of MZAMS = 10 M⊙ with Z = 0.02, in the absence of extra-mixing processes. The green areas are the convective zones, while the blue scale represents the net energy from nuclear reactions. In this case, the flame successfully reaches the center, leaving a pure ONe core. |
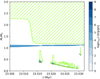 |
Fig. 2. Kippenhahn diagram for the same 10 M⊙ model as in Fig. 1, but when diffusive overshooting is allowed at the bottom of the C-burning shell with the overshooting parameter f = 0.007 (purple area). In this case, the flame stops before reaching the center, thus leaving an unaltered CO core surrounded by the ashes of C-burning. |
Finally, for ultra-massive WD progenitors, the aftermath of the evolution during the thermally unstable phase first consists of the build-up of the most external part of the core, where the He-burning shell was active and, second, a strong reduction in the hydrogen and helium content due to mass loss.
3. Impact of physical assumptions on the final composition of the WD
All the models presented in this work were computed with the stellar evolution code Modules for Experiments in Stellar Astrophysics (MESA) versions 8445 and 12778 (Paxton et al. 2011, 2013, 2015, 2018, 2019). Most of the adopted input physics corresponds to the default options that are described in detail in Paxton et al. (2011, 2013, 2015, 2018, 2019), and they are thus not repeated here. Exceptions include mixing at the border of convective regions, mass loss, and nuclear reaction networks, which are addressed in the following subsections.
As mentioned in the Introduction, the existence of Ne-dominated and hybrid CO-Ne massive WDs is relevant both for asteroseismological studies and for our understanding of the cooling timescales of massive WDs. Given that it has been shown that no significant differences in the predictions for SAGB stars arise simply from the use of different stellar evolution codes (Doherty et al. 2010), it is safe to assume that the predicted existence of Ne-dominated or hybrid CO-Ne WDs depends on the adopted physics. To analyze how robust this prediction is, here we analyze what the key physical assumptions are that can lead to these results. While the main difference in the physical ingredients in the computation of hybrid CO-Ne WDs and pure ONe WDs relies on the inclusion of CBM during the propagation of the C-flame, the main differences between the predicted formation of Ne-dominated WDs (Lauffer et al. 2018) and the different results previously reached by other authors can be traced back to the extension of the CBM region, the adopted mass loss rates, and, finally, the size of the nuclear reaction network. In what follows, we discuss each of these individually.
3.1. Impact of convective boundary mixing
Convective boundary mixing has the potential to affect the final composition of the core by affecting the relative proportions of C and O during the C-flash, and also by allowing material to be mixed down into deeper regions of the star, which, in effect, affects the mean temperatures at which carbon is burnt. Unfortunately, CBM is one of the least understood phenomena in stellar evolution (Cristini et al. 2019). It is usually parameterized and must be calibrated with observations of different stellar objects (e.g., Miller Bertolami 2016), and no calibration exists for the convective regions driven by C-burning. In this context, we estimated the expected range of CBM parameters and, then, investigated how much the final composition can change as a consequence of this.
3.1.1. Estimating the efficiency of CBM
As shown by Siess (2009) and Denissenkov et al. (2013), the inclusion of mixing processes below the flame has the potential to quench the latter flame, leading to the formation of a degenerate CO core surrounded by a mantle, mostly composed of O and Ne. It is not clear, however, to which degree the different assumptions about CBM are solely responsible for the great disparity in the final chemical compositions of previous works (Siess 2007; Denissenkov et al. 2013; Lauffer et al. 2018), or whether other ingredients involved in the computations (such as nuclear reaction rates and networks) also play a significant role. Furthermore, it is not clear from previous works what is the underlying physical reason for the different assumptions of the CBM. Given the aforementioned relevance of CBM assumptions for the final composition of the WD, it would be highly desirable to know which values are acceptable.
Simple estimations of the adiabatic penetration of convective elements into the stable layers can be done by means of the following expression:
![Mathematical equation: $$ \begin{aligned} \frac{\bar{{ v}}_{\rm MLT}^2}{2} = \int _{r_{\rm FCB}}^{r_{\rm CBM}} g(r) \left[\frac{\rho (r)-\rho _{\rm e}(r)}{\rho _{\rm e}(r)}\right] \mathrm{d}r, \end{aligned} $$](/articles/aa/full_html/2022/03/aa42341-21/aa42341-21-eq1.gif) (1)
(1)
where  is the mean value of the convective velocities close to the formal convective boundary (FCB), as estimated by the mixing length theory (MLT); ρe is the density of the convective elements moving adiabatically from the convective boundary; and ρ and g are the local values of the density and gravity acceleration at distance r from the center of the star. By applying this estimation to an initially 10 M⊙ model during the peak of the C-flash, computed without CBM, we determined that the distance penetrated by convective elements at the lower convective boundary is dpen ≃ 2.5 × 10⁻⁴ HP, with HP being the value of the pressure scale height at the formal convective boundary, and HP = 1.9 × 108 cm. This is a very small value, with no practical consequences for the development of the C-flash.
However, during a thermal runaway phase, CBM can be caused by turbulent entrainment (see Meakin & Arnett 2007; Viallet et al. 2015). In the case of turbulent entrainment, turbulence diffuses into the nearby stable region, and it leads to a progressive advance of the border of the turbulent region. According to Meakin & Arnett (2007), the velocity vE at which the turbulent border gains ground on the stable layer is  , where RiB is the bulk Richardson number, σ is the rms velocity at the turbulent border, and n and A are two free parameters to be calibrated with numerical experiments. The bulk Richardson number is a measure of the stiffness of the boundary region, and it is defined as RiB = Δb L/σ2, where L is the mixing length scale and Δb is the relative buoyancy jump. The latter is defined as
 (2)
(2)
where r0 and r1 are the bottom and upper parts of the transition region and N is the adiabatic buoyancy frequency. We can then estimate the distance traveled by the lower convective boundary during the carbon flash as
 (3)
(3)
where τC-flash is estimated as the time required for C-burning to drop by one order of magnitude. From the numerical experiments of Meakin & Arnett (2007), the results are that A ≃ 1 and n ≃ 1, so for practical purposes we can estimate  then, approximating
  , equating L to the mixing length, and setting r0 = rFCB and r1 = rCBM, in Eq. (2) the distance entrained by turbulent border during the carbon flash can be estimated as (Wagstaff et al. 2020)
 (4)
(4)
Using the values from the same 10 M⊙ model during the peak of the C-flash as before, we have τC − flash ≃ 28 yr, LMLT ≃ 3.4 × 108 cm, and  cm s−1 implying dE ≃ 0.15 HP. This value is surprisingly close to the usual size of the CBM region in upper main sequence stars, and it is not completely negligible. We can conclude that the possible impacts of CBM during the C-flash stage are worth exploring.
It is worth mentioning, however, that despite its significant value, the estimate presented in the previous paragraph is several times smaller than the CBM extension adopted by Lauffer et al. (2018). These authors adopted an overshooting parameter value of f = 0.1; by looking at our own 11 M⊙ sequence with f = 0.1 (see next sections), this corresponds to a formal overshooting region with a size of δrOV ≃ 0.003 R⊙, or 1.2 HP. Even if we restrict ourselves to the region where material is actually being mixed during the C-flash, the size of the overshooting zone in that model is δrOV ≃ 0.002 R⊙ (0.8 HP).
According to the previous results in the literature, even more important is the intensity of CBM during the flame propagation (Siess 2009; Denissenkov et al. 2013). Interestingly, from the same 10 M⊙ model as before, but during the peak of the C-flame, we get  cm s−1. The deepening of the convective zone in this model happens at a rate of about vflame ∼ 10−3 cm s−1. Given that for any reasonable estimation of RiB we get RiB < 107, this argument suggests that ve ≫ vflame. Thus, the timescale for the inward propagation of the flame is strongly altered if turbulent entrainment is included. We conclude that quenching of the C-flame is highly likely when turbulent entrainment is included, which is in agreement with the suggestions by Denissenkov et al. (2013).
3.1.2. Impact of CBM on evolutionary sequences
We computed evolutionary sequences with MZAMS = 11 M⊙ and an initial composition of Z = 0.02 from the ZAMS through the central hydrogen and helium burning stages, the RGB, and finally to the SAGB stage. A rather large nuclear reaction network (namely sagb_NeNa_MgAl.net) was adopted. This includes 29 species, from neutrons to 27Al, and this incorporates several carbon burning reactions and both proton and alpha captures by 12C nuclei. No mass loss was included, as winds before the thermally pulsing SAGB phase are almost negligible (see, for example, Table 2 from Siess 2007). In order to test the impact of CBM on the final composition of the core, and in line with the discussion from the previous section, different values for the overshooting parameter f at the bottom of the C-burning convective zones were considered, namely f = 0, 0.001, 0.007, 0.03, 0.1.
In Figs. 3 and 4 we show the expected internal structure (i.e., of the innermost 1.3 M⊙) at the moment that C-burning stops for models computed with different values for the parameter f. It is seen that for f = 0 and 0.001, the flame successfully reaches the center of the star, leaving a pure ONe core. On the other hand, the inclusion of moderate-to-high overshooting results in the premature halt of the C-flame, with the consequent formation of hybrid cores composed of an inner unaltered CO core surrounded by an ONe mantle. The size of the unaltered CO-core is determined by the location of the quenching of the flame, and it also depends on the efficiency of the extra-mixing. For the f = 0.1 case, Fig. 4 shows that this assumption strongly reduces the CO-core size and creates a new chemical interface where 12C, 16O, and 20Ne coexist. This reduction is a consequence of the large extension of the CBM below the convective zone generated after the main C-flash. Thus, although the existence of CBM still leads to the quenching of the C-flame, 20Ne was already carried close to the center by the main C-flash. In none of the cases explored were we able to produce Ne-dominated cores. We can safely conclude that the inclusion of enhanced overshooting is not responsible for the formation of the NeO-core1 WDs found by Lauffer et al. (2018).
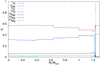 |
Fig. 3. Chemical profiles for the most abundant species at the end of the C-burning phase for a model computed with MZAMS = 11 M⊙ and f = 0 during the C-burning phase. The core is composed of a mixture of 16O and 20Ne with traces of 12C, 23Na, and 24Mg. |
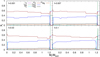 |
Fig. 4. Chemical structures for the 11 M⊙ models at the end of the C-burning phase, computed assuming overshooting parameters f = 0.001, 0.007, 0.03, 0.1. For moderate-to-high overshooting, the C-flame halts before reaching the center of the star. The enhanced mixing induced in the f = 0.1 model strongly reduces the size of the pure CO core. |
To test the robustness of this conclusion, we analyzed it under the physical assumptions established by Lauffer et al. (2018). To do this, we computed the evolution of models with an initial mass of 11 M⊙, adopting the same nuclear network as in Lauffer et al. (2018), that is co_burn_plus.net (see Sect. 3.3 for details on the nuclear networks), from the ZAMS to the end of the C-burning phase, considering enhanced mass loss during the RGB and AGB, using MESA r8445. To account for CBM processes during C-burning, diffusive overshooting was adopted during the whole evolution for metal burning regions (“burn_z” option in MESA), and thermohaline mixing was allowed. In Fig. 5 we show the expected chemical profiles for models with the overshooting parameter f = 0.1 and f = 0 (solid lines and dashed lines, respectively). The following two distinctive features arise: the formation of Ne-dominated cores (see next section) and the absence of the hybrid core when overshooting is adopted. The results of the latter phenomenon are a consequence of both enhanced extra-mixing, resulting from the adoption of f = 0.1, and the presence of thermohaline mixing, which eliminated the small, pure CO core that would otherwise have been expected. As pointed out previously, it is seen that the inclusion of enhanced overshooting does not significantly alter the distribution of elements in the core.
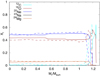 |
Fig. 5. Chemical profiles for the model computed with the nuclear network co_burn_plus.net and overshooting parameter f = 0.1 and f = 0 (solid and dashed lines, respectively). |
From the same figure, a notable difference in the size of the NeO core is perceived. We find that, when accounting for overshooting in the metal burning regions with the parameter “burn_z”, the burning of 14N in the CHeB phase induces an overshooting region that moves the border of the core farther away by an additional ∼0.22 M⊙, thus affecting the post-CHeB evolution. For a correct assessment of the overshooting process during the carbon burning phase, it should be turned on at the beginning of said phase.
3.2. Impact of extreme mass loss on the early SAGB
The thermally unstable phase post C-burning is one of the most time-consuming phases when computing the evolution of SAGB stars. During this phase, the star expands and mass loss becomes important. Similar to low mass stars in the AGB, SAGB stars also experience recurrent thermal instabilities in the shell where He is burning, known as thermal pulses. Such instabilities are characterized by a sudden injection of energy in a relatively small time lapse. To avoid the numerical complications connected with the computation of the thermal pulses, Lauffer et al. (2018) adopted values of mass loss rates during AGB higher than recommended. Particularly, the authors implemented the formulae for AGB mass loss from Bloecker (1995), adopting a large value of ηBlocker = 10, compared to the more usual ∼0.1, which is reflected as an enhanced wind. This results in extreme mass loss previous to the C-ignition, leading not only to the complete removal of the H-rich envelope, but also to the removal of most of the He-rich mantle before the development of the C-flash. Therefore, the H-burning shell is completely extinguished and something similar happens with the He-burning shell, which finally results in a strong alteration of the post-AGB evolution, affecting both the path on the Hertzsprung-Russell diagram and the chemical structure and thermal stratification of the CO core. As a consequence, the ignition of C, which takes place at a position closer to the center than in the absence of mass loss, occurs when the star has lost almost 90% of its mass. Additionally, we noted that the He content added by Lauffer et al. (2018) to their MWD ≥ 1.132 M⊙ models in order to replace the layers lost by artificially strong winds is inconsistent with the predictions of detailed SAGB models, being almost 10 times higher for a MWD = 1.22 M⊙ model Siess (2010). This is expected to have a non-negligible impact on the cooling times and crystallization of WDs (see the next sections). Finally, we found that the high mass loss rate adopted is not the cause of the Ne-enhanced core compositions found by the authors either.
3.3. Impact of nuclear reaction rates
Previous works on the modeling of SAGB stars have adopted nuclear reaction networks of very different sizes, from 52 species in Siess (2006) down to 16 species in Lauffer et al. (2018). Given the large differences in the sizes of the nuclear networks, it is expected that some differences in the chemical profiles may arise. In this section, we explore the effects of the assumption of different nuclear reaction networks on the shape of the chemical profiles expected at the end of the SAGB phase.
We computed models with the same input physics as in Lauffer et al. (2018), including thermohaline mixing. We also analyzed the impact of two different reaction networks, namely co_burn_plus.net, which was used by Lauffer et al. (2018) and follows 16 species, and sagb_NeNa_MgAl.net, which includes 29 species in total. The choice to incorporate sagb_NeNa_MgAl.net into our analysis was motivated by the fact that it includes the 23Na isotope (unlike co_burn_plus.net), with potentially important consequences for the resulting chemical profile. Indeed, the primary reaction 12C(12C, p)23Na can lead to a decrease in the amount of C that is available for the 20Ne-creating reaction 12C(12C, α)20Ne, whereas 20Ne(α, p)23Na can directly lead to a decrease in the 20Ne abundance. Since these reactions are included in the sagb_NeNa_MgAl.net network, but not in co_burn_plus.net, the former is expected to be more suitable for the computation of realistic SAGB models. Extreme mass loss rates were included during the early AGB as in Lauffer et al. (2018) to allow for a detailed comparison with that work.
The sequence computed with f = 0.1 and co_burn_plus.net thus corresponds to the very same choice of CBM, the nuclear network, and mass-loss rates adopted by Lauffer et al. (2018). Consequently, this simulation shows the same abundances reported by Lauffer et al. (2018), with the formation of 20Ne-dominated WDs (see Fig. 6). Conversely, and as can also be appreciated in Fig. 6, the choice of the larger nuclear network sagb_NeNa_MgAl.net leads to a very different 20Ne abundance, which is in better agreement with those presented by previous authors (Ritossa et al. 1996; Siess 2006; Doherty et al. 2010; Denissenkov et al. 2013) who found 16O-dominated instead of 20Ne-dominated cores. It is safe to assume that some of the missing reactions in co_burn_plus.net are the key to reproducing the result found by Lauffer et al. (2018). Due to the complex interaction between the production and destruction of isotopes from the reactions involved, it is a priori not clear which of these reactions are the ones responsible for the enhancement of 20Ne. We accordingly performed an exploration consisting in the one-by-one removal of several specific nuclear reactions and their possible combinations from the sagb_NeNa_MgAl.net network which are not present in co_burn_plus.net; this allowed us to look deeper into their impact on the final chemical abundances.
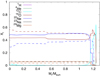 |
Fig. 6. Chemical structures for 11 M⊙ models at the end of the C-burning phase with an enhanced mass loss and nuclear networks co_burn_plus.net (solid line) and sagb_NeNa_MgAl.net (dashed line). |
Our results show that it is the removal of the 12C(12C, p)23Na reaction that induces the most significant impact on the 16O and 20Ne abundances. This is shown in Fig. 7, where we compare the chemical profiles obtained for two sequences, both of which were computed assuming f = 0.1. In the first one, we assumed the co_burn_plus.net network. In the second, a modified version of the network sagb_NeNa_MgAl.net, in which the reaction 12C(12C, p)23Na was removed, was considered. From these sequences, it is clear that it is the absence of 12C(12C, p)23Na in the co_burn_plus.net network that leads to a high 20Ne composition.
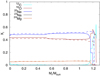 |
Fig. 7. Chemical profiles for 11 M⊙ models considering the nuclear network co_burn_plus.net (solid line) and the nuclear network sagb_NeNa_MgAl.net without the 12C(12C, p)23Na reaction (dashed line). |
This result can be understood in terms of the 12C available during the C-burning phase. The 12C(12C, p)23Na nuclear reaction produces the isotope 23Na and contributes to the consumption of 12C. By removing the production of 23Na, 12C is available in the interior of the star and, overall, allows a larger production of 20Ne through the reaction 12C(12C, α)20Ne. Consequently about 0.07 of the mass fraction that would have ended as 23Na ends up as an additional 0.07 of 20Ne by mass fraction. Moreover, for each additional 12C(12C, α)20Ne, we have one free α particle available for reactions, through 16O(α, γ)20Ne leading to an additional increase in 20Ne of about 0.1 (by mass fraction) at the expense of the 16O abundance. In brief, the removal of the 12C(12C, p)23Na nuclear reaction leads to a decrease of about 0.1 in the mass fraction of 16O, the removal of almost all 23Na, and an increase in the mass fraction of 20Ne by about 0.17. This is seen in Fig. 7, where we compare the chemical structure for both models. Clearly, when the production of 23Na is removed, the distribution of the most abundant elements 20Ne and 16O is in good agreement with those found in Lauffer et al. (2018).
4. Consequences for WD evolution
In this section we explore the impact of the chemical features derived from the extreme assumptions discussed in the previous sections on the WD cooling times, crystallization, and pulsational properties. To this end, we computed the evolution of three MWD = 1.22 M⊙ WD models. We adopted a ONe-core model with the chemical composition derived by Siess (2007) consisting of a core composition of 16O (56%); 20Ne (29%) plus traces of 12C, 23Na, and 24Mg; and a total 1H and 4He content of 1.5 × 10⁻⁷ and 6.5 × 10⁻⁵ MWD, respectively. For a better comparison, the H content was set to match the one derived by Lauffer et al. (2018), while the He content is the one derived from the correct calculation of the progenitor’s evolution. Additionally, we adopted a NeO-core model obtained from our previous co_burn_plus.net model, with a similar composition derived by Lauffer et al. (2018), that is to say a core made of 16O (42%), 20Ne (49%), and with a H- and He-content added on the top of 1.5 × 10⁻⁷ and 7.6 × 10⁻⁴ MWD. Finally, to test the impact of the large He content added, we computed a He-enriched model consisting of the same chemical structure as the correct ONe-core model, but with an incorrect He content of 7.6 × 10⁻⁴ MWD. The evolution and structure of the WD models presented in this section were calculated with the LPCODE evolutionary code (for details, see Althaus et al. 2003, 2005, 2015, 2021; Miller Bertolami 2016). During crystallization, we took the release of latent heat and changes in the core chemical composition resulting from phase separation upon crystallization into account, using a phase diagram suitable for 16O and 20Ne plasmas (Camisassa et al. 2019).
4.1. Cooling times and crystallization
We computed the cooling times for each WD sequence from ∼200 000 down to ∼10 000 K. By the time the sequences reached the minimum effective temperature considered, the models were almost completely crystallized. We found cooling times of tcool = 2.093, 1.882, and 1.863 Gyr for our ONe-core, He-enriched, and NeO-core models, respectively. Our results indicate that the inclusion of large amounts of He induces an acceleration in the cooling process by ∼10%. The main reason behind this result is that, during the enhancement of the He content, heavier elements such as C and O are replaced at the bottom of the He buffer zone by 4He. The opacity of 4He is lower than the one provided by carbon, thus the layers above the degenerate core are less opaque, accelerating the cooling (see Althaus et al. 2021). On the other hand, the analysis of the different core compositions reveals that the model with a Ne-dominated core evolves slightly faster. This is because the specific heat per gram of O-rich compositions is larger than in the corresponding Ne-enriched ones.
Due to the different compositions and cooling rates of our models, some impact is expected on the crystallization degree of the core as the evolution proceeds. Mixtures enriched in 20Ne are expected to crystallize earlier than 16O-rich mixtures. This is seen in Table 1, where we display the percentage of crystallized mass for each of the models computed, along with their corresponding effective temperatures. As can be seen, the NeO-core model starts to crystallize at a temperature that is ∼530 K higher than in the case of our He-enriched model. From the same table, it is seen that the most important acceleration in the crystallization process is brought about by the large amount of He added, leading to a crystallization that takes place significantly earlier, in other words at a temperature that is higher by ∼1300 K. As a consequence, the overall differences in the mass of the solid region can exceed 10%. However, as the model cools down, these differences are reduced, and reach only a few percent by the time they reach the ZZ Ceti instability strip at ∼13 000 K.
Effective temperature and percent of crystallized mass for selected values for the three evolutionary sequences computed.
4.2. Asteroseismology
The non-negligible differences found in the size of the crystallized portion of the star and chemical structure previously discussed are expected to leave their imprint on the g-mode pulsations of ZZ Ceti stars. As is known, the period spectrum and mode-trapping properties of g-modes strongly depend on the value of the Brunt–Väisälä frequency across the interior of the star, which, in turn, depends on the chemical structure of the model. Thus, any change perceived in the chemical profiles are translated into changes in the WD’s expected pulsational properties.
To measure the corresponding impact of the different core compositions and 4He content, we computed the pulsational properties of all our ultra-massive pulsating DA WD models with the LP-PUL pulsation code described in Córsico & Althaus (2006), which was previously employed in the study of the properties of ultra-massive WD models (De Gerónimo et al. 2019) and used to perform asteroseismologycal studies of ultra-massive ZZ Ceti stars (Córsico et al. 2019b). Element diffusion was included for all models from the beginning of the WD cooling track. This process smoothens the inner chemical profiles, strongly affecting the run of the Brunt–Väisälä frequency across the interior. We adopted the “hard sphere” boundary conditions when accounting for the effects of crystallization on the pulsational properties of g-modes. This assumes that the amplitude of the eigenfunctions of g-modes is drastically reduced below the solid and liquid interface, as compared with the amplitude in the fluid region (Montgomery & Winget 1999).
In Fig. 8 we show the run of the logarithm of the squared Brunt–Väisälä frequency (N2) against the normalized radius of the star for each model at 12 000 K. The values of the Brunt–Väisälä frequency corresponding to the crystallized region of the model are shown as dotted lines, while the solid lines correspond to the fluid region. The right side of the plot corresponds to a zoomed-in look in the fluid region. At this effective temperature, the models have 98.0% (ONe-core), 98.3% (He-enriched), and 98.4% (NeO-core) of their mass crystallized, meaning that most of the different core-chemical features do not have an impact on the g-mode pulsations. This prevented us from directly measuring the impact of the different core compositions on the pulsational properties. In the fluid region, however, two features are clearly distinguishable: the bump in the C/He chemical transition, which is located at r/R⋆ ∼ 0.95 for the NeO-core and He-enriched models and at ∼0.98 for the ONe-core model, and the bump in the H/He chemical transition, located at r/R⋆ ∼ 0.99. The differences found both in the value of N2 at the C/He chemical transition as well as in its location are the result of the artificial addition of 4He above the core.
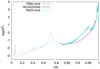 |
Fig. 8. Run of the logarithm of the squared Brunt–Väisälä frequency vs. the normalized radial distance for the three models studied at 12 000 K. Dotted (solid) lines correspond to the value of log(N2) in the crystallized (fluid) region. Magenta, green, and cyan lines correspond to ONe-rich, He-enriched, and NeO cores, respectively. |
We computed the asymptotic period spacing, a quantity frequently used in asteroseismological analyses. As is known, for g-modes with high radial order k, the separation of consecutive periods becomes nearly constant at a value given by the asymptotic theory of nonradial stellar pulsations (e.g., Aerts et al. 2010; Catelan & Smith 2015, and references therein). The asymptotic period spacing was computed as in Tassoul et al. (1990):
 (5)
(5)
where
![Mathematical equation: $$ \begin{aligned} \Pi _0= 2 \pi ^2 \left[\int _{r_1}^{r_2} \frac{N}{r} \mathrm{d}r\right]^{-1}, \end{aligned} $$](/articles/aa/full_html/2022/03/aa42341-21/aa42341-21-eq12.gif) (6)
(6)
and N is the Brunt–Väisälä frequency.
The period spacing thus strongly depends on the value of N and the size of the propagation region of g-modes. In fact, when a fraction of the WD core is crystallized, the lower limit of the integral in Eq. (6) is the radius of the crystallization front, which progressively moves outward as the star cools down and the fraction of crystallized mass increases. As a result, the integral in Eq. (6) decreases, leading to an increase in the asymptotic period spacing (Eq. (5)).
In Fig. 9 we show the evolution of the asymptotic period spacing as a function of the effective temperature. For each model, a sudden increase in the value of the asymptotic period spacing is noted on the left side of the plot, resulting from the onset of crystallization. From there on, a constant increase in the asymptotic period spacing is seen as the models cool down, mostly due from the outward moving crystallization front. By the time the models reach the ZZ Ceti instability strip at ∼13 000 K, the models have a very similar crystallized mass (∼97%). Because of this, differences found in the asymptotic period spacing are mostly related to differences in the value of the Brunt–Väisälä frequency, that is, differences induced by the large amount of He added. This can be seen as an overlap of the asymptotic period spacing curves of the NeO-core and He-enriched models. We found differences in the asymptotic period spacing at this stage of up to 8%.
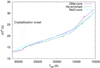 |
Fig. 9. Dipole (ℓ = 1) asymptotic period spacing as a function of the effective temperature for the evolutionary cooling sequences of our MWD = 1.22 M⊙ models. The vertical dashed line shows the high-temperature edge of the ZZ Ceti instability strip. The lines have the same meaning as in Fig. 8. |
In addition to crystallization, the most important physical process affecting the shape of the WD structure and, as a consequence, their pulsational properties, is element diffusion. The chemical structures computed and the results presented in this work thus reflect the effect of element diffusion from the beginning of the WD cooling path until ∼10 000 K. In particular, we perceived a notable contrast between our derived chemical profile for 16O with that from Lauffer et al. (2018), who, for models with 1.132 ≤ MWD/M⊙ ≤ 1.307 at ∼10 000 K, found profiles characterized by a sharp and tall peak at the base of the He-buffer zone2. As this result can have a significant impact on the trapping properties of pulsating WDs, we did a simple experiment in which we explored how this feature could be produced. Since our SAGB models do not show this signature in the 16O profile, we assume that it should form during the cooling of the WD. By assuming that diffusion acts for all the isotopes involved, we were unable to reproduce this peak. However, we find that such a chemical signature could be produced if the diffusion of the 12C isotope is ignored.
5. Conclusions
In this work, we have performed several numerical simulations aimed at understanding the discrepant core composition of ultra-massive WDs (MWD > 1.05 M⊙) predicted by previous authors (e.g., Ritossa et al. 1996; Siess 2006; Denissenkov et al. 2013; Lauffer et al. 2018). Specifically we have addressed the possible formation of Ne-dominated WDs and hybrid CO-Ne WDs and how this can be affected by modeling choices involving, for instance, the intensity of convective boundary mixing, the size of the nuclear reaction network, and extreme winds on the SAGB phase. We also computed the impact of these chemical structures on the cooling times, crystallization, and pulsational properties of ultra-massive ZZ Ceti stars.
Our main conclusions can be enumerated as follows:
-
The predicted existence of Ne-dominated massive WDs (Lauffer et al. 2018) is the consequence of the adoption of a small nuclear network (co_burn_plus.net) which ignores the isotope 23Na. Specifically, disregarding the 12C(12C, p)23Na nuclear reaction leads to a decrease of about 0.1 in the mass fraction of 16O, the removal of all 23Na, and an increase in the mass fraction of 20Ne by about 0.17 (by mass fraction).
-
In agreement with previous authors, we find that the inclusion of convective boundary mixing quenches the carbon flame, leading to the formation of hybrid CO-Ne cores. We find that the size of the pure CO core depends on both the adopted value of the overshooting parameter f and the initial mass.
-
Based on the insight coming from 3D hydro-dynamical simulations, we have performed order-of-magnitude estimates which suggest that entrainment at the bottom of the carbon flash convective zone might be on the order of a few tenths of the local pressure scale height. Moreover, given the very slow propagation of the carbon flame in numerical models (vflame ∼ 10−3 cm s−1) in comparison with the typical turbulent velocities in the convective zone (vMLT ∼ 5 × 104 cm s−1), it is expected that turbulent entrainment will strongly modify the propagation of the C-flame.
-
The inclusion of strong winds removes the whole H-rich envelope and a large part of the He-rich mantle of the star, extinguishing the H-burning shell and affecting the He-burning shell. This has a direct impact on the post-SAGB core’s thermal evolution, moderately shifting the location of the temperature maximum. Consequently, the C-flash is ignited closer to the center and the C-burning flame penetrates more deeply.
-
The prediction by Lauffer et al. (2018) that hybrid CO-Ne cores do not form for massive WDs, even when a large amount of convective boundary mixing is included at the bottom of the C-flame, is a consequence of the adoption of very large values for the overshooting parameter during the C-flash and the presence of thermohaline mixing.
-
The inclusion of large amounts of 4He induces an acceleration in the cooling process of the models by up to ∼10%, with respect to those in which the total helium content is obtained by the detailed computation of the SAGB evolution. This result is a consequence of the lower opacity of helium compared to carbon. The adoption of Ne-rich core mixtures slightly accelerates the cooling process due to the smaller specific heat per gram, compared to O-rich compositions.
-
Structures composed of Ne-dominated cores and large amounts of He result in a strong acceleration of the crystallization process, which takes place earlier and thus at an effective temperature up to ∼1800 K higher, as compared to our standard models. Differences in the crystallization degree of the models can exceed 10% for the same effective temperature.
-
At the ZZ Ceti instability strip, differences found in the cooling, crystallization degree, and size of the He-buffer zone are expected to impact the asymptotic period spacing by up to ∼8%. In addition, the location and size of the base of the He-buffer zone is expected to have a non-negligible impact on the trapping properties of g-modes.
These results indicate that, while the formation of hybrid CO-Ne core WDs is a concrete possibility, the existence of Ne-dominated WDs has to be discarded according to the reaction rates and branching ratios included in the sagb_NeNa_MgAl.net network. Additionally, the adoption of these spurious chemical structures for asteroseismological analysis could lead to incorrect determinations of cooling times, crystallization, and period spacings.
To close, we note that the uncertainties affecting the 12C+12C reaction rate and its corresponding branching ratios are still very significant (e.g., Pignatari et al. 2013; Chieffi et al. 2021; Monpribat et al. 2022, and references therein). This could plausibly affect the final chemical profile of the resulting ultra-massive WDs (e.g., Halabi & El Eid 2015). A full investigation of this topic is beyond the scope of this paper, but will be addressed by us in the near future.
The name NeO(ONe)-core is adopted when the core is mostly composed of 20Ne(16O).
These are exactly the models in which He was added ad hoc to replace the envelope removed by the assumption of artificially strong winds.
Acknowledgments
We wish to acknowledge the suggestions and comments of the anonymous referee that strongly improved the original version of this work. F.C.D.G. acknowledges financial support provided by FONDECYT grant 3200628. This project was supported in part by ANID’s Millennium Science Initiative through grant ICN12_12009, awarded to the Millennium Institute of Astrophysics (MAS), and by Proyecto Basal AFB-170002. Part of this work was supported by PIP 112-200801-00940 grant from CONICET, grant G149 from University of La Plata, and grant PICT 2016-0053 from ANPCyT, Argentina. F.P. is supported by a EVC-CIN fellowship for undergraduate students. This research has made use of NASA Astrophysics Data System. Software: Modules for Experiments in Stellar Astrophysics (MESA; Paxton et al. 2011, 2013, 2015, 2018, 2019), MESASDK 20.3.1 (Townsend 2020), mkipp (Marchant 2019). LPCODE, Althaus et al. (2021).
References
- Aerts, C., Christensen-Dalsgaard, J., & Kurtz, D. W. 2010, Asteroseismology (Springer Science+Business Media B.V.) [Google Scholar]
- Althaus, L. G., Serenelli, A. M., Córsico, A. H., & Montgomery, M. H. 2003, A&A, 404, 593 [NASA ADS] [CrossRef] [EDP Sciences] [Google Scholar]
- Althaus, L. G., Serenelli, A. M., Panei, J. A., et al. 2005, A&A, 435, 631 [NASA ADS] [CrossRef] [EDP Sciences] [Google Scholar]
- Althaus, L. G., Córsico, A. H., Isern, J., & García-Berro, E. 2010, A&ARv, 18, 471 [NASA ADS] [CrossRef] [Google Scholar]
- Althaus, L. G., Camisassa, M. E., Miller Bertolami, M. M., Córsico, A. H., & García-Berro, E. 2015, A&A, 576, A9 [NASA ADS] [CrossRef] [EDP Sciences] [Google Scholar]
- Althaus, L. G., Gil-Pons, P., Córsico, A. H., et al. 2021, A&A, 646, A30 [NASA ADS] [CrossRef] [EDP Sciences] [Google Scholar]
- Bloecker, T. 1995, A&A, 297, 727 [Google Scholar]
- Camisassa, M. E., Althaus, L. G., Córsico, A. H., et al. 2019, A&A, 625, A87 [NASA ADS] [CrossRef] [EDP Sciences] [Google Scholar]
- Camisassa, M. E., Althaus, L. G., Torres, S., et al. 2021, A&A, 649, L7 [NASA ADS] [CrossRef] [EDP Sciences] [Google Scholar]
- Castellani, V., Chieffi, A., Pulone, L., & Tornambe, A. 1985, ApJ, 294, L31 [NASA ADS] [CrossRef] [Google Scholar]
- Catelan, M., & Smith, H. A. 2015, Pulsating Stars (Weinheim: Wiley-VCH) [Google Scholar]
- Chieffi, A., Roberti, L., Limongi, M., et al. 2021, ApJ, 916, 79 [NASA ADS] [CrossRef] [Google Scholar]
- Constantino, T., Campbell, S. W., Lattanzio, J. C., & van Duijneveldt, A. 2016, MNRAS, 456, 3866 [Google Scholar]
- Córsico, A. H., & Althaus, L. G. 2006, A&A, 454, 863 [NASA ADS] [CrossRef] [EDP Sciences] [Google Scholar]
- Córsico, A. H., Althaus, L. G., Miller Bertolami, M. M., & Kepler, S. O. 2019a, A&ARv, 27, 7 [Google Scholar]
- Córsico, A. H., De Gerónimo, F. C., Camisassa, M. E., & Althaus, L. G. 2019b, A&A, 632, A119 [NASA ADS] [CrossRef] [EDP Sciences] [Google Scholar]
- Cristini, A., Hirschi, R., Meakin, C., et al. 2019, MNRAS, 484, 4645 [NASA ADS] [CrossRef] [Google Scholar]
- De Gerónimo, F. C., Althaus, L. G., Córsico, A. H., Romero, A. D., & Kepler, S. O. 2017, A&A, 599, A21 [NASA ADS] [CrossRef] [EDP Sciences] [Google Scholar]
- De Gerónimo, F. C., Córsico, A. H., Althaus, L. G., Wachlin, F. C., & Camisassa, M. E. 2019, A&A, 621, A100 [NASA ADS] [CrossRef] [EDP Sciences] [Google Scholar]
- Denissenkov, P. A., Herwig, F., Truran, J. W., & Paxton, B. 2013, ApJ, 772, 37 [NASA ADS] [CrossRef] [Google Scholar]
- Doherty, C. L., Siess, L., Lattanzio, J. C., & Gil-Pons, P. 2010, MNRAS, 401, 1453 [NASA ADS] [CrossRef] [Google Scholar]
- Ekström, S., Georgy, C., Eggenberger, P., et al. 2012, A&A, 537, A146 [Google Scholar]
- Farmer, R., Fields, C. E., & Timmes, F. X. 2015, ApJ, 807, 184 [NASA ADS] [CrossRef] [Google Scholar]
- Garcia-Berro, E., & Iben, I., Jr. 1994, ApJ, 434, 306 [NASA ADS] [CrossRef] [Google Scholar]
- García-Berro, E., & Oswalt, T. D. 2016, New Astron. Rev., 72, 1 [CrossRef] [Google Scholar]
- García-Berro, E., Ritossa, C., & Iben, I., Jr. 1997, ApJ, 485, 765 [CrossRef] [Google Scholar]
- Halabi, G. M., & El Eid, M. 2015, AIP Conf. Ser., 1645, 339 [NASA ADS] [Google Scholar]
- Iben, I., Jr., Ritossa, C., & García-Berro, E. 1997, ApJ, 489, 772 [NASA ADS] [CrossRef] [Google Scholar]
- Kilic, M., Munn, J. A., Harris, H. C., et al. 2017, ApJ, 837, 162 [Google Scholar]
- Lauffer, G. R., Romero, A. D., & Kepler, S. O. 2018, MNRAS, 480, 1547 [NASA ADS] [CrossRef] [Google Scholar]
- Marchant, P. 2019, https://doi.org/10.5281/zenodo.2602098 [Google Scholar]
- Meakin, C. A., & Arnett, D. 2007, ApJ, 667, 448 [NASA ADS] [CrossRef] [Google Scholar]
- Miller Bertolami, M. M. 2016, A&A, 588, A25 [NASA ADS] [CrossRef] [EDP Sciences] [Google Scholar]
- Monpribat, E., Martinet, S., Courtin, S., et al. 2022, A&A, in press, https://doi.org/10.1051/0004-6361/202141858 [Google Scholar]
- Montgomery, M. H., & Winget, D. E. 1999, ApJ, 526, 976 [CrossRef] [Google Scholar]
- Paxton, B., Bildsten, L., Dotter, A., et al. 2011, ApJS, 192, 3 [Google Scholar]
- Paxton, B., Cantiello, M., Arras, P., et al. 2013, ApJS, 208, 4 [Google Scholar]
- Paxton, B., Marchant, P., Schwab, J., et al. 2015, ApJS, 220, 15 [Google Scholar]
- Paxton, B., Schwab, J., Bauer, E. B., et al. 2018, ApJS, 234, 34 [NASA ADS] [CrossRef] [Google Scholar]
- Paxton, B., Smolec, R., Schwab, J., et al. 2019, ApJS, 243, 10 [Google Scholar]
- Pignatari, M., Hirschi, R., Wiescher, M., et al. 2013, ApJ, 762, 31 [NASA ADS] [CrossRef] [Google Scholar]
- Ritossa, C., Garcia-Berro, E., & Iben, I., Jr. 1996, ApJ, 460, 489 [NASA ADS] [CrossRef] [Google Scholar]
- Schwarzschild, K. 1906, Nachrichten von der Königlichen Gesellschaft der Wissenschaften zu Göttingen. Math.-phys. Klasse, 195, 41 [Google Scholar]
- Siess, L. 2006, A&A, 448, 717 [NASA ADS] [CrossRef] [EDP Sciences] [Google Scholar]
- Siess, L. 2007, A&A, 476, 893 [NASA ADS] [CrossRef] [EDP Sciences] [Google Scholar]
- Siess, L. 2009, A&A, 497, 463 [NASA ADS] [CrossRef] [EDP Sciences] [Google Scholar]
- Siess, L. 2010, A&A, 512, A10 [NASA ADS] [CrossRef] [EDP Sciences] [Google Scholar]
- Tassoul, M., Fontaine, G., & Winget, D. E. 1990, ApJS, 72, 335 [Google Scholar]
- Tominaga, N., Blinnikov, S. I., & Nomoto, K. 2013, ApJ, 771, L12 [NASA ADS] [CrossRef] [Google Scholar]
- Townsend, R. 2020, https://doi.org/10.5281/zenodo.3706650 [Google Scholar]
- Tremblay, P.-E., Fontaine, G., Gentile Fusillo, N. P., et al. 2019, Nature, 565, 202 [CrossRef] [Google Scholar]
- Viallet, M., Meakin, C., Prat, V., & Arnett, D. 2015, A&A, 580, A61 [NASA ADS] [CrossRef] [EDP Sciences] [Google Scholar]
- Wagstaff, G., Miller Bertolami, M. M., & Weiss, A. 2020, MNRAS, 493, 4748 [Google Scholar]
- Winget, D. E., & Kepler, S. O. 2008, ARA&A, 46, 157 [Google Scholar]
- Winget, D. E., Kepler, S. O., Campos, F., et al. 2009, ApJ, 693, L6 [CrossRef] [Google Scholar]
All Tables
Effective temperature and percent of crystallized mass for selected values for the three evolutionary sequences computed.
All Figures
|
Fig. 1. Kippenhahn diagram during the C-burning phase for a model of MZAMS = 10 M⊙ with Z = 0.02, in the absence of extra-mixing processes. The green areas are the convective zones, while the blue scale represents the net energy from nuclear reactions. In this case, the flame successfully reaches the center, leaving a pure ONe core. |
| In the text | |
|
Fig. 2. Kippenhahn diagram for the same 10 M⊙ model as in Fig. 1, but when diffusive overshooting is allowed at the bottom of the C-burning shell with the overshooting parameter f = 0.007 (purple area). In this case, the flame stops before reaching the center, thus leaving an unaltered CO core surrounded by the ashes of C-burning. |
| In the text | |
|
Fig. 3. Chemical profiles for the most abundant species at the end of the C-burning phase for a model computed with MZAMS = 11 M⊙ and f = 0 during the C-burning phase. The core is composed of a mixture of 16O and 20Ne with traces of 12C, 23Na, and 24Mg. |
| In the text | |
|
Fig. 4. Chemical structures for the 11 M⊙ models at the end of the C-burning phase, computed assuming overshooting parameters f = 0.001, 0.007, 0.03, 0.1. For moderate-to-high overshooting, the C-flame halts before reaching the center of the star. The enhanced mixing induced in the f = 0.1 model strongly reduces the size of the pure CO core. |
| In the text | |
|
Fig. 5. Chemical profiles for the model computed with the nuclear network co_burn_plus.net and overshooting parameter f = 0.1 and f = 0 (solid and dashed lines, respectively). |
| In the text | |
|
Fig. 6. Chemical structures for 11 M⊙ models at the end of the C-burning phase with an enhanced mass loss and nuclear networks co_burn_plus.net (solid line) and sagb_NeNa_MgAl.net (dashed line). |
| In the text | |
|
Fig. 7. Chemical profiles for 11 M⊙ models considering the nuclear network co_burn_plus.net (solid line) and the nuclear network sagb_NeNa_MgAl.net without the 12C(12C, p)23Na reaction (dashed line). |
| In the text | |
|
Fig. 8. Run of the logarithm of the squared Brunt–Väisälä frequency vs. the normalized radial distance for the three models studied at 12 000 K. Dotted (solid) lines correspond to the value of log(N2) in the crystallized (fluid) region. Magenta, green, and cyan lines correspond to ONe-rich, He-enriched, and NeO cores, respectively. |
| In the text | |
|
Fig. 9. Dipole (ℓ = 1) asymptotic period spacing as a function of the effective temperature for the evolutionary cooling sequences of our MWD = 1.22 M⊙ models. The vertical dashed line shows the high-temperature edge of the ZZ Ceti instability strip. The lines have the same meaning as in Fig. 8. |
| In the text | |
Current usage metrics show cumulative count of Article Views (full-text article views including HTML views, PDF and ePub downloads, according to the available data) and Abstracts Views on Vision4Press platform.
Data correspond to usage on the plateform after 2015. The current usage metrics is available 48-96 hours after online publication and is updated daily on week days.
Initial download of the metrics may take a while.