Free Access
Fig. 9.
Download original image
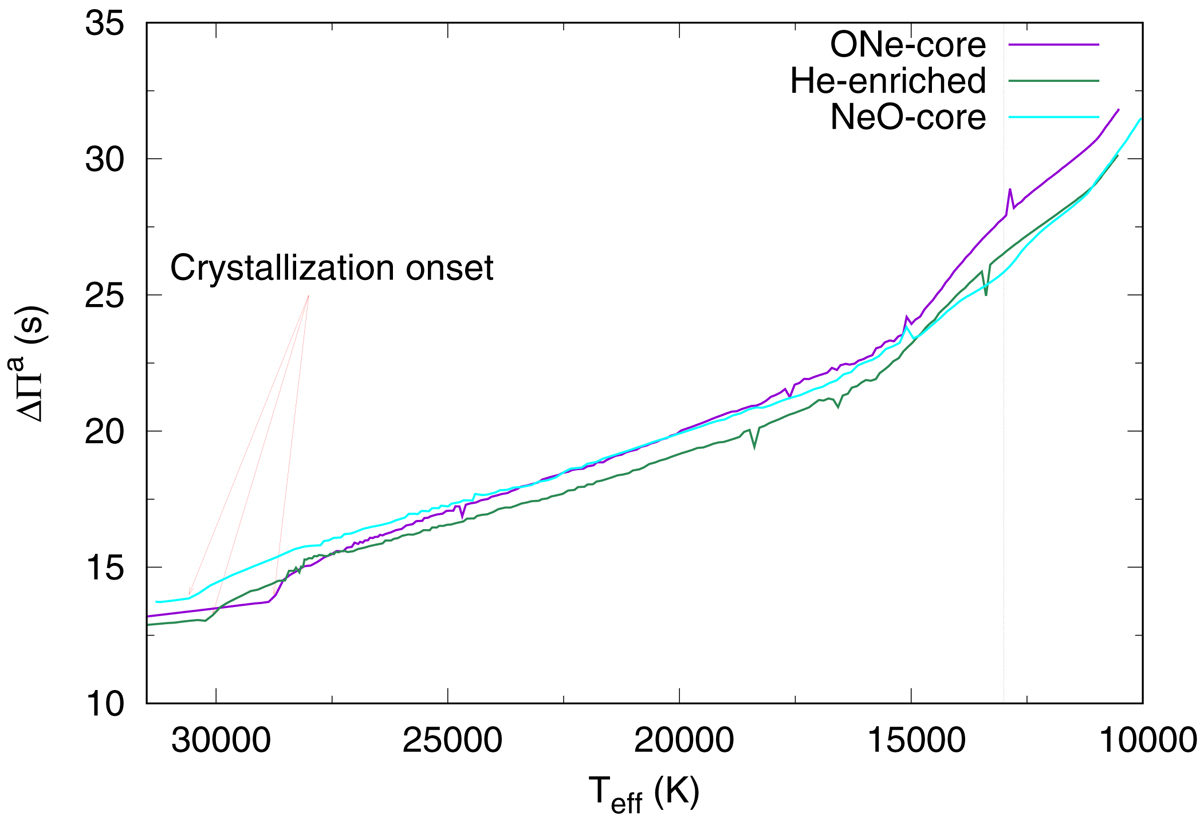
Dipole (ℓ = 1) asymptotic period spacing as a function of the effective temperature for the evolutionary cooling sequences of our MWD = 1.22 M⊙ models. The vertical dashed line shows the high-temperature edge of the ZZ Ceti instability strip. The lines have the same meaning as in Fig. 8.
Current usage metrics show cumulative count of Article Views (full-text article views including HTML views, PDF and ePub downloads, according to the available data) and Abstracts Views on Vision4Press platform.
Data correspond to usage on the plateform after 2015. The current usage metrics is available 48-96 hours after online publication and is updated daily on week days.
Initial download of the metrics may take a while.