Fig. 1.
Download original image
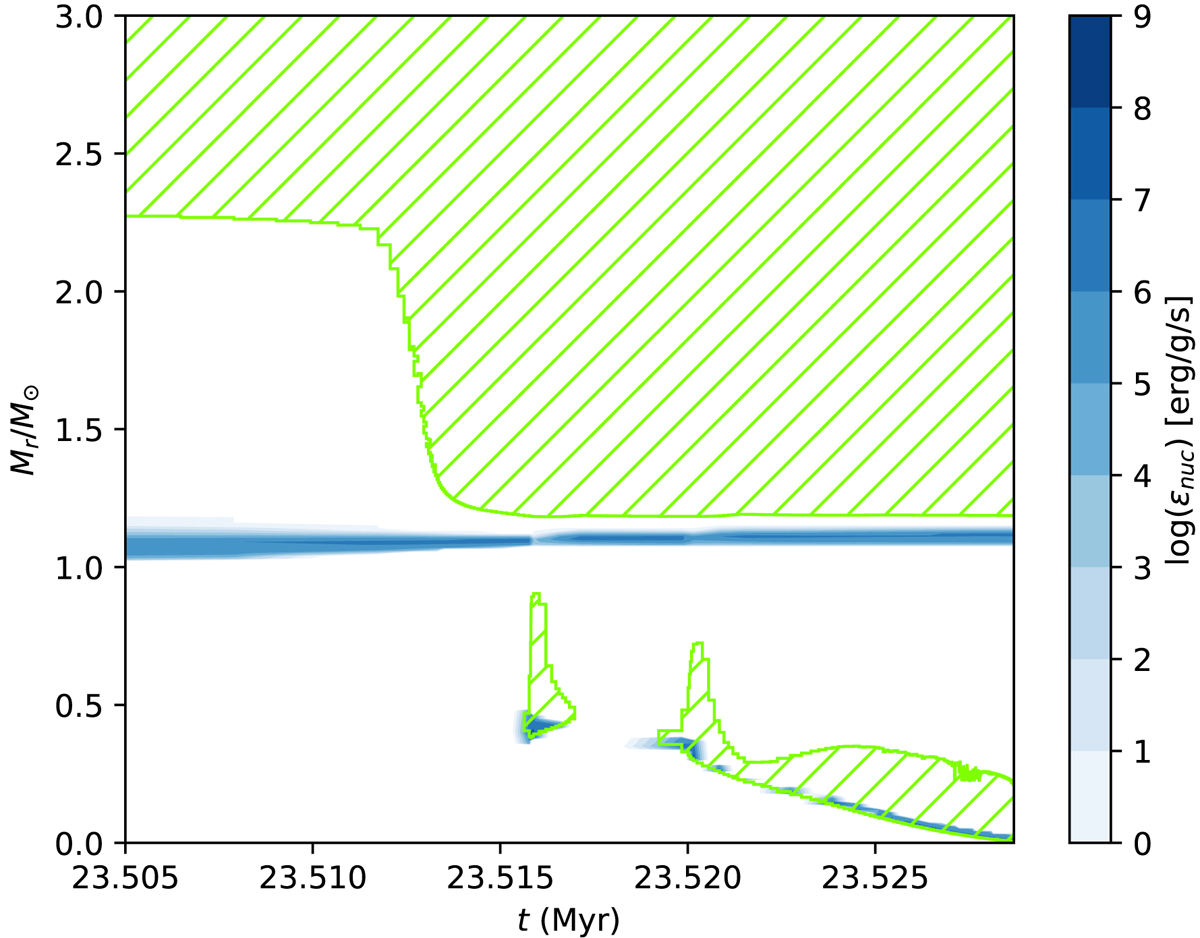
Kippenhahn diagram during the C-burning phase for a model of MZAMS = 10 M⊙ with Z = 0.02, in the absence of extra-mixing processes. The green areas are the convective zones, while the blue scale represents the net energy from nuclear reactions. In this case, the flame successfully reaches the center, leaving a pure ONe core.
Current usage metrics show cumulative count of Article Views (full-text article views including HTML views, PDF and ePub downloads, according to the available data) and Abstracts Views on Vision4Press platform.
Data correspond to usage on the plateform after 2015. The current usage metrics is available 48-96 hours after online publication and is updated daily on week days.
Initial download of the metrics may take a while.