| Issue |
A&A
Volume 658, February 2022
|
|
|---|---|---|
| Article Number | A167 | |
| Number of page(s) | 30 | |
| Section | Stellar atmospheres | |
| DOI | https://doi.org/10.1051/0004-6361/202141976 | |
| Published online | 17 February 2022 | |
Bottom-up dust nucleation theory in oxygen-rich evolved stars
I. Aluminium oxide clusters★
1
Institute of Astronomy, KU Leuven,
Celestijnenlaan 200D,
3001
Leuven,
Belgium
e-mail: david.gobrecht@kuleuven.be
2
School of Chemistry, University of Leeds,
Leeds
LS2 9JT,
UK
3
Departament de Ciència de Materials i Química Física & Institut de Química Teórica i Computacional (IQTCUB), Universitat de Barcelona,
08028
Barcelona,
Spain
4
Institució Catalana de Recerca i Estudis Avanćats (ICREA),
08010
Barcelona,
Spain
5
INAF – Osservatorio Astronomico d’Abruzzo,
Via mentore maggini s.n.c.,
64100
Teramo,
Italy
6
INFN – Sezione di Perugia,
via A. Pascoli,
06123
Perugia,
Italy
Received:
6
August
2021
Accepted:
11
October
2021
Context. Aluminium oxide (alumina; Al2O3) is a promising candidate as a primary dust condensate in the atmospheres of oxygen-rich evolved stars. Therefore, alumina ‘seed’ particles might trigger the onset of stellar dust formation and of stellar mass loss in the wind. However, the formation of alumina dust grains is not well understood.
Aims. We aim to shed light on the initial steps of cosmic dust formation (i.e. nucleation) in oxygen-rich environments via a quantum-chemical bottom-up approach.
Methods. Starting with an elemental gas-phase composition, we construct a detailed chemical-kinetic network that describes the formation and destruction of aluminium-bearing molecules and dust-forming (Al2O3)n clusters up to the size of dimers (n = 2) coagulating to tetramers (n = 4). Intermediary species include the prevalent gas-phase molecules AlO and AlOH as well as AlxOy clusters with x = 1–5, y = 1–6. The resulting extensive network is applied to two model stars, which represent a semi-regular variable and a Mira type, and to different circumstellar gas trajectories, including a non-pulsating outflow and a pulsating model. The growth of larger-sized (Al2O3)n clusters with n = 4–10 is described by the temperature-dependent Gibbs free energies of the most favourable structures (i.e. the global minima clusters) as derived from global optimisation techniques and calculated via density functional theory. We provide energies, bond characteristics, electrostatic properties, and vibrational spectra of the clusters as a function of size, n, and compare these to corundum, which corresponds to the crystalline bulk limit (n →∞).
Results. The circumstellar aluminium gas-phase chemistry in oxygen-rich giants is primarily controlled by AlOH and AlO, which are tightly coupled by the reactions AlO+H2, AlO+H2O, and their reverse. Models of semi-regular variables show comparatively higher AlO abundances, as well as a later onset and a lower efficiency of alumina cluster formation when compared to Mira-like models. The Mira-like models exhibit an efficient cluster production that accounts for more than 90% of the available aluminium content, which is in agreement with the most recent ALMA observations. Chemical equilibrium calculations fail to predict both the alumina cluster formation and the abundance trends of AlO and AlOH in the asymptotic giant branch dust formation zone. Furthermore, we report the discovery of hitherto unreported global minimum candidates and low-energy isomers for cluster sizes n = 7, 9, and 10. A homogeneous nucleation scenario, where Al2O3 monomers are successively added, is energetically viable. However, the formation of the Al2O3 monomer itself represents an energetic bottleneck. Therefore, we provide a bottom-up interpolation of the cluster characteristics towards the bulk limit by excluding the monomer, approximately following an n−1∕3 dependence.
Key words: astrochemistry / molecular processes / stars: AGB and post-AGB / molecular data / stars: atmospheres / dust, extinction
Full Tables B.2 and C.1 are only available at the CDS via anonymous ftp to cdsarc.u-strasbg.fr (130.79.128.5) or via http://cdsarc.u-strasbg.fr/viz-bin/cat/J/A+A/658/A167
© ESO 2022
1 Introduction
Asymptotic giant branch (AGB) stars are a major contributor to the global dust budget in galaxies (Höfner & Olofsson 2018). Owing to their refractory nature, alumina (stoichiometric formula Al2O3) is a promising candidate to represent the first dust condensate in oxygen-rich AGB stars. Related alumina clusters are thought to initiate dustformation in these environments and are often referred to as ‘seed particles’ (Gail & Sedlmayr 2013). However, the sizes and compositions of these aluminium oxide clusters are not well characterised. In this study, we investigate a range of Al:O stoichiometries in order to review these predictions and to construct realistic models of these initial dust seeds. The emergence of a specific condensate is predicted by its condensation temperature (Tielens 2005) and depends on the thermal stability of the solid, as well as on the gas density and its composition. Usually, the evaluation of the stability of the likely condensates is based on macroscopic bulk properties such as the vapour pressure, which is a measure of the volatility of a substance. Hence, the most refractory condensate is expected to have the lowest vapour pressure. Corundum (α-alumina), corresponding to the most stable crystalline bulk form of alumina, fulfils this condition (Gail et al. 2013). The growth and size distribution of dust grains is commonly described by classical nucleation theory (CNT). However, the applicabilityof CNT in an expanding circumstellar envelope has been questioned (Donn & Nuth 1985; Goumans & Bromley 2012; Bromley et al. 2016; Gobrecht et al. 2017). In particular, the concept of vapour pressures and the universal assumption of thermodynamic equilibrium (TE) are in contradiction with the synthesis and growth of dust grains in highly dynamical AGB atmospheres. Moreover, in CNT, the properties of small solids are derived from the (crystalline)bulk material. However, the properties of nano-sized clusters often differ significantly from those of bulk analogues. The constraints associated with extremely small sizes lead to clusters with non-crystalline structures, whose characteristics (e.g. energy, geometry, bond lengths and angles, atomic coordination) differ substantially from those of the bulk material (Bromley & Zwijnenburg 2016). In particular, the energetic stability of such nano-clusters is typically higher than that of clusters with structures directly obtained from ‘top-down’ cuts from the parent bulk crystalline material, which represent metastable, or even unstable, configurations (Lamiel-Garcia et al. 2017). In addition, the concept of surface free energy (or tension), which is fundamental in CNT, is not applicable to small clusters, where it is difficult to differentiate between surface and bulk. Surface energies can only be applied to clusters with fairly large sizes (e.g. facetted bulk cut clusters). We understand nucleation as the formation and growth of stable seed nuclei (i.e. clusters) from prevalent gas-phase molecules, whose abundance varies in time (i.e. is often not in equilibrium). Therefore, a cluster is intermediate in size between a molecule and a bulk solid.
Pure oxygen in the gas phase has no stable forms other than atomic O and molecular O2 and O3. Though solid O2 ice exists in the interstellar medium, its condensation temperature is far too low to instigate circumstellar dust nucleation. A homo-atomic monomeric nucleation, as occurs in the case of carbon (see e.g. Gail et al. 1984), is thus not applicable. Therefore, the nucleation likely proceeds via several chemical elements (i.e. via a hetero-atomic scenario). Inorganic metal oxides are promising nucleation candidates as they are particularly thermally and structurally stable. In fact, the major part of oxygen-rich stardust is in the form of silicates (Henning 2010), which are composed of oxygen, silicon, and at least one other metal (usually Mg or Fe). However, they do not represent the first dust species that emerge in the atmospheres of oxygen-rich AGB stars. The thermal stability of solid enstatite (MgSiO3) and forsterite (Mg2SiO4), corresponding to Mg-rich members of the pyroxene and olivine silicate family, is lower than that of alumina, gehlenite (Ca2Al[AlSiO7]), and spinel (MgAl2O4) (Wetzel et al. 2012; Gail et al. 2013). Despite their refractory nature, these three dust species are limited by the availability of the elements Ca and Al, both being approximately one order of magnitude less abundant than Si. Therefore, refractory Al-bearing condensates could represent seed nuclei in oxygen-rich circumstellar envelopes. Less refractory, but more abundant, materials such as Mg and Fe silicates can condense on the seeds at later stages of the wind acceleration, farther outwards in the circumstellar envelope. Iron-rich silicates are unlikely to be condensation seeds as their large opacity to stellar radiation would lead to the subsequent heating and evaporation of the dust grains (Woitke 2006). Consequently, the inclusion of iron in silicates allows them to act as a thermostat and tends to occur at later stages of the wind acceleration, farther outwards in the stellar wind of AGB stars. Furthermore, nano-sized (Mg-rich) silicates are thought to become important in the interstellar medium (Escatllar et al. 2020).
Some oxygen-rich AGB stars show a spectral emission feature around 13 μm (Little-Marenin & Little 1990), which is commonly attributed to Al–O vibrational stretching and bending modes (Begemann et al. 1997). The carrier of this dust feature has been hypothesised to be spinel (Posch et al. 1999; Fabian et al. 2001) or alumina (Sloan et al. 2003). The strength of the 13 μm feature correlates with some CO2 emission lines in the range of 3.3–16.3 μm (Justtanont et al. 1998). Moreover, inmany stars the 13 μm feature is accompanied by emission features around 11, 20, 28, and 32 μm (Sloan et al. 2003). As potential carriers for these additional emissions, different polymorphs (i.e. crystal structures) of alumina have been suggested (Sargent 2019). A recently conducted microgravity experiment in a sounding rocket has shown that solid Al2O3 exhibits broad emission in the 11–12 μm wavelength range (Ishizuka et al. 2018). Other dust features often seen in oxygen-rich AGB stars are located at around 10 μm and 18 μm, and they are attributed to Si–O stretching and Si–O–Si bending modes, respectively (Hackwell et al. 1970). Observational studies have shown that the features of silicate and alumina can appear together, but also separately (Karovicova et al. 2013; Decin et al. 2017; Takigawa et al. 2017). Stellar sources, showing the 13 μm feature only, include S Ori and RCnC, which exhibit low mass-loss rates of the order of 10−8 M⊙ yr−1 to 10−7 M⊙ yr−1. There are a number of M-type AGB stars that show both the Si–O and the Al–O vibration modes, including GX Mon, W Hya, and R Dor. Stars that show only the silicate feature might also bear alumina, but the emission at 13 μm could be blended with a mantle of silicate material on the grains. This could, for example, be the case for the high mass-loss rate AGB star IK Tau.
The dust shell that is associated with the 13 μm feature is located at 1.4–3 stellar radii (R⋆), whereas the silicate shell associated with the 10 μm and 18 μm features is located farther out, at distances of about 5 R⋆ (Karovicova et al. 2013; Ohnaka et al. 2017; Takigawa et al. 2017). These findings observationally confirm the higher thermal stability of alumina in comparison with Mg-rich silicates. Begemann et al. (1997) derived infrared optical constants for amorphous types of alumina from laboratory experiments and found an emission peaking at 11.5–11.8 μm. Although the amorphous laboratory-synthesised grains reflect the non-crystalline character of the clusters investigated in this study, we note a substantial difference in size. The clusters we consider are (sub-)nanometre-sized, whereas amorphous alumina particles produced by the sol–gel technique are micron-sized (factor of 1000 larger). Demyk et al. (2004) investigated the vibrational properties of (Al2O3)n via cluster beam experiments and found that the band positions depend on the cluster size, n. Small clusters (n ≤ 8) exhibit vibrational bands around 11 μm and the larger sized clusters around 15 μm, pointing towards similarities with the spectra of crystalline γ–alumina, but not with α-alumina.
The evolutionary progression of a star in the AGB phase is reflected by its increasing mass-loss rate that will eventually end in a relatively short superwind phase with a high mass-loss rate (Lagadec & Zijlstra 2008). The AGB mass-loss rate is also correlated with the regularity and, in particular, the period of the stellar pulsations, showing smaller rates for semi-regular AGB stars and larger rates for Mira-type stars (McDonald & Zijlstra 2016). A strikingly large fraction of the stars that show the 13 μm emission feature are semi-regularly variable AGB stars, suggesting that these stars have not yet reached the tip of the AGB and therefore evolutionarily precede Mira-type AGB stars that exhibit regular long-period pulsations (Sloan et al. 1996).
The metal aluminium (Al) is the 11th most abundant element in the Solar System and has an abundance of ~3 × 10⁻⁶ with respect to the total gas (Asplund et al. 2009). Hence, the overall amount of aluminium-bearing molecules, alumina clusters, and dust is limited by the availability of aluminium. In the past few decades, several Al-bearing molecules have been found in circumstellar environments, including AlF (Ziurys et al. 1994), AlCl (Cernicharo & Guelin 1987), AlO (Tenenbaum & Ziurys 2009), and AlOH (Tenenbaum & Ziurys 2010). AlF has the highest bond energy (681 kJ mol−1) of all Al-containing diatomic molecules, followed by AlCl (515 kJ mol−1) and AlO (499 kJ mol−1). These bond energies have been computed in the present study and are in agreement with the compilation of bond energies provided by Luo (2007) and Gail & Sedlmayr (2013). AlCl (and tentatively AlF) was detected in the envelope of the carbon-rich AGB star IRC 102+16 (Cernicharo & Guelin 1987). AlCl is also found in two oxygen-rich AGB stars with different mass-loss rates (Decin et al. 2017). The aluminium-bearing molecules AlO and AlOH were first detected in the envelopes of the red supergiant VY Canis Majoris (Tenenbaum & Ziurys 2009). In subsequent studies, AlO and AlOH were identified by their rotational transitions in the circumstellar envelopes of several low-mass oxygen-rich AGB stars with different mass-loss rates (Kamiński et al. 2016; De Beck et al. 2017; Decin et al. 2017). Moreover, a visible AlO transition from an electronically excited state has been observed in absorption and emission in the spectra of the prototypical star Mira (o Ceti) (Kamiński et al. 2016). Related transition dipole moments and radiative lifetimes of the excited states have been the subject of recent experimental studies (see e.g. Launila & Berg 2011; Bai & Steimle 2020). The photon absorption cross-section at 4823 Å, corresponding to a strong electronic transition (B2Σ+ →X2Σ+) in AlO, was recently experimentally determined by Gómez Martín et al. (2017).
In a previous study, four different species (TiO2, MgO, SiO, and Al2O3) and their role as nucleation candidates in oxygen-rich circumstellar envelopes were examined (Boulangier et al. 2019). The authors assumed a quasi-stationary circumstellar envelope and applied a chemical-kinetic network to a model grid with constant pressures and temperatures. Furthermore, homogeneous and homo-molecular cluster growth was adopted for each of the nucleation candidates. Gobrecht et al. (2016) studied the kinetic nucleation and subsequent coagulation of two dust components, alumina and forsterite. The authors assumed a two-step process, where alumina nucleates first homogeneously, and, subsequently, forsterite condenses heterogeneously on the surface of the alumina seeds. In this study, we focus on Al2O3 as a nucleation candidate (Al2O3) by developing an extensive chemical-kinetic network that makes use of benchmark quantum calculations at a high level of theory (CBS-QB3; Montgomery et al. 2000), includes the reaction rate estimates derived from recent experiments and statistical rate theory, and goes beyond the formation of the smallest formula units (monomers). We then apply the chemical network to two model stars, a semi-regular variable AGB star and a Mira-type AGB star. The circumstellar gas trajectories include a non-pulsating outflow model, described by a β-velocity law, and a pulsating model, described by Lagrangian flows corresponding to the pulsationally induced excursions of a circumstellar post-shock gas.
This paper is organised as follows. In Sect. 2 we describe the methods used to derive the lowest-energy candidate structures and their refinement with quantum-chemical density functional theory (DFT) methods. In Sect. 3, we present the results of the cluster calculations, including energy, structure, and vibrational spectra, as well as the kinetic networks applied to circumstellar gas trajectories. We summarise our findings in Sect. 5.
Parameter ranges used in this study to compute the interionic Buckingham pair potential.
2 Methods
2.1 Global optimisation searches
The computational cost for a geometry optimisation of an aluminium oxide cluster increases with its size (or with the number of atoms or electrons), typically following a power-law. However, our ability to explore the potential energy landscapes is more limited by the number of possible isomers, which exponentially increases with cluster size (Stillinger & Weber 1983; Arslan & Güven 2005). To reduce the number of possible structural configurations to explore (and hence also the computational effort), global optimisation searches for low-energy aluminium-oxide clusters are performed. We employ the Monte Carlo Basin-Hopping (MC-BH) global optimisation technique (Wales & Doye 1998) with interionic pair potentials of an Al–O system to find candidate low-energy clusters. For our purposes, we used an in-house, modified version of the GMIN programme (Bromley & Flikkema 2005). The general form of the interionic Buckingham pair potential (including the Coulomb potential) is
 (1)
(1)
where rij is the relative distance between two atoms, qi and qj the charges of atom i and j, respectively, and A, B and C the Buckinghamparameters. The first term in Eq. (1) describes the interionic electrostatic interactions, the second term the short-range, steric repulsion term due to the Pauli exclusion principle, and the last term describes the attractive van der Waals interaction. The potential describes the repulsion and attraction of charged particles, in this case, of aluminium and oxygen ions within an Al–O containing cluster. To reduce the probability of missing stable configurations in our searches, we used a large number of structurally diverse initial geometries. Moreover, we performed test calculations by swapping the Al and O atoms in the most stable configurations accounting for atomic segregation (i.e. covalent bonds between identical atoms). We applied the parameter set listed in Table 1, commonly used for structure optimisation of Al–O systems (Woodley et al. 1999). The searches cover diverse structural families including compact geometries, void cages and open-cage-like clusters by choosing various seed structures (i.e. initial geometries). In systems like aluminium oxides, electronic polarisation should also play a role. Therefore, we re-optimised our candidate isomers using a potential that describes polarisation via a core-shell model according to the parameters of Bush et al. (1994) using the General Utility Lattice Program (GULP) developed by Gale (1997). We did not find any additional structural isomers, but achieved a more realistic energetic ordering of different cluster isomers with respect to more accurate quantum calculations (see next subsection). Although the use of interionic potentials is an approximation, it enabled us to perform tractable yet thorough searches. With our approach we aimed to minimise the probability of missing stable alumina cluster configurations. For a comparison of the performance of different alumina interionic potentials (i.e. force fields), we refer to Laurens et al. (2020).
2.2 Quantum chemical calculations
For the smallest molecular systems (i.e. up to 12 atoms, slightly more than the size of an alumina dimer), we performed quantum-chemical compound method calculations. Compound methods combine a high level of theory and a small basis set with methods that employ lower levels of theory with larger basis sets. We use the benchmark complete basis set (CBS-QB3) method that extrapolates several single-point energies to a more accurate CBS-QB3 energy in the basis set limit (Montgomery et al. 2000). We note that the CBS-QB3 method is prohibitive for large clusters (>15 atoms). CBS-QB3 calculations were performed for the following species: Al, O, H, Cl, F, H2, H2O, OH, AlO, AlOH, SiO, AlCl, AlF, Al2O, AlO2, OAlOH, Al(OH)2, Al2O2, Al2O3, Al2O4, Al3O2, Al3O3, Al3O4, Al3O5, Al4O3, Al4O4, Al4O5, Al4O6, Al4O7, Al5O4, Al5O5, Al5O6, Al5O7, AlSiO3, and HAlSiO3. Once multiple sets of candidate structures with different initial geometries, temperatures and parameters were found, we refined the ~50–100 most favourable candidate structures for each size in subsequent optimisations at a DFT level of theory using two different hybrid density functionals, B3LYP (Becke 1993) and PBE0 (Perdew et al. 1996), in combination with the 6-311+G(d) basis set. We performed these calculations using the computational chemistry software package Gaussian09 (Frisch et al. 2010). We used f-type orbitals (7F) for the basis functions and an ultrafine grid corresponding to the standard input. The DFT calculations were performed at 0 K and a pressure of 0 atm. In the Born–Oppenheimer approximation used here, the potential energy surface (PES) does not depend on temperature. Hence, the optimised cluster geometry is also temperature-independent. However, the vibrational population and the computation of the thermodynamic quantities (i.e. enthalpy, entropy, and Gibbs free energy) depend on temperature. Moreover, the entropy and the Gibbs free energy are also pressure-dependent. We include a vibrational analysis to calculate the vibrational zero-point energy as well as appropriate partition functions for any other conditions. The partition functions are composed of electronic, translational, rotational, and vibrational contributions and are used to compute the enthalpy, the entropy and eventually the Gibbs free energy. Moreover, a vibrational analysis helps to identify and exclude possible transition states characterised by an imaginary frequency. The predicted vibrational spectra of the clusters can then be compared with astronomical observations and laboratory experiments.
2.3 Transition state theory and RRKM
Rate coefficients for reactions with intermediate local minima on their PESs were calculated with Rice–Ramsperger–Kassel–Markus (RRKM) theory, using the Master Equation Solver for Multi-Energy well Reactions (MESMER) program (Glowacki et al. 2012). The geometries of the Al-containing molecules (reactants, products and intermediates) were first optimised at the B3LYP/6-311+g(2d,p) level of theory within the Gaussian 16 suite of programs (Frisch et al. 2010), and the resulting rotational constants and vibrational frequencies used for the MESMER calculations. The CBS-QB3 method was used to obtain more accurate relative energies of these stationary points. Each intermediate species formed during the reaction was assumed to dissociate back to the reactants or forwards to the products, or be stabilised by collision with H2 as a third body (for the astrochemical environment). The internal energy of each intermediate was divided into a contiguous set of bins (typical width of 110 cm−1) containing abundle of rovibrational states. The density of these bundles was calculated with the theoretical vibrational frequencies and rotational constants, without making a correction for anharmonicity and using a classical density of states treatment for the rotational modes. Each bin was then assigned a set of microcanonical rate coefficients for dissociation to reactants or products (as appropriate). These rate coefficients were determined using an inverse Laplace transformation to link them directly to the capture rate coefficient, calculated using long-range transition state theory(Georgievskii & Klippenstein 2005). The probability of collisional transfer between bins was estimated using the exponential-down model, where the average energy for downward transitions is designated ⟨ ΔE⟩down, and the probabilities for upward transitions were determined by detailed balance ⟨ ΔE⟩down down was treated as temperature-independent, with a value of 200 cm−1 for H2 (Gilbert & Smith 1990). The Master Equation, which describes the evolution with time of the adduct bin populations, was then expressed inmatrix form and solved to yield the rate coefficient for bimolecular reactions and recombination at a specified pressure and temperature.
3 Results
3.1 Precursors of alumina dust
The molecular gas-phase precursors of stoichiometric (Al2O3)n clusters are likely AlO and AlOH, which are the most abundant and prevalent aluminium-bearing molecules in an oxygen-rich circumstellar gas. Furthermore, we include other related aluminium-oxygen-hydrogen species containing Al2O, AlO2, Al2O2, OAlOH, and Al(OH)2, as well as aluminium halides, such as AlF and AlCl. As a first step, we assess the accuracy of the employed electronic structure methods (CBS-QB3, B3LYP, PBE0) and the basis sets (6-311+G(d) and cc-pVTZ). For this purpose, we compare the calculated enthalpies of formation at 0 K ( ) with experimental data of the NIST-JANAF database1 (see Table 2). We note that, in contrast to the binding energies,
  (0) is scaled with respect to the atomic heats of formation. Overall, the CBS-QB3 method results in the most accurate energies for the considered aluminium-bearing molecules.
3.1.1 Molecular dust precursors
In the following, we use the term ‘binding’ energy, which corresponds to the CBS-QB3 energy with respect to the constituent atoms and which is normalised with respect to the number of atoms in the respective molecule or cluster. We note that the binding energies are not scaled to the atomic heats of formation, unlike the JANAF enthalpies of formation. ‘Relative’ energies correspond to the energy difference between two isomers of a given composition and size, typically between the lowest-energy structure and a higher-lying isomer.
Enthalpies of formation,  , at T = 0 K in kJ mol−1 of Al-bearingmolecules for different density functional and basis set combinations used in this study, compared with the JANAF thermochemical database.
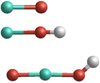 |
Fig. 1 Structures of the molecules AlO, AlOH, and OAlOH. Al atoms are displayed in turquoise, O atoms in red, and H atoms in white. |
AlO
The ground state of AlO (displayed in Fig. 1 has an unpaired electron and has thus a spin multiplicity of 2 (doublet state). Its equilibrium bond length is 1.630 Å, which is in good agreement with the experimental value of 1.618 Å (Huber & Herzberg 1979). The AlO bond dissociation energy is 498 kJ mol−1 (i.e. a binding energy of 249 kJ mol−1 per atom), which in very good agreement to the experimental dissociation energy of 501.9 ± 10.6 (Luo 2007).
AlOH
The singlet state AlOH molecule (also displayed in Fig. 1) can be present in linear or in bent form. At 0 K the linear isomer is more stable than the bent form by only 2.8 kJ mol−1. Although recent findings of Trabelsi & Francisco (2018) indicate a slightly bent form as the AlOH ground state, we find the linear form to be more stable for all temperatures considered in this study. The AlOH binding energy is 327 kJ mol−1. The AlOH dissociation leads either to the products Al+OH with a dissociation energy of 554 kJ mol−1, or to AlO+H with a dissociation energy of 482 kJ mol−1. The two AlOH dissociation channels are highly endothermic and therefore, the molecule is relatively stable once it has formed.
OAlOH
The energetically most favourable geometry of OAlOH (once again illustrated in Fig. 1) shows the terminal H atom bent at an angle of ~45° with respect to the O–Al–O inter-atomic axis. The binding energy of OAlOH is 352 kJ mol−1. OAlOH can be formed by the reaction AlO+H2O. This reaction was studied in detail by Mangan et al. (2021), who show that OAlOH is a minor product of the reaction.
The stability and structure of ground state OAlOH has been investigated by Cobos (2002). We consider three possible dissociation channels of OAlOH. With an energy barrier of 429 kJ mol−1, O + AlOH is the least endothermic reaction, followed by AlO + OH with 485 kJ mol−1 and OAlO+H with 520 kJ mol−1.
The enthalpies of formation (i.e. binding energies), derived from our DFT calculations, seem to be systematically lower than those derived empirically in JANAF (2). However, we note that the JANAF values are often based on incomplete or extrapolated experimental data dating back to the 1970s. Therefore, the tabulated JANAF energies may not be accurate. Nevertheless, it is a standard reference database, and we include those values for comparison purposes. We find better agreement with JANAF by using a larger numerical basis set (cc-pVTZ) compared with a Gaussian type basis set (6-311+G(d)). In addition, we find that the B3LYP functional to provide values in better agreement with the JANAF values than PBE0. The enthalpies derived using the composite CBS-QB3 method shows the closest agreement with the JANAF values, particularly for the case of Al2O2. However, CBS-QB3 tend to be prohibitive for large systems with more than ~15 atoms. Therefore, we use the B3LYP/cc-pVTZ method as a compromise between accuracy and computational feasibility.
3.1.2 Alx Oy (where x = 2–5 and y = 1–6) clusters
The choice of the stoichiometric range (x = 2–5, y = 1–6) of AlxOy clusters (displayed in Table 3) is based on stoichiometric reasoning (i.e. realistic Al:O ratios that are in the vicinity of 2:3) and on the abundances of aluminium and oxygen (and hydrogen). Primarily, the energetic and kinetic stability of the Al–O–H containing species determines their abundances. However, on shorter timescales, the species abundances can be set by the availability of their component (i.e. the elements). For example, despite its lower bond energy (~300 kJ mol−1), AlH is temporarily more abundant than the strongly bound AlO molecule (~500 kJ mol−1), due to the omnipresence of hydrogen. Therefore, we consider AlxOy clusters with no more than one Al atom in excess (i.e. x ≤ y + 1). The molecule Al2O is a linear molecule with a CBS-QB3 binding energy of 355 kJ mol−1, which is relatively large. As a symmetric linear molecule, Al2O cannot be observed by pure rotational spectroscopy, owing to the lack of a permanent dipole moment. A non-zero quadrupole moment is present, but the related transitions are ‘forbidden’. Other Al2O isomers with permanent dipole moments (including triplet states) lie ~300 kJ mol−1 above the electronic ground state and are thus unlikely to be observed by rotational lines (Danilovich et al. 2020). However, we note that asymmetric and bending stretches in Al2O could be observed by (ro-)vibrational spectroscopy.
Also, the global minimum (GM) structure of AlO2 is symmetric and linear and so is not observable by its pure rotational spectrum. Although AlO2 isomers with relative energies below 200 kJ mol−1 exist, their dipole moments are modest making them difficult to detect. The binding energy of AlO2 is 296 kJ mol−1. The lowest-energy Al2O2 configuration has a diamond-shaped, rhombic form and has a binding energy of 386 kJ mol−1 Owing to its symmetry this molecule has no permanent dipole moment. Hence, Al2O2 is not observable by rotational transitions. Asymmetric and bending vibration modes of Al2O2 can be observed, but the related intensities of these vibrations modes are comparatively rather low. The linear Al2O2 isomer has a relative energy of 32 kJ mol−1 above the GM. Moreover, we also find a triplet diamond-shaped Al2O2 molecule with a relative energy of 232 kJ mol−1 above the GM. We conclude that circumstellar Al2O2 is predominantly in the form of the GM structure. Al2O3 corresponds to the monomer of stoichiometric alumina and will be discussed separately in Sect. 3.1.3. The Al2O4 GM candidate shows a flat D2h symmetric structure consisting of a diamond-shaped Al2O2 ring with an extra oxygen atom attached to each of the Al atoms. The Al2O4 binding energy is 414 kJ mol−1.
The lowest-energy Al3O2 configuration has a binding energy of 384 kJ mol−1. It is a bent linear chain with a bond angle of 122.5° on the central Al atom. Similarly, the GM Al3O3 structure is flat and kite-shaped. It can be seen as a composite of Al2O2 and AlO and has a binding energy of 383 kJ mol−1.The Al3O4 GM has a C3v symmetric pyramidal form. It differs from the other AlxOy molecules in the sense that it is the smallest three dimensional molecule in this study and has a three-coordinated O atom (top of the pyramid), as has been noticed previously (Patzer et al. 2005). The binding energy of this structure is 437 kJ mol−1.
The GM Al3O5 structure has a Cs symmetry and was recently reported by Armstrong et al. (2019). The binding energy per atom is 438 kJ mol−1. The geometry as well as the bond energy is very close to that of Al3O4. The dangling oxygen atom is expected to be the most reactive site of the molecule. We also find another structurally similar isomer that is just 8.1 kJ mol−1 higher in energy. It has a three-dimensional geometry with a C2v symmetry and was firstly found by Martinez et al. (2001). The most favourable Al3O6 is a flat structure consisting of a Al3O3 ring having a terminal oxygen atom on each of the three Al atoms (Gowtham et al. 2004). The lowest-energy Al4O3 isomer is a flat arrangement around a central Al atom with a perfect three-fold symmetry (point group D3h). All other investigated geometries did not converge, or, are found to be transition states relaxing to the three-fold GM. The binding energy is 426 kJ mol−1. The most stable Al4O4 configuration is a chain with a rhombus in the centre. The flat C2v -symmetric geometry can be regarded as an Al2O2 diamond with a terminal AlO group on each side. Structurally, Al4O4 can be regarded as a compound of AlO + Al2O2 + AlO. The binding energy at the CBS-QB3 level of theory is 452 kJ mol−1. With respect to the AlO molecule, the Al4O4 dissociation energy is 406 kJ mol−1. The most favourable Al4O5 cluster is a three-dimensional C2v symmetric configuration consisting of two 6-member rings sharing two AlO bonds as previously reported by Zhong et al. (2011). In this configuration all O atoms are two-coordinated and all Al atoms are three-coordinated Its binding energy per atom is quite high (465 kJ mol−1), but still below the alumina dimer (484 kJ mol−1). The isomer with the second lowest energy is still 89 kJ mol−1 above the GM candidate and has a Cs symmetry. Other Al4O5 GM candidates reported in the literature show even larger relative energies and are far above our GM candidate. For example, the GM candidate reported by Lam et al. (2015) is still 97 kJ mol−1 above our finding. The structure of the most stable Al5O4 isomer has been predicted by Das & Raghavachari (2008). We find a CBS-QB3 binding energy of 426 kJ mol−1 per atom. Its negative ion (Al5O ) is found to be a highly symmetric planar structure with strong electron affinity. A very similar quasi-planar structure has also been predicted as a GM candidate for neutral Al5O4 (Armstrong et al. 2019). However, its CBS-QB3 energy is 32 kJ mol−1 above our non-planar GM candidate. The GM isomer candidate of Al5O5 is a flat C2v-symmetric structure consisting of a six-member ring with two cis-oriented terminal Al–O groups. Its CBS-QB3 binding energy is 460 kJ mol−1 per atom and 422 kJ mol−1 per AlO unit. Another GM candidate, reported by (Armstrong et al. 2019), consisting of a Al4O4 cube with an O-Al chain on one of the Al edges, has a CBS-QB3 energy that is 29 kJ mol−1 above our GM candidate. The lowest-energy Al5O6 isomer was also previously found by Armstrong et al. (2019). It has a binding energy of 472 kJ mol−1 and shows no symmetry. A quasi-planar ‘heart’-shaped isomer with a Cs symmetry lies 14 kJ mol−1 above the GM candidate.
GM candidate structures of AlxOy, x = 1–5 y = 1–6 clusters, including binding energies per atom (in kJ mol−1).
3.1.3 Alumina (Al2O3)n, n = 1–10, clusters
Alumina monomer (Al2O3)
The most favourable alumina monomer structure (1A) has a kite-shaped form and is in a triplet state (see Fig. 2). Its geometry is flat and obeys a C2v point symmetry. The binding energy (per atom) on the CBS-QB3 level of theory is 388 kJ mol−1, which is higher than for DFT calculations using the B3LYP functional (359 kJ mol−1) and the PBE0 functional (360 kJ mol−1). The linear singlet alumina monomer (1B) has a relative energy of 15 kJ mol−1, 11 kJ mol−1, and 44 kJ mol−1 above 1A atthe CBS-QB3, B3LYP and PBE0 levels of theory, respectively. All other isomers have significantly higher energies than 1A and 1B, and are metastable with respect to 1A and 1B.
Alumina dimer (Al2O3)2
The GM alumina dimer cluster (2A) is displayed in Fig. 3. The geometry of the GM cluster is a cage composed of four 6-membered rings and shows a tetrahedral symmetry (point group Td). All Al atoms are three-coordinated and all O atoms are two-coordinated, corresponding to the valence of the atoms. Moreover, owing to its symmetry, 2A is characterised by one single bond distance of 1.744 Å for all 12 bonds of the clusters. Owing to its energetic stability, its symmetry and its approximate sphericity, 2A is a natural and logical link between a molecular regime controlled by chemical-kinetics and cluster coagulation (see also Gobrecht et al. 2016). Unfortunately, as a consequenceof the tetrahedral symmetry, 2A has no permanent dipole moment and observations in the IR are challenging. The energetically second-lowest dimer isomer have CBS-QB3, B3LYP and PBE0 energies that are 42 kJ mol−1, 45 kJ mol−1, and 32 kJ mol−1 above 2A, respectively.Owing to this considerable energy difference, only 2A is considered to contribute to the dimer abundance. The CBS-QB3 binding energy of 2A is 484 kJ mol−1 corresponding to the largest binding energy in Table 3. As for the monomer, the CBS-QB3 binding energy is higher than the predictions of B3LYP (442 kJ mol−1) and PBE0 (446 kJ mol−1).
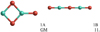 |
Fig. 2 Left: GM structure of the alumina monomer Al2O3 (1A). Right:second lowest-energy isomer of the alumina monomer (1B). |
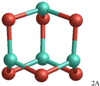 |
Fig. 3 GM structure of the alumina dimer (Al2O3)2 (2A). |
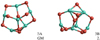 |
Fig. 4 GM candidate structure of the alumina trimer (Al2O3)3. Left: 3A. Right: 3B. |
Alumina trimer (Al2O3)3
The most favourable alumina trimer (3A) is a ‘tea-cosy’-shaped structure (see Fig. 4). The binding energy at the CBS-QB3, B3LYP and PBE0 levels of theory are 515 kJ mol−1, 470 kJ mol−1 and 476 kJ mol−1), respectively. As Li & Cheng (2012) have shown, there are four energetically low-lying structural isomers that are close in energy (all within an energy range of 5.5 kJ mol−1 at the B3LYP/6-311+G(d) level of theory). Consequently, all four isomers are expected to contribute to the overall abundance of alumina trimers. We confirm the narrow spacing in energy of the two most stable configurations (3A and 3B) by more accurate CBS-QB3 calculations. However, we find that 3C, as predicted in Li & Cheng (2012), lies 21 kJ mol−1 (for B3LYP) and 44 kJ mol−1 (for PBE0) above 3A; for 3D we found an imaginary frequency indicating a transition state and not a real minimum. As pointed out, the second most stable trimer (3B) is energetically degenerate as its CBS-QB3, B3LYP and PBE0 energies lie only 0.7 kJ mol−1, 2.1 kJ mol−1 and 0.2 kJ mol−1 above 3A, respectively.
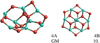 |
Fig. 5 GM candidates of the alumina tetramer (Al2O3)4. Left: 4A. Right: 4B. |
Alumina tetramer (Al2O3)4
The lowest energy configuration of the alumina tetramer (4A) found with the B3LYP functional has no particular symmetry (point group C1). Its B3LYP and PBE0 binding energy are 484 kJ mol−1 and 488 kJ mol−1, respectively. With the PBE0 functional we find a different lowest-energy isomer (4B) showing a highly symmetric D3d structure (see Fig. 5). The binding energy of 4B is found to be 483 kJ mol−1 (B3LYP) and 497 kJ mol−1 (PBE0). Experiments have shown that 4A is the GM structure and indicate that the B3LYP method accurately describes Al2O3 structures (Sierka et al. 2007).
Alumina pentamer (Al2O3)5
The lowest-energy alumina pentamer shows no symmetry (C1) and is displayed in Fig. 6. The B3LYP and PBE0 binding energies of 5A are 492 kJ mol−1 and 497 kJ mol−1, respectively. As for the tetramer (n = 4) we find a different GM candidate (5B) at the PBE0/6-311+G level of theory. 5B has no particular symmetry and lies 5.5 kJ mol−1 above 5A using B3LYP, but is 3.4 kJ mol−1 lower in energy using PBE0. As the energy differences between 5A and 5B are small in calculations using both functionals, B3LYP and PBE0, we conclude that these degenerate structures could both be considered as GM structures and they contribute equally to the pentamer abundance.
Alumina hexamer (Al2O3)6
The most favourable alumina hexamer is shown in Fig. 7. It exhibits a C2h symmetric structure. The binding energy per atom is 499 kJ mol−1 (B3LYP) and 505 kJ mol−1 (PBE0). Due to its symmetry 6A has no net dipole moment. It should be noted that another hexamer (6B) structure is essentially degenerate with an energy of only 0.5 kJ mol−1 above 6A (B3LYP). With the PBE0 functional, the energy difference between 6A and 6B is larger (14.5 kJ mol−1) though also not significantly different. This degeneracy has already been noted by Li & Cheng (2012). We applied a larger basis set (cc-pVTZ) to 6A and 6B to test the reliability of our results with the 6-311+G(d,p) basis set. We find that 6A is lower than 6B by 5.9 kJ mol−1 (B3LYP/cc-pVTZ) and 21.0 kJ mol−1 (PBE0/cc-pVTZ). These results indicate that the calculations with the 6-311+G(d,p) basis set are well-founded and that 6A is indeed the lowest-energy isomer for n = 6 though structure 6B is relatively close in energy. Structure 6B has no symmetry (C1). Its binding energy at the B3LYP and PBE0 level of theory are 499 kJ mol−1 and 505 kJ mol−1, respectively.
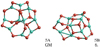 |
Fig. 6 GM candidates of the alumina pentamer (Al2O3)5. Left: 5A. Right: 5B. |
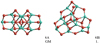 |
Fig. 7 GM candidates of the alumina hexamer (Al2O3)6. Left: 6A. Right: 6B. |
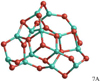 |
Fig. 8 GM candidate (7A) of the alumina heptamer (Al2O3)7. |
Alumina heptamer (Al2O3)7
We report the discovery of six energetically low-lying isomers (7A, 7B, 7D, 7E, 7F, 7G) including a GM candidate (7A), which are shown in Figs. 8 and 9. To our knowledge, these six isomers were hitherto not reported. 7A does not show any symmetry and have B3LYP and PBE0 binding energies of 504 kJ mol−1 and 509 kJ mol−1 per atom, respectively.
Using the PBE0 functional, we find a different lowest-energy isomer (7J) that was previously reported by Rahane et al. (2011). As for n = 6, we perform benchmark calculations of 7A and 7J with a larger, numerical basis set (cc-pVTZ) revealing that 7A is lower in energy (B3LYP/cc-pVTZ: 102.6 kJ mol−1, PBE0/cc-pVTZ: 16.6 kJ mol−1) than 7J (seeFig. 9). Therefore, we assume 7A to be the GM candidate.
Using the cc-pVTZ basis set, we note that the relative energies of 7A and 7J differ by more than 80 kJ mol−1, comparing B3LYP with PBE0. Moreover, the energetic ordering of the structural isomers is very different for PBE0/6-311+G(d) (7J,7A) and B3LYP/6-311+G(d) (7A,7B,7C,7D,7E,7F,7G,7H,7I,7J). This is a rather surprising result, as the hybrid density functionals B3LYP and PBE0 differ primarily by the amount of Hartree–Fock (HF) exchange (PBE0: 25%, B3LYP: 20%), which is rather small. We conclude that the alumina n = 7 isomer energies are very sensitive to the choice of the functional (amount of HF exchange). A thorough study on the sensitivity is beyond the scope of this paper, but the set of isomers 7A–7J could be useful as a test case for the performance of (hybrid) density functionals.
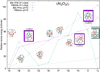 |
Fig. 9 Relative energies of the lowest-energy alumina heptamer isomers (Al2O3)7. Structures reported by Li & Cheng (2012) are indicated in violet as LC2012 and the GM candidate reported by Rahane et al. (2011) in green as RDK2010. |
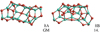 |
Fig. 10 GM candidate structures of the alumina octamer (Al2O3)8. |
Alumina octamer (Al2O3)8
The lowest-lying alumina octamer clusters are extensively discussed and reported in Gobrecht et al. (2018). Here we summarise our main findings. As for n = 4, 5, and 7 we also find for n = 8 different GM structures depending on whether the PBE0 or the B3LYP functional is applied in combinationwith the 6-311+G(d) basis set. With the B3LYP functional, the lowest-energy isomer (8A) is a C2 symmetric structure (see Fig. 10). Its B3LYP and PBE0 binding energies (per atom) are 507 kJ mol−1 and 513 kJ mol−1, respectively.Isomer 8B has no special symmetry and B3LYP and PBE0 energies of 507 kJ mol−1 and 514 kJ mol−1, respectively.Both structures, 8A and 8B, show geometries with large aspect ratios.
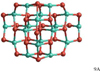 |
Fig. 11 GM candidate (9A) of the alumina nonamer (Al2O3)9. |
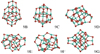 |
Fig. 12 Low-energy isomers of the alumina nonamer (Al2O3)9. |
Alumina nonamer (Al2O3)9
The most favourable isomer for n = 9 is a Cs symmetric structure depicted in Fig. 11. Its overall shape resembles a tetrahedron with a four-coordinated oxygen atom in the centre. This cluster structure strongly resembles a truncated block of α-alumina, also showing four-coordinated oxygen atoms. With two three-coordinated exceptions, the Al atoms are four-coordinated and are located at the surface of the cluster. By the method of mirror images one could artificially increase the size of 9A resulting in six-coordinated Al atoms and four-coordinated Al atoms with similar bond angles as in α-alumina. For 9A, we find binding energies of 514 kJ mol−1 (B3LYP) and 520 kJ mol−1 (PBE0), respectively. Furthermore, we find five other hitherto unreported, energetically metastable structures (9B, 9C, 9D, 9E, 9F) with relative energies >45 kJ mol−1 above 9A (see Fig. 12). It is unexpected that four out of the six newly discovered low-energy isomers show a high degree of symmetry. Structure 9G corresponds to the GM candidate reported by Rahane et al. (2011).
Alumina decamer (Al2O3)10
We present a new GM candidate isomer for n = 10 without a particular symmetry (space group C1; see Fig. 13). On the B3LYP and PBE0 level of theory, the binding energy of 10A is 515 kJ mol−1 and 521 kJ mol−1, respectively.
Our search also resulted in 22 further structures that lie below the GM candidate of Rahane et al. (2011) that have relative energies of 29–180 kJ mol−1 with respectto 10A. We show the next higher-lying decamer isomers (10B, 10C, 10D, 10E, 10F, 10G) in Fig. 14 to give the reader an impression of the structural complexity, the narrow energy spacing, and the extent of our searches. The energetic ordering and the relative energies of the investigated alumina decamers are largely independent of the used functional (B3LYP und PBE0).
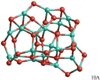 |
Fig. 13 GM candidate (10A) of the alumina decamer (Al2O3)10. |
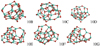 |
Fig. 14 Low-energy isomers (top: 10B, 10C, 10D; bottom: 10E, 10F, 10G) of the alumina decamer ((Al2O3)10). |
3.2 Thermodynamic viability of the monomer formation
We investigate several chemical-kinetic formation routes towards the monomers (Al2O3) and dimers (Al4O6) alumina clusters. The dimers can coagulate to tetramers (Al8O12) marking the end point of our chemical-kinetic description. The subsequent cluster nucleation and growth is treated homogeneously as a function of cluster size, n (see Sect. 3.8). A recent study investigated the kinetic formation of alumina tetramers via elementary reactions by means of transition state theory (TST) and RRKM calculations (Saba et al. 2021). However, in contrast to our current study, the authors do not consider the nucleation at astrophysical sites like circumstellar envelopes. Consequently, Saba et al. (2021) do not include hydrogenated aluminium oxides, describe the oxidation reactions by O2 and O only, and uses the high-pressure limit.
As a first step we assess the viability of a reaction according to its reaction enthalpy and its temperature-dependent Gibbs free reaction energy as derived from the CBS-QB3 calculations. In contrast to the previous subsections, the reactionenergy, or enthalpy, corresponds to the sum of the total energies, which are not normalised to the atoms. The structural viability is subsequently investigated by reaction trajectory calculations as described in Sect. 2.3, accounting for geometrical rearrangements (i.e. breaking and formation of chemical bonds). In the end, it is the kinetics and related energy barriers controlling the chemistry. However, the energetic viability (i.e. the exogonicity) is a necessary but insufficient prerequisite for a chemical reaction to occur. These principal reaction viabilities are addressed in the following. The reaction scheme linking these molecular precursors to the Al2O3 monomer isdisplayed in Fig. 15. All considered AlxOyHz molecules and clusters up to the size of a dimer are linked to each other by various chemical reactions that can proceed in both directions, forwards and backwards (see Figs. 15 and 16). AlO can react with itself to form Al2O + O, AlO2+Al, or, Al2O2 via the termolecular channel (–548 kJ mol−1). The first product channel towards Al2O + O is exothermic by 70 kJ mol−1 at 0 K and becomes less favourable (endergonic) around 1800 K. The products AlO2+Al are suppressed for all temperatures by at least 100 kJ mol−1. AlOH might also react with itself in order to form Al2O2 and H2, which has a heat of reaction of –21 kJ mol−1. However, at temperatures above 300 K, this process is suppressed as it becomes increasingly endergonic. Moreover, the reaction involves the breaking of two O–H bonds and the recombination of two H atoms to H2. Instead, it is more likely that two AlOH molecules form Al2O + H2O (Δ Hr (0 K) = –26 kJ mol−1). This process becomes endergonic above 700 K. AlO and AlOH can also react with each other to form either Al2O2+H or Al2O + OH. The channel AlO2+AlH is not considered here as it has a large reaction endothermicity (~300 kJ mol−1) and it involves multiple bond breaking (Al–O and O–H). Also, the possible products OAlOH and Al are suppressed by energy barriers (>70 kJ mol−1) and by structural hindrance. Therefore, the primary products of AlO and AlOH are Al2O and Al2O2.
The oxidations in Fig. 15 are described by reactions with the prevalent species H2O and OH, but also with CO2, and O2. In terms of electronic energies (at T = 0 K), oxidations by OH are most favourable. If the oxidation reaction proceeds instead via H2O, the reaction enthalpy is +56.5 kJ mol−1 higher. Oxidations by O2 (+71.0 kJ mol−1) and CO2 (+105.5 kJ mol−1) are less energetically favourable than oxidations by OH.
To form the monomer (i.e. Al2O3), Al2O or Al2O2 need to be oxidised. The double oxidation of Al2O by water has been suggested by Dell’Agli et al. (2014). Moreover, Gobrecht et al. (2016) described a kinetic formation of the monomer by Al2O2+H2O. However, the oxidation of Al2O2 to the alumina monomer, Al2O3, is hampered by substantial endothermicities. In the case of an oxidation by H2O, the reaction is endothermic by ΔHr = +85 kJ mol−1. Though the oxidation by OH is less endothermic (+28 kJ mol−1), the reverse reaction (Al2O3 + H) proceeds on much faster timescales owing to the large abundance of atomic hydrogen (H). From an energetic perspective, the comparatively stable compounds Al2O and Al2O2 represent energetic bottlenecks in the synthesis of the alumina monomer. Hence, an efficient alumina formation route does not involve Al2O and Al2O2, or, does not proceed via the monomer. We consider also the possibility that the monomer forms via the species AlO2. The reaction enthalpy of AlO2+AlOH to Al2O3 and H is exothermic by 72 kJ mol−1 at 0 K and stays exothermic up to T = 2700 K. However, the formation of AlO2 itself is hampered. The oxidation of AlO by OH is endothermic by 36 kJ mol−1 as discussed above. AlOH is even harder to oxidise and requires for OH an energy of at least 80 kJ mol−1. Oxidations by other species, such as H2O, CO2, and O2, have even larger endothermicities, as indicated in Fig. 15. Depending on the environment conditions, H2O, CO2, and O2 might be more abundant than OH, and can thus increase their reaction fluxes and oxidation efficiencies. Furthermore, for temperatures T > 0, vibrational and rotational contributions of the reacting species can change the order of the favoured oxidiser. The oxidation of Al2O2 to Al2O3 is endothermic at 0 K, but at 4000 K the free energies of reaction would allow for oxidations by OH and CO2, but not by H2O and O2. Oxidations by atomic O are energetically most favourable. However, for molecules and small clusters, such reactions require a third body M as catalyst to absorb the excess energy and stabilise the reaction product. This is a consequence of the low pressures prevailing in AGB circumstellar envelopes making an autocatalysis unlikely. Larger-sized clusters (n ≥ 4) can be oxidised by atomic O more easily, since their density of states is high allowing for ro-vibrational relaxations without the presence of a third body M. Thus, although these oxidations by atomic O are the most exothermic ones, they proceed rather slowly for the smallest species, representing the starting point of a bottom-up approach, and require sufficiently high gas densities. For a typical termolecular association rate these gas densities need to be of the order of > 1014 cm−3 in order to compete with other bimolecular reactions.
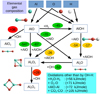 |
Fig. 15 Reaction scheme: Formation routes towards the alumina monomer (Al2O3). Reaction enthalpies are given in kJ mol−1 and colour-coded according to their values. Red corresponds to suppressed exothermic reactions (ΔH > 0 kJ mol−1), yellow to slightly exothermic reactions (ΔH > −30 kJ mol−1), and green to very exothermic reactions (ΔH < −30 kJ mol−1). |
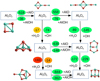 |
Fig. 16 Reaction scheme: formation routes towards the alumina dimer. Reaction enthalpies are given in kJ mol−1, and the colour-coding is the same as in Fig. 15, where very exothermic reactions are colour-coded in green, slightly exothermic reactions in orange, and endothermic reactions in red. |
3.3 Chemical-kinetic network
3.3.1 Gas-phase reactions
Starting with the atoms Al, O, and H and assuming a pure atomic gas-phase mixture, the molecules AlO and AlOH can form via
 (2)
(2)
 (3)
(3)
where M denotes an inert molecule acting as a catalyst and removing the reaction excess energy. The reaction Al+OH+M → AlOH+M is in principle also possible, once OH has formed and is available as a reagent. As an alternative to a purely atomic gas, thermodynamic (chemical) equilibrium abundances can also be used as a starting point. However, the choice of the initial conditions (atomic versus TE abundances) has only minor effects on the final abundances, as will be shown in Sect. 3.5. From RRKM unimolecular decomposition calculations of AlO and AlOH, we fit and deduce kinetic rates for the reverse processes of reactions (2) and (3). We find activation barriers of 477 kJ mol−1 and 466 kJ mol−1 for the dissociation of AlO and AlOH, respectively. Atomic Al can also react with OH in a bimolecular reaction to form AlO
 (4)
(4)
A seriesof trajectories were run on reaction (4), using the atom-centered density matrix propagation (ADMP) molecular dynamics model (Schlegel et al. 2002). Because of the severe change in reduced mass of the system (H is one of the products), the reaction dynamics are constrained even though the reaction is exothermic by 72 kJ mol−1. The reactions takes place on both singlet and triplet surfaces. Although there is an energy barrier on the triplet surface, the barrier is ‘late’ (i.e. between the intermediate AlOH and the products AlO+H) and, importantly, the barrier height is 50 kJ mol−1 below the height of the reactants Al + OH. There are two requirements for successful reaction: the OH must be vibratingwith at least 2 quanta of vibrational energy (corresponding to a vibrational temperature of ~2 × 5300 K); and the collision energy needs to be modest (to allow angular momentum to be conserved), corresponding to a kinetic temperature of 500 K or less. These two requirements are counter to each other: high temperature is needed for a significant OH vibrational population, but low temperatures to favour the modest collision energy. The rate coefficient was then constructed by multiplying a typical collision frequency (5 × 10⁻¹⁰ cm3 s−1) by the probability that the collision energy is less than 1.5 kB T where T = 500 K, and the probability that the OH has at least 2 vibrational quanta. This results in the Arrhenius expression of reaction 161in Table B.1. The alternative product channel AlH+O is very endothermic (+125 kJ mol−1) and thus not included in our network.
Once formed, the concentrations of AlO and AlOH are primarily regulated by the reaction
 (5)
(5)
This reaction is exothermic by –45 kJ mol−1. Despite its exothermicity, experiments led by Parnis et al. (1989) showed a negligible reactivity of AlO with H2 and, hence, give an upper limit of the bimolecular rate constant of 5 × 10⁻¹⁴ cm3 s−1 at room temperature. A more recent study (Mangan et al. 2021) experimentally determined the reaction rate of Eq. (5) including a detailed characterisation of the PES, showing good agreement with the theoretical study of Sharipov et al. (2011). The products AlOH + H form predominantly through H atom abstraction via a linear Al–O–H–H transition state lying 45 kJ mol−1 above the reagents AlO+H2. Despite the reaction barrier of 45 kJ mol−1, the best fit with respect to the experimental data points results in a lower barrier height of 31 kJ mol−1. Another product of reaction (5) is Al+H2O. However, its branching ratio is negligibly small (0.008%). The resulting kinetic rate for reaction (5) is temperature-dependent and has an activation energy corresponding to an equivalent temperature of 2030 K.
Another process impacting the balance of AlO and AlOH is the reaction
 (6)
(6)
which has a reaction enthalpy of +11.6 kJ mol−1. Mangan et al. (2021) found that this reaction proceeds predominantly via an AlO–H2O adduct with a small submerged barrier re-arranging to Al(OH)2, which finally dissociates to AlOH and OH without a barrier. A direct pathway via a quasi-linear transition state involves a barrier of 60 kJ mol−1 and is not competitive. An alternative product channel of Eq. (6) is OAlOH + H showing also a slightly endothermic reaction enthalpy (+8.6 kJ mol−1). Since a direct reaction route via a OAlOH2 transition state involves a significant barrier of 87 kJ mol−1, the dominant OAlOH production channel takes course via the dissociation of Al(OH)2, similar to in the AlOH production channel. The formation of AlO2 and H2 is very endothermic.
The reaction of AlO+OH can also form AlOH. However, although it is exothermic by 56 kJ mol−1, it was foundto proceed rather slowly. ADMP trajectories on the triplet surface (which connects with the products AlOH + O(3 P) in their electronic ground states) show that this reaction requires the AlO to have at least 1 quantum of vibrational excitation corresponding to a vibrational temperature of 1370 K. A low collision energy is also required, corresponding to a kinetic temperature of 600 K or less, and the reaction cross-section has a relatively small impact parameter (<0.5 Å). The resulting rate coefficient between 1000 and 2000 K is around 3 × 10⁻¹² cm3 s−1 with a small temperature dependence. The alternative reaction channel forming AlO2 + H is endothermic by 35 kJ mol−1 and is characterised by a large decrease in reduced mass, and so is not competitive with the AlOH + O product channel. Finally, we examine alumina dimer (i.e. Al4O6) formation pathways that do not involve the unfavourable alumina monomer (see Sect. 3.2). We find an enhanced stability of (AlO)x, x = 1−4, clusters with an Al:O stoichiometry of 1:1, compared to small AlxOy, x, y = 1−4, x≠ y clusters with a different stoichiometry than 1:1 (see Table 3). These findings are consistent with the results of Patzer et al. (2005) and Lam et al. (2015). Consequently, it is instructive to consider reactions within the stability valley of the (AlO)x, x = 1–4, clusters. The successive addition of AlO molecules
 (7)
(7)
is energetically favourable as the number of strong Al–O bonds (~500 kJ mol−1 per bond) increases naturally with size x. However, this process requires a third body M and is therefore only effective in the densest circumstellar regimes (typically ngas > 1014 cm−3), or once x is large enough.
The successive addition of AlOH molecules
 (8)
(8)
proceeds as bimolecular reactions, but have significantly lower heat of reactions (lower by 482 kJ mol−1 at T = 0 K), corresponding to the dissociation energy of AlOH → AlO+H as compared to the AlO addition, since the ejection of an H atom is energetically expensive. Nevertheless, for x = 1–3, the reaction with AlOH is energetically viable with enthalpies of −65.9 kJ mol−1 (x = 1), –36.0 kJ mol−1 (x = 2), and –76.0 kJ mol−1 (x = 3). For x = 4 (Al4O4 + AlOH → Al5O5 + H) the enthalpy is still slightly exothermic by –3.9 kJ mol−1, but at higher temperatures (>100 K) the reaction becomes endothermic/endergonic. It is thus probable that a subsequent cluster growth reaction departs from an Al:O stoichiometry of 1:1. Therefore, starting with Al2O2 (see Fig. 16) the formation of Al3O3 is energetically viable. The oxidations of Al3O3 and Al4O4 are both exothermic and can readily form Al3O4 and Al4O5. However, the oxidations of Al3O4 represent anenergetic bottleneck, since only the oxidation by OH is energetically viable.
Once the alumina dimer (Al4O6) is formed, we assume that it coagulates to the alumina tetramer (Al8O12) in a very exothermic reaction. The alumina dimer can also react with Al-bearing species other than itself to form products containing five to seven Al atoms. Due to the exothermicity of many cluster growth reactions, these processes are likely to occur. A characterisation of these intermediate Al–O–H cluster species and related kinetic pathways will be the subject of a future study. However, owing to the exponentially increasing number of possible reaction pathways, we do not explicitly take these intermediate species into account in this study, but subsume them by an association reaction. This allows us to neatly link the kinetically controlled regime with the larger-sized (Al2O3)n clusters with n ≥ 4.
3.3.2 Kinetic rate evaluation
For large reactive systems, it is very expensive to calculate the PES including all possible and unknown transition states. Therefore, we assess kinetic rates involving more than six atoms with collision and capture theory. Exothermic reactions without a barrier of the form A+B can proceed at the collision frequency, which is given as
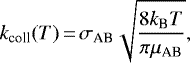 (9)
(9)
where  is the (geometrical) cross-section,
  is the reduced mass and kB the Boltzmann constant. The radii rA and rB of species A and B are determined from the calculated structures. In Table E.1, we provide two sets of cluster volumes and radii. The first set is derived from atomic core coordinates and calculated by Delauney triangulation. The second set exhibits larger values, as it also includes ‘electron interaction’ volumes derived from atomic van der Waals radii. Owing to its T0.5 temperature dependence, the collisional frequency is increased by a factor of
  for a characteristic (circum-)stellar temperature of 3000 K, as compared to room temperature. At these elevated temperatures the collision rate can take large values in many cases and is rather simplistic. In the kinetic network shown in Table B.1, we included two collision rates proceeding via the formation of intermediates that decompose in either direction without a barrier (denoted as ‘collision’). However, the majority of the reactions considered in this study have a more complex PES and are not well described by simple collision theory.
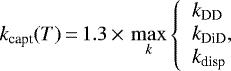
In addition to a pure geometric collision also long-range interactions between the reactants can contribute to the cross-section. These interactions can be taken into account by using van der Waals radii, which are larger than the geometric radii and account for the spatial occupancy of the bond atoms. Generally, the long-range interaction effect can also be included directly in the rate expression. For example, in the reaction AlO+H2 dipole-induced dipole forces or Debye forces, denoted as kDiD, and dispersive or London forces, denoted as kdisp, act. If both reagents are polar (which is not the case for H2) also dipole-dipole forces, denoted as kDD, are present. To quantify and summarise the contribution of the long-range forces we use the form introduced by Georgievskii & Klippenstein (2005):
 (10)
(10)
where kcapt is the so calledcapture rate and corresponds to the upper limit for the rate of an exothermic reaction. The detailed calculation of kDD, kDiD, and kdisp including the factor of 1.3 can be found in Georgievskii & Klippenstein (2005). In addition to the mass of the reagents, the calculation of capture rates requires the knowledge of the dipole moments, approximate polarisabilities, and vertical ionisation potentials. In our network (in Table B.1), the capture rate is used for 46 exothermic reactions (denoted as ‘capture’), where the investigation of the PES is too expensive and TST- or RRKM-based rates are not obtainable. The majority of the capture rates are dominated by dispersive forces and show a  dependence. Dipole–dipole interactions,which follow a
  dependence,are predominant for just three rates in our kinetic network.
In order to calculate the rates for the reverse (endothermic) reactions, we applied the principle of detailed balance (for more details, see Eq. (A.1)). By fitting the reverse rate, we find Arrhenius-parametrised rate expressions (denoted as ‘detailed balance’ in Table B.1). In some cases the fitting results in unphysically high pre-exponential factors A of > 2 × 10⁻⁹ cm3 s−1. The large pre-exponential factors tend to occur in reactions where the reduced mass of the products is much smaller than the reactants (typically when one of the products is H or H2). In these cases the conservation of angular momentum constrains the reaction cross-section. In such cases, we do not use the unphysically large detailed balance rates but apply a capture rate with energy barrier corresponding to the CBS-QB3 0K enthalpy (denoted as ‘reverse capture’ in Table B.1).
The basic chemical network consists of 54 atomic, molecular and cluster species and 163 individual reactions that can be found in Table B.1 of the Appendix. We are aware that this network is not complete in terms of species (e.g. sulphur-containing species) and processes (e.g. ionisation) considered. However, we ran test calculations with an extensive kinetic network including 50 additional non-aluminium-bearing species and 286 additional reactions. Moreover, we carefully build up a chemical-kinetic network by either using rates from our extensive literature search or, where these do not exist, by estimating rate coefficients using currently available sound theoretical methods. Thereby, we always respect the balance between forward and backward reactions, instead of adopting rates from (astro-)chemical kinetic rate databases. We note that some rate expressions differ from the simple Arrhenius parametrisation, as their complex temperature dependence cannot be represented by an Arrhenius formulation. Furthermore, some rates are based on the Lindemann expression consisting of high- and low-pressure-limiting rate terms. In circumstellar envelopes, we can safely ignore the high-pressure limit and use the low-pressure limit for the rate constant, as the prevailing pressures are orders of magnitude below 1 atm. Consequently, dissociations typically proceed via bimolecular channels as collisions with a body M. However, a photolysis or photodissociation (i.e. a decay induced by high-energy photons) is also possible. Finally, we include the photodissociations of AlO, AlOH, and Al2O. The photolysis rates of AlO, AlOH, and Al2O were estimated using time-dependent density function theory (TD-DFT) (Bauernschmitt & Ahlrichs 1996). The vertical excitation energies and transition dipole moments were calculated for transitions from the ground state of each molecule up to the first 30 electronically excited states. The resulting absorption cross-section for each molecule was then convolved up to its dissociation threshold with a model stellar irradiance flux from the MARCS database for an evolved star with T⋆ = 2500 K (Gustafsson et al. 2008). Oxygen-rich AGB stars typically show moderately lower effective temperatures (T = 2000–2400 K), but there are no MARCS models with T < 2500 K available. The photolysis thresholds were set to correspond to the bond dissociation energies, giving 252, 238 and 213 nm for AlO, AlOH and Al2O, respectively.We note that these are upper limits to the dissociation threshold wavelengths, because a photon with more than the bond energymay be required depending on the position of the upper dissociating electronic state of the molecule. The photolysis rate was then computed as a function of temperature by red-shifting the photolysis threshold to reflect the increasing internal energy of the molecule with temperature. The resulting photodissociation rates at 1 stellar radius are listed in Table B.1. For radial distances farther out in the envelope, we assume a geometrical dilution (∝ R−2) of the stellar radiation field, and no attenuation by dust.
3.4 Equilibrium abundances
To compare our chemical-kinetic derived non-equilibrium abundances (see Sect. 3.5) with TE abundances, we perform calculations with the chemical equilibrium software GGchem (Woitke et al. 2018). Moreover, we add the alumina-related cluster species presented in this study to the list of molecules.
For convenience, we provide the fitting parameters a, b, c, d, e in the form presented in Stock et al. (2018) for the term  , namely
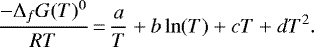 (11)
(11)
The fitting parameters a, b, c, d, e for all aluminium-bearing species used in this study are provided in Table D.1 of the appendix. We note that  , since Δf G(T) includes, like the JANAF-NIST thermochemical tables, a scaling to the atomic (elemental) heats of formation with their corresponding stoichiometric factors. Thus,
  corresponds to the real, unscaled free energies of formation at 0 K. We perform TE calculations for different C/O ratios of 0.4, 0.7, and 1.0, and for a typical atmospheric (photospheric) pressure of 10−5 bar as a function of temperature pertaining to the dust formation zone in oxygen-rich AGB stars.
First, we present the abundances of the prevalent molecular species CO and SiO including the oxidation agents as OH, H2O, CO2, and O2 (see upper panel of Fig. 17). The most abundant molecules (apart from H2) in oxygen-rich conditions are CO and H2O showing fractional abundances above 10−4. At temperatures T ≥2200 K the OH and H abundances increase at the cost of H2O. SiO is also fairly abundant with a value of >10−5 up to T = 2700 K. CO2 and O2 play a comparatively minor role hardly exceeding 10−6 on the abundance scale. CO2 is moderately abundant at lower temperatures (T ≤ 2200), and O2 only at higher temperatures. We note that CO2 and O2 not only show lower equilibrium abundances than H2O and OH, but also the corresponding kinetic oxidations are comparatively less exothermic in the kinetic models (see Fig. 15 and related discussion). Therefore, H2O and OH should represent the primary oxidation species. The C/O = 1.0 models (dot-dashed lines), characterising atmospheres of chemical transient S-type AGB stars, show generally lower abundances of the prevalent, oxygen-bearing molecules, except for CO, where the abundance is higher. This result is not unexpected in equilibrium conditions, as a C/O close to unity leaves little oxygen available to form other molecules.
The TE abundances of the aluminium-bearing molecules are shown in the middle panel of Fig. 17. They can be roughly grouped in three temperature zones: at high temperatures above T ≥2500 K, aluminium is predominantly in ionised form (Al+), in the intermediate temperature range (T = 2000–2500 K) atomic Al is the primary aluminium carrier, and for lower temperatures (T ≤ 2000 K)) the molecules AlOH and Al2O are the most abundant gas-phase species. The TE AlO abundance reaches its maximum (~10−8) around T = 2130 K whereas AlO2 has negligible abundances. In the C/O = 1.0 case, AlOH is shifted towards lower temperatures, whereas AlO peaks at higher temperatures with respect to the C/O = 0.4 and C/O = 0.7 cases.
In the bottom panel of Fig. 17, clusters acting as potential intermediates (OAlOH, Al3O3, AlSiO3, Al4O4, Al4O5, Al4O6, AlO2H2) in the cluster nucleation route are included. At temperatures below T < 800 K the equilibrium alumina dimer (Al4O6) abundance dominates the aluminium content. The steep decrease beyond T = 800 K is accompanied with a sharp rise of the species AlOH and Al2O (see middle panel). Moreover, except for OAlOH and AlO2H2, the abundances of the intermediates are negligible for temperatures above T = 1000 K.
In summary, under the conditions of TE, alumina dimers (and larger compounds with same stoichiometry) do not form in significant quantities at temperatures above T = 800 K. This is inconsistent with observations of the higher temperatures found in the dust formation zone. Therefore, chemical equilibrium fails to predict the onset of alumina dust formation, assuming that the nucleation proceeds via the stable and promising dimer cluster.
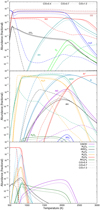 |
Fig. 17 Upper panel: TE abundances of the abundant molecules CO, CO2, H2O (black), OH, and O2 as a function of temperature for different C/O ratios. Middle panel: TE abundances of the aluminium-bearing molecules AlO, AlOH, Al2O, and AlO2 as well as Al and Al+, as a function of temperature for different C/O ratios. Lower panel: TE abundances of the aluminium-bearing clusters OAlOH, Al(OH)2, Al3O3, Al4O4, Al4O5, Al4O6, and AlSiO3, which participate in the formation of the alumina dimer (Al4O6), as a function of temperature for different C/O ratios. Straight lines correspond to C/O = 0.4, dashed lines to C/O = 0.7, and dashed-dotted line to C/O = 1.0, respectively. The pressure is kept constant at 10−5 bar. |
3.5 Non-equilibrium chemical-kinetic models
For the non-equilibrium computations we use a chemical-kinetic reaction network (instead of assuming chemical equilibrium), which is given in the Appendix B.1. Furthermore, we expose the chemical species to different hydrodynamic trajectories characterised by varying thermodynamic conditions (i.e. density and temperature). The trajectories include a non-pulsating outflow model represented by a β-velocity law, and a pulsation model that will be discussed in more detail. Moreover, we distinguish between two model stars; the first, which we denote ‘SRV’, represents semi-regular variable AGB stars, and the second, ‘MIRA’, represents Mira-type pulsating AGB stars. Apart from their pulsation properties (amplitude and period), which are generally shorter for SRVs than for MIRAs, other quantities also differ for these two types of AGB stars. They include temperature, density, and mass-loss rate. Following stellar evolution models, the differences in these quantities suggest that SRV and MIRA represent two successive evolutionary states of the same type of AGB star (Kerschbaum & Hron 1992).
For reasons of comparability and consistency, we chose a fixed C/O ratio of 0.75. We are aware that the C/O ratio is subject to changes during the evolution on the AGB. Recurrent third dredge-up (TDU) and mixing episodes gradually enhance the carbon content at the stellar surface, leading to an evolution-induced increase in the C/O ratio (Cristallo et al. 2015). Therefore, SRV-type stars are expected to have a (slightly) lower C/O ratio than Mira-type AGB stars. According to the FRUITY stellar evolution models, a star with an initial mass of 1.5 M⊙ and solar metallicity (Z = 0.014) experiences five TDU mixing episodes with an interpulse period (i.e. the time between two TDUs) lasting about 1–2 × 10⁵ yr (Cristallo et al. 2015). During the time span of an interpulse period, the C/O ratio is constant and takes values of 0.41 (TDU 1), 0.56 (TDU 2), 0.75 (TDU 3), 0.96 (TDU 4) and 1.00 (TDU 5). Therefore, our initial elemental composition corresponds to third of five TDU episodes of the FRUITY model described above. Moreover, our choice of C/O = 0.75 lies in between the solar value of 0.55 (Asplund et al. 2009) and a C/O ratio of 0.95 characteristic for an MS type AGB star, and hence reflects a certain progression in stellar evolution. We performed test calculations for the two cases with solar C/O ratios (0.55) and for a stellar model resembling an AGB star of MS type (C/O = 0.95). The lower C/O slightly shifts the chemistry towards higher abundances of O-bearing species, but qualitatively preserved the difference between SRV and MIRA models. In the stellar model resembling an MS star, no alumina clusters form and the aluminium chemistry is predominated by the halides AlF and AlCl instead of AlOH and AlO, as expected. Therefore, the main conclusions from our kinetic modelling study are not altered by these tests.
3.6 Non-pulsating outflow model
The non-pulsating outflow models in our study are represented by a β-velocity law. The β-velocity law represents a stellar outflow model, where the velocity increases monotonically with the distance from the star and accounts for the net acceleration of the wind. It should be kept in mind that the beta velocity approximation does not take into account stellar pulsations. Its general form is given by
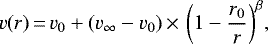 (12)
(12)
where v0 and v∞ are the initial and terminal velocities and r0 the initial radius, often referred to as dust condensation radius. Here, we assume that r0 = 1R⋆, v0 = v(r0) = 1.5 km s−1, and β = 1.0 for both model stars, SRV and MIRA. Typically, r0 is found to be often greater than 1 R⋆. However, we intentionally chose the stellar surface as the starting point, since we do not impose a dust condensation radius, but aim to derive the onset of dust formation by the kinetic cluster growth. Therefore, we naturally account for a dust formation ‘zone’ rather than a dust formation ‘radius’. Moreover, our choice of r0 allows a more direct comparison with the pulsating models, which is one of the main purposes of this study. We chose a value of β = 1.0 for both model stars, which is in accordance with Decin et al. (2010). We note that the value for β is often (slightly) larger for oxygen-rich AGB stars (see e.g. Khouri et al. 2014; Maercker et al. 2016). A larger value of β implies a slower wind acceleration and consequently, a longer timescale for the chemistry to occur and for the alumina clusters and the related dust to form. Therefore, β = 1 corresponds to the conservative limit of a comparatively quickly accelerating oxygen-rich AGB wind.
The terminal wind speed v∞ is dependent on the model star and has typical values of 5–20 km s−1. For the SRV model we assume v∞ = 5.7 km s−1 and for the MIRA model v∞ = 17.7 km s−1 based on the results of Maercker et al. (2016) for R Dor and of Decin et al. (2017) for IK Tau. The initial velocity v0 is consistent with a microturbulent velocity of 1.1–1.5 km s−1 derived from the line broadening close to the stellar photosphere (Schöier et al. 2004). The gas temperature T (see Fig. 18) is given as a function of radius and follows a power law with an exponent α = 0.6 (Willacy & Millar 1997):
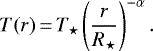 (13)
(13)
The radial density profile is derived from the scale height at the stellar surface, H⋆ = 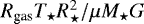 of an ideal gas with a parameter γ = 0.89 (see e.g. Gobrecht et al. 2016 and reference therein) and is given as
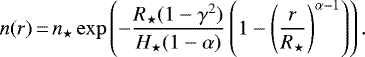 (14)
(14)
Since the kinetic rate network is formulated as a set of differential equations in time, we transformed the monotonically decreasing temperature and density into functions of time by using a constant d t = dr∕v(r).
In the SRV non-pulsating outflow model (i.e. the SRV β-velocity law), the aluminium chemistry is dominated by atomic Al for r < 1.8R⋆, by AlOH for 1.8 R⋆ < r < 2.7R⋆ and by alumina tetramers (Al8O12) for r < 2.7R⋆ (see Fig. 19). The exclusion of the photolysis reactions (shown in dashed lines) has a minor impact on the species abundances. Also, the choice of the initial abundance distribution (TE versus atomic) hardly affects the species abundances (top versus bottom panel). Alumina tetramer clusters start to form around 2 R⋆, thereby impacting the other aluminium-bearing species. At 2.2 R⋆ a significant amount of clusters have formed, which is accompanied by the decrease in the Al-containing molecules. AlO shows an abundance of a few times 10−9 before the cluster formation becomes dominant. This is about an order of magnitude lower than predicted by recent Atacama large millimeter/submillimeter array (ALMA) observations (Decin et al. 2017). AlOH shows a strong increase in its abundance and reaches a maximum around 2 R⋆ and decreases again, when the alumina tetramers form. In comparison to observations, AlOH is over-predicted in our SRV non-pulsating model, except for the innermost region inside 1.1 R⋆. AlCl reaches its peak fractional abundance in the cluster forming zone, where it agrees well with the observation for the semi-regularvariable R Doradus. In summary, the AlOH abundance is over-predicted and the AlO abundance is under-predicted, both by about an order of magnitude, as compared with observations. Moreover, closest agreement between theSRV non-pulsating model and observations is found before and at the cluster formation zone, but not afterwards.
The species abundances in the MIRA non-pulsating outflow model (i.e. β-velocity law) shown in Fig. 20 have some common features with the SRV models, but also show some important variety. First, the molecular chemistry occurs closer to the star, which can be exemplified by the AlOH abundance peaking at 1.5 R⋆ and exceeding the atomic Al abundance for radii beyond 1.2 R⋆. This is closer to the star than in the SRV models and can be attributed to the lower temperatures and the higher gas densities in the MIRA models. Between 1.4 and 1.7 R⋆ tetramer clusters form in significant amounts and dominate the Al content for r >2 R⋆, essentially independent of the photolysis. The cluster synthesis impacts the aluminium chemistry also in the MIRA non-pulsating outflow in decreasing their molecular abundances. The oxides AlO and Al2O, as well as atomic Al and AlH are much stronger depleted than the aluminium halides AlF and AlCl, which even slightly increase for r >2.5 R⋆. Obviously, AlO, Al2O, AlH, and atomic Al are molecular precursor to alumina clusters. AlO is only present in the innermost zones (r < 1.8 R⋆) and decreases to negligible amounts, once the cluster have formed. This is agreement with recent observations that show no AlO in the dust formation zone in Mira-type AGB stars, such as IK Tau (Decin et al. 2017; Danilovich et al. 2020) We note overall larger abundances of AlO, AlOH, Al2O and Al, when starting with a gas that is initially atomic (instead of assuming chemical equilibrium) for the MIRA non-pulsating models. In comparison with Decin et al. (2017), the AlOH abundance in the MIRA non-pulsating model is a bit high showing better agreement in the TE case (upper panel in Fig. 20).
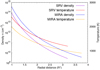 |
Fig. 18 Density and temperature profiles of the SRV and MIRA model star envelopes. These profiles apply to the non-pulsating models as well as to the pre-shock conditions of the pulsating models. |
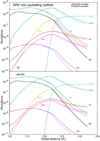 |
Fig. 19 Abundances of the prevalent aluminium-bearing species in the SRV β-velocity model. Straight lines show abundances that include photolysis reactions, dashed lines without them. |
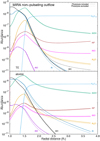 |
Fig. 20 Abundances of the prevalent aluminium-bearing species in the MIRA non-pulsating outflow model. Straight lines show abundances that include the photolysis, dashed lines without it. |
3.7 Pulsating model
In the pulsating model, we follow Lagrangian trajectories of an atmospheric gas parcel experiencing a pulsation-induced shock and asubsequent adiabatic expansion. The resulting trajectories correspond to ballistic and periodic excursions (Bertschinger & Chevalier 1985). This formalism has been widely used in combination with a chemical-kinetic network by Cherchneff et al. (1992), Willacy & Cherchneff (1998), Duari et al. (1999), Cherchneff (2006), and Gobrecht et al. (2016) and applied to different circumstellar environments. We apply the pulsating model for both model stars, SRV and MIRA, starting at the stellar photosphere (1 R⋆). In both model stars, gas density and temperatures decrease monotonically with time (see Fig. 21) during one pulsation cycle. After a complete pulsation cycle the gas densities have relaxed to their pre-shock values. Like in the non-pulsating β-velocity law, the SRV and MIRA model stars differ by their initial densities n0 and temperatures T0 (see Table 4). In addition to these quantities, shock velocities (defining the jumps in temperature and gas density) and pulsation periods differ for SRV and MIRA, and are required input quantities for the pulsating models. They are different for SRV and MIRA (see Table 4). The physical timescale is given by the pulsation period, which typically lasts of the order of hundreds of days. In the case of the SRV model it is 338 days, and in the MIRA model 470 days.
As a first step we follow the chemistry for one full pulsation cycle with a period P, starting at the immediate post-shock (phase Φ = t∕P = 0.0) and ending just before the next shock arrives (phase Φ = t∕P = 1.0). The abundances of the prevalent oxygen-bearing species CO, CO2, H2O, OH, SiO forboth models, SRV and MIRA, are displayed in Fig. 22.
We find good agreement with observations and the temperature dependence of the main species also reflects the equilibrium calculations presented in Sect. 3.4. Moreover, the inclusion of the three photolysis rates has only a minor effect (OH at late phase) on the prevalent species. In both models (SRV and MIRA), similar trends with pulsation phase (time) are found. CO2, H2O, and CO reform in the post-shock gas, whereas OH is destroyed. In both pulsation models, SRV and MIRA, molecular oxygen (O2) plays a minor role with abundances not exceeding 1 × 10⁻⁹. On the one hand this result shows that the applied chemical-kinetic network produces good agreement with measured abundances.On the other hand, it shows that these main species are overall less affected by kinetic processes. However, this is not the case for the aluminium-bearing species including the (molecular) precursors of alumina dust, as will be shown below.
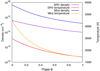 |
Fig. 21 Temperature and density profiles of the post-shock gas at 1 R⋆ in the two models, SRV and MIRA, as a function of pulsation phase Φ = t/P, where t is the time and P is the pulsation period. |
Parameters for the model stars SRV and MIRA used to calculate hydrodynamic trajectories.
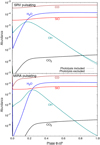 |
Fig. 22 Kinetic (non-equilibrium) abundances of the prevalent gas-phase molecules in the post-shock gas at 1 R⋆ of the pulsating models as a function of pulsation phase. Upper panel: SRV, lower panel: MIRA. |
3.7.1 SRV pulsating model
In the SRV pulsating model at 1 R⋆ (see Fig. 23), aluminium hydride (AlH) and atomic Al controls the aluminium content in the early post-shock gas (Φ < 0.6) and AlOH is the most abundant aluminium-bearing species at later phases Φ >0.6. A few dozen days later, at Φ > 0.75, alumina tetramers start forming and account for 71.8% of the aluminium content at Φ = 1.0 (AlOH accounts for 22.1%). We note that an alumina tetramer contains eight Al atoms, whereas the molecules AlO and AlOH bear just one Al atom. These stoichiometries need to be taken into account, when inspecting the species contributions to the total aluminium content. Before the clusters are forming, the AlO abundance at 1 R⋆ is of the order of few times 10−10, and decreases afterwards. This is still about two orders of magnitude lower than observed, but also still very close to the star. In contrast, AlOH shows large abundances at late phase (Φ > 0.7) exceeding the observational abundance by 2 orders of magnitude.
One of the main drawbacks of the applied pulsating model is that its trajectory is purely periodic, as it returns to its initial radial position after a complete pulsation period. Therefore, a consecutive (continuous) trajectory describing an outflow (i.e. mass loss) is not possible with the assumptions made of this pulsating model and a rescaling to larger radii is required. We are aware that pulsating models with a gradually outward directed flow exist (see e.g. Liljegren et al. 2018; Cristallo et al. 2021), but they presuppose (imply) a certain degree of condensation. This assumption in turn uses pre-existing solids, whose formation is the subject of our present study. Therefore, a self-consistent coupling of these complementary methods is desirable, but it is beyond the scope of our current investigation. Nevertheless, bearing the approximative nature of our approach in mind, we follow the evolution of the pulsating model in steps of 0.5 R⋆ up to a distance of3 R⋆ from the star (see Fig. 24). Most of the species abundances (Al2O, AlF, Al8O12) are shaped and largely determined at the first pulsation at 1 R⋆, where the gas densities are highest and the pulsation is strongest, and show little variation for larger radii. However, we find an increasing trend for AlO and a decreasing trend of AlH with distance from the star in the case. The reaction AlO+H2 plays an important role. In the consecutive pulsation model, the H2 amount decreases gradually with the distance of the star, as a consequence of the decreasing gas density. In addition, the decreasing gas temperatures reduce also the efficiency of AlO+H2 reaction with a barrier of 2092 K. In other words, with increasing distance from the star, less and less AlO is consumed by the AlO+H2 → AlOH+H reaction, owing to thelack of molecular H2, and leads to a moderate increase in AlO up to a fractional abundance of 2 × 10⁻⁹.
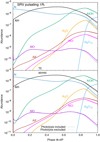 |
Fig. 23 Kinetic abundances of aluminium-bearing species in the post-shock gas at 1 R⋆ of the pulsating SRV model as a function of pulsation phase, Φ. Dashed lines show the abundances when the photodissociation is excluded.Upper panel: initial abundances given by chemical equilibrium (TE). Lower panel: initial abundances corresponding to a pure atomic gas composition. |
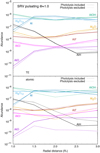 |
Fig. 24 Kinetic (non-equilibrium) abundances of the aluminium-bearing species in the post-shock gas of the SRV model after a complete pulsation cycle (phase Φ = 1.0) as a function of radial position. Dashed lines show the abundances when the AlOH photodissociation is excluded. Upper panel: initial abundances given by chemical equilibrium. Lower panel: initial abundances corresponding to a pure atomic gas composition. |
3.7.2 MIRA pulsating model
In Fig. 25, the abundances of the main aluminium-bearing species in the MIRA pulsating model at 1 R⋆ are shown. In comparison with the SRV pulsating model, the effect of the photolysis reactions is entirely negligible for the MIRA pulsation at 1 R⋆. The alumina tetramer clusters start to form in significant amounts at phase Φ = 0.7 and account for 93.8% of the total aluminium content at phase Φ = 1.0. The Al-containing molecules AlOH, Al2O, AlCl, and AlF show similar abundance profiles as in the SRV case and peak, when the clusters start to form. These peaks appear sharper and the increase in Al8O12 steeper than in the SRV pulsating models. On the other hand, the pulsation period in the MIRA model (470 days) is longer than in the SRV model (338 days). Moreover, we note practically no difference, when starting with an pure atomic gas or molecular TE abundances.
In Fig. 26, the MIRA model abundances of the consecutive pulsating model are shown. Clearly, the aluminium content is dominated by the alumina clusters and AlOH, independent of the inclusion of photolysis and of the initial gas mixture (TE or atomic). We note that the photolysis processes start to play a role for r > 1.0 R⋆, particularly in the case of an atomic initial gas. This can be explained, as the photolysis reactions decrease as r−2 and therefore decrease less rapidly than the total gas density showing an exponential decline with radial distance. At 3 R⋆ the AlO abundance is similar in both pulsating models, SRV and MIRA. However, for r < 2R⋆, we note that AlO is orders of magnitude less abundant in the MIRA model when compared to the SRV model, reflecting recent observations. The halides AlF and AlCl show comparable amounts in the SRV and MIRA models.
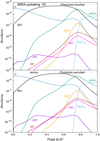 |
Fig. 25 Kinetic (non-equilibrium) abundances of the aluminium-bearing species in the post-shock gas of the MIRA model as a function of pulsation phase, Φ. Dashed lines show the abundances when the AlOH photodissociation is excluded. Upper panel: initial abundances given by chemical equilibrium. Lower panel: initial abundances corresponding to a pure atomic gas composition. |
3.8 Homogeneous nucleation to the bulk limit (corundum)
As indicated in the previous sections, the chemical-kinetic cluster growth is formulated up to the size of the alumina tetramer cluster, Al8O12. The subsequent nucleation is treated implicitly. The choice of the alumina tetramer as the size linking the chemical-kinetic regime with the thermodynamically described larger (Al2O3)n clusters appears arbitrary at first glance. However, by inspecting the reaction enthalpies, we find values of <–800 kJ mol−1 (corresponding to equivalent temperatures ~105 K) for the association of two Al2O3 monomers and for the association of two Al4O6 clusters. As pointed out in Sect. 3.2, the alumina monomer is comparatively unfavourable in terms of thermodynamics and kinetics. Therefore, the favourable association of two Al4O6 clusters with a negligible reverse dissociation rate represents an ideal transition from a chemical-kinetic controlled regime to a cluster treatment based on thermodynamics. In addition, the density of rovibrational states, which increases with the number of atoms contained in the cluster, is large enough for n > 4 to relax the necessity of a chemical-kinetic treatment. In the following, the cluster properties (energies, bond lengths, coordination, vibration modes) are analysed with increasing cluster size and compared with the bulk limit. In thecase of alumina, the bulk limit corresponds to its most stable crystalline solid form, which is α-alumina. The chemical-kinetic treatment beyond the tetramer is possible in principle and the choice of the tetramer as end point is somewhat arbitrary. However, in the chemically rich gas mixture of circumstellar envelopes, the dust nucleation is likely to proceed via several species (i.e. heterogeneously). Therefore, we present the results for the homogeneous alumina nucleation in the form of size-dependent (up to n = 10) cluster characteristics, their interpolation towards larger sizes (n > 10), and the comparison to the crystalline bulk limit (n → ∞).
Corundum, or α-alumina, is the thermodynamically most stable crystalline form (i.e. polymorph) of solid Al2O3 and corresponds to our reference bulk limit. Other alumina polymorphs (like θ, δ and γ) are metastable or ‘transitional’ and transform to corundum at temperatures higher than ~ T = 1000−1200 K (Levin & Brandon 1998). As alumina clusters grow in size, two phase transitions occur: from amorphous to the cubic γ-alumina form, and from γ–alumina to corundum (α-alumina). Calorimetry experiments indicate that alumina becomes crystalline at a size of ~ 40Å approximately (Tavakoli et al. 2013).
Many generic cluster properties (e.g. potential energies, melting temperatures), G(n), can be approximated by a series expansion in the form of
 (15)
(15)
where n is the cluster size, or the number of Al2O3 formula units, a0 = Gbulk is a characteristic constant for the corresponding bulk phase of the cluster, and a1 is proportional to the fraction of surface atoms divided by ‘volume’ atoms (Johnston 2002). In the case of energies, a1 is often ascribed to the surface tension. In the case of simple, closely packed clusters higher-order terms (second order and higher) can be neglected. Therefore, Eq. (15) is classically approximated to describe the energy of a cluster with a single and simple size dependence as
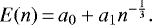 (16)
(16)
The electronic cluster energies (normalised to size n) are shown in Fig. 27. We note that the ‘cluster’ energy, calculated as
 (17)
(17)
with a subsequent scaling of the alumina monomer (Al2O3) energy to zero, is different from the electronic binding energy, calculated as
 (18)
(18)
also taking the bonds inside a stoichiometric Al2O3 unit into account.
As a consequence of an increasing number of bonds with size, cluster and binding energies decrease monotonically with size, n. By definition, these two energies differ only by a constant value and show the same relative tendencies. In Fig. 27 the cluster energies at T = 0 K are shown as a function of cluster size n. We find that the calculated cluster energies can be roughly approximated by a first-order fit (Eq. (16)), when excluding the monomer (n = 1) from the fitting procedure. A best-fit constant a1 of 1075.42 kJ mol−1 is found. Assuming a ‘monomeric radius’ in the range of rmon = 2.08–2.60 Å corresponding to the range given by geometric and van der Waals dimensions (see Table E.1), surface tensions for different temperatures can be derived. Since the classical concept of surface tensions is not applicable to clusters on the (sub-)nano scale, we just provide the fit parameters a0 = −1287.9 kJ mol−1 and a1 = 1075.42 kJ mol−1.
A closer inspection of the cluster energies reveals that some sizes (n = 3, 4, 5) are more favourable, and some sizes (n = 8, 10) are less favourable than predicted by the fit to Eq. (16). For a temperature of T = 0 K, the fit for the binding energies of the clusters (see Table 5) with Eq. (16), we find a best fit with a0 = − 2906.48 kJ mol−1 and a1 = 699.504 kJ mol−1. Moreover, we plot the nucleation energies of the clusters. The nucleation energy is defined as the difference in energy between the nucleating particles and the newly formed cluster. In the case of monomeric growth, the nucleation energy is
 (19)
(19)
and in the case of dimer addition nucleation reaction it becomes
 (20)
(20)
The nucleation energies compare systems of the same size (number of atoms) and a normalisation is thus not required. Therefore, the monomer nucleation energy can be regarded as a finite-difference derivative of the cluster energy curve. The monomeric nucleation energies show that the GM clusters with sizes n = 4, 8 and 10, represent energetic bottlenecks, though the nucleation is still exothermic. In contrast, the GM clusters with sizes n = 2, 3, 6, and 9 have comparatively large nucleation energies and are expected to form quickly. As the monomer (n = 1) is not an outstandingly stable and abundant compound as has been pointed out in Sect. 3.1, we also plot the energy for the nucleation by alumina dimers. The dimer nucleation scenario also indicates that the change in nucleation energy is largest for the formation of the tetramers (n = 4) marking theend point of our chemical-kinetic description. Generally, the nucleation is not constrained by the addition of monomers or dimers, but can proceed via polymers of any kind (see e.g. Boulangier et al. 2019). Moreover, as previously mentioned, a heterogeneous nucleation, involving more than one chemical dust species, seems more realistic.
In Fig. 28, we plot the Gibbs free energy of formation ΔGf(T) (scaled to the elemental heats of formation) as a function of the cluster size n for temperatures T = 0, 500, 1000, 1500 and 2000 K. For T = 0 K, we find the overall lowest Gibbs free energies, which are also fitted according to Eq. (16). The corresponding fit parameters are a0 = −1687.82 and a1 = 1075.38 kJ mol−1. On the one hand, this result is consistent with the fits to the cluster energies in Fig. 27, showing an almost identical slope (a1). On the other hand, the bulk parameter (a0) is reasonably close to the standard free energy of formation of 1643.7 kJ mol−1 as derived from electrochemical cell experiments (Ghosh & Kay 1977) and to the energy of formation of 1663.6 kJ mol−1 reported in the JANAF tables. For larger temperatures, the bulk offsets a0 becomes less negative, but also the slopes (a1) become less steep. Furthermore, we note the same cluster sizes with comparatively enhanced (n = 3, 4) and reduced (n = 8,10) favourability for temperatures >0 K.
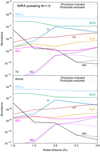 |
Fig. 26 Non-equilibrium abundances of the aluminium-bearing species in the post-shock gas of the MIRA model after a complete pulsation cycle (phase Φ = 1.0) as a function of radial position. Dashed-dotted lines show the abundances when the AlOH photodissociation is excluded. Upper panel: initial abundances given by chemical equilibrium (TE). Lower panel: initial abundances corresponding to a pure atomic gas composition. |
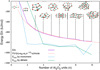 |
Fig. 27 Cluster energies (in kJ mol−1), normalised with respect to the Al2O3 monomer, which is set to 0 (purple straight lines), nucleation energies (in kJ mol−1) shown by monomer addition (in green) and by dimers (in blue), and fit with a0 = − 1287.9 kJ mol−1 and a1 = 1075.42 kJ mol−1 of the normalised binding energies (in red). |
Point group (symmetry), average coordination numbers ( and
and  ), the average bond distance
  in Å (ångström), and electronic binding energy (E0) per Al2O3 unit (n) of the GM clusters in kJ mol−1 for each cluster size (n).
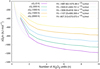 |
Fig. 28 Gibbs free energies, ΔGf(T), of the clusters (in kJ mol−1), normalised to the cluster size, n, as a functionof cluster size, n, shown for different temperatures. |
3.9 Geometric and electrostatic cluster properties
In this section, we discuss geometric (bond coordination and bond lengths) and electrostatic (atomic charges, dipole moments and vibration modes) properties of the GM clusters and compare them with each other and with corundum (i.e. the bulk limit). The average atomic coordination is plotted in the upper panel of Fig. 29 and increases monotonically with the cluster size n, except for n = 6 representing an outlier. For the dimer (n = 2) the coordination corresponds to the valence of the Al and O atoms. The atomic coordination inside the bulk (i.e. α-alumina) is 6 for Al and 4 for O. Hence, the atomic coordination of the clusters considered in this study are well below the bulk values. The averageAl–O bond distances of the GM clusters are shown in the lower panel of Fig. 29. They show a less-regular pattern than the Al coordination, but also indicate an overall increasing trend. For sizes n = 3–5 and for n = 8–10 the average AlO distances are almost identical and sizes n = 1 and n = 6 represent outliers. Generally, it is not surprising that the average atomic coordination and AlO bond length increase with size n, as it reflects the decreasing surface-to-volume ratio with size (see Table 5). If we apply a fit of the form of Eq. (16) to the average Al coordination number nAl, we find fitting parameters of a0 = 5.16747 and a1 = −2.73878. For the average Al–O bond distance, we find fitting parameters of a0 = 1.8557605Å and a1 = −0.11595Å.
Since the fit values of a0 for both, average coordination and bond length, are below the value of α-alumina (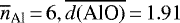 Å), the bulk limits are not reached by these fits. We conclude that these fits are not suitable to find the approximate size, where the bulk limit is reached. However, they can serve as predictions for alumina clusters with size n > 10, which are computationally demanding to explore.
In Table 5, we summarise our findings on the geometry of the GM clusters, including also the point group symmetries (given in the Schönflies notation) and the binding energy per Al2O3 unit, as a function of cluster size n.
In Table 6, we consider electrostatic properties of the GM clusters of by first examining the atomically partitioned Mulliken charges. In general, we find significantly lower average magnitudes of atomic charges for the PBE0-optimised structures than for the sameclusters optimised with B3LYP. In both cases, the Mulliken average charges generally tend to decrease with cluster size n, with a slight increase between n = 6 and n = 8. The more accurate CBS-QB3 calculations (for n = 1–3) exhibit larger atomic charges. In general, the tendency for the (Mulliken) charges to decrease with size n indicates a transition from more ionic clusters to a more covalent solid, which is not unexpected.
The dipole moments D of the GM clusters are crucial for astronomical observations, since only clusters with a D≠0 can be detected by rotational lines. Therefore, the dimer (n = 2) and the hexamer (n = 6) GM isomers with a D = 0 are not observable by pure rotational spectroscopy, even though they might be present. Apart for n = 9, the PBE0- and B3LYP-derived dipole moments agree with each other. For the symmetric nonamer GM cluster the B3LYP dipole moment is very large and does not agree with value for the PBE0 optimisation. By closer inspection, we find tiny differences between theB3LYP- and PBE0-optimised geometries, which could be the reason for the discrepancy of these two functionals.
Finally, we aim to address the radiative properties of the GM clusters by investigating their vibrations by using the rigid-rotor harmonic oscillator approximation and performing a harmonic vibrational analysis. Anharmonic contributions might play a role for large oscillation amplitudes and low-lying excited electronic states could contribute significantly, particularly at high temperatures. Recent investigations of the vibrational IR spectra of nano silicates revealed that anharmonic as well as thermal effects can have significant impact on the spectra (Zamirri et al. 2019; Guiu et al. 2021). However, an investigation of these anharmonic effects and temperature dependence are challenging and beyond the scope of this paper. In this study, we primarily aim to show the positions of the vibrational bands necessary to calculate partition functions, to exclude transition states, and to explore whether the observed spectral alumina features at 11 μm and 13 μm could arise from (small) alumina clusters.
In Fig. 30, the vibration modes of the (Al2O3)n, n = 1–10, GM clusters and their related intensities are shown as a function of wavelength. In order to transform the discrete vibration modes in a continuous spectrum and compare to an observed spectrum, line broadening in the form of a Lorentzian distribution with a half width γ = 0.033μm, corresponding to a typical ALMA setup resolution in sub-millimetre range, is applied. The contour (in black) comprises all unweighted (Al2O3)n, n = 1–10, GM clusters. In principle, metastable clusters could also contribute to the species abundance and spectra. However, like the anharmonic and temperature effects, they are not included in this study.
The 13 μm feature seen in many M-type AGB stars principally could arise from small Al2O3 clusters. However, our results indicate that the clusters under consideration here do not emit intensely in this wavelength region. The 13 μm feature possibly originates from bulk-like alumina and heterogeneously mixed solids. This result is consistent with Begemann et al. (1997), who ruled out amorphous (non-crystalline) alumina as source of the 13 μm feature. Moreover, the authors derived laboratory optical constants for compact and porous amorphous solid alumina, resulting in a very broad emission feature around 11–12 μm, peaking at 11.5–11.8 μm. In this wavelength range our calculated IR intensity is comparatively low, though it is still stronger than at 13 μm. van Heijnsbergen et al. (2003) showed in an experimental study that large-sized aluminium oxide clusters (with sizes n ≃15–40, but not necessarily with a Al:O stoichiometry of 2:3) exhibit two main vibration modes at 11.8 μm and at 15 μm. At 11.8 μm, our calculated IR spectra shows a local maximum (see Fig. 30), which predominantly arises from the dimers(n = 2). However, at 15 μm the overall IR intensity is rather low for the alumina clusters with n = 1–10. We also note that amorphous particles were considerably larger than our GM clusters. Owing to the approximate nature that does not take into account anharmonicities or temperature effects, we cannot rule out small (impure) alumina clusters as a source of both spectral features, at 11 and 13 μm.
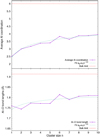 |
Fig. 29 Average Al coordination (top panel) and average AlO bond length in the GM clusters as a function of cluster size, n. The values for the bulk limit (α-alumina) are given in dashed red lines. |
Average Mulliken charges of the Al atoms ( ) in the GM clusters.
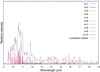 |
Fig. 30 Vibration modes of the (Al2O3)n, n = 1–10, GM clusters (colour-coded) as a function of the wavelength (in μm). The black contour corresponds to non-weighted (in size and metastable isomers) Lorentzian distribution. |
Overview of the SRV model abundances for thermodynamic equilibrium (TE), the non-pulsating model (β-velocity), and the pulsating model.
4 Discussion
In Tables 7 and 8, we summarise our results for the TE calculations, the non-pulsating and the pulsating models for the two types of AGB stars, SRV and MIRA. The abundances derived from recent observationsare listed in Table 9 for comparison. In the SRV models, atomic Al is found to be important for all cases. In comparison, the MIRA models show lower, but still considerable amounts of atomic Al. Strong and broad doublet resonance lines (around 395 nm) of the neutral Al atom, likely originating from the photosphere, are found in Mira-variable stars (Merrill et al. 1962; Kamiński et al. 2016). Reliable abundance estimates of atomic Al are however lacking. Therefore, we confirm the presence of atomic Al close to the photosphere of M-type AGB stars. AlO is by far the most studied aluminium-bearing molecule in oxygen-rich AGB stars. AlO is a diatomic molecule with known transitions and has a large dipole moment. It is thus not surprising that it has been found in a number of late-type stars, since its discovery in red supergiants (Tenenbaum & Ziurys 2009). In Table 9, we list recent detections of AlO and give abundances, where available. Kamiński et al. (2016) observed AlO in the archetypical star Mira instelf. The authors give a broad abundance range between 10−9 and 10−7, owing to large uncertainties in the measurement of the column density of AlO. Their semi-analytical model results in an AlO abundance of 5 × 10⁻¹⁰ in Mira. We find generally lower AlO abundances in our kinetic MIRA models, except for in the consecutive pulsating model for r > 2 R⋆ (see Table 8). De Beck et al. (2017) conducted a search for AlO in seven AGB stars, six of which are Mira-type (R Aqr, TX Cam, o Cet (Mira), R Cas, W Hya, IK Tau) and one of SRV type (R Dor). Definitively, they found AlO transitions in two stars (o cet and R Aqr) and tentatively, in three further stellar sources. The authors derive a source-averaged AlO fractional abundance of 4.5 × 10⁻⁸, based on a rotational diagram of IK Tau, also hinting at difficulties in deriving AlO abundances for individual stars. More recent ALMA observations (Decin et al. 2017; Danilovich et al. 2020) show the absence of AlO in the inner envelope of IK Tau, a Mira-type variable, but its presence in R Dor, a typical SRV-type star. In R Dor, they derive AlO fractional abundance of (3.7–7.8) × 10−8. These values compare well with the SRV consecutive pulsating model. Moreover, we note higher AlO fractions in the SRV-type stars than in the Mira-like AGB stars, which is consistently reproduced by our models for both types of trajectories, non-pulsating and pulsating models. AlOH represents the predominant Al-bearing molecule in both sets of models, SRV and MIRA. Its spectroscopic identification and a related abundance estimation by (radiative) transitions is challenging, owing to the following reasons. At present, there are no spectroscopic constants available in the literature for the AlOH electronic bands in the optical regime. Observations of rotational (and vibrational) transitions at longer wavelengths are feasible, but some rotational AlOH transitions are blended by rotational transitions of vibrationally excited TiO molecules and by rotational lines of a neutron-enriched isotopologue of SO2 (Decin et al. 2020). In addition, it is debated that circumstellar AlOH also exists in a bent configuration (Trabelsi & Francisco 2018), exhibiting different spectroscopic constants. At high temperatures, AlOH will be a quasi-linear molecule, because the difference in energy between the bent and linear forms is very small. Therefore, an accurate observational abundance estimate is demanding and it tends to underestimate the AlOH content. This might explain the systematically larger AlOH model abundances in comparison with observations. Overall, the AlOH/AlO ratio in our circumstellar models is larger than the observationally derived ratio indicating that the kinetic conversion of AlOH in AlO in our models is too inefficient. Neither the photodissociations nor the bimolecular reactions AlOH+H and AlOH+OH (that produce AlO) are able to noticeably transform the stable singlet AlOH molecule into the doublet AlO, although we used the most elaborate kinetic data available. Therefore, three possible resorts include: (i) the AlOH destroying (and AlO forming) reactions are described with too low (too large) rate expressions; (ii) efficient, but unnoticed, processes are missing from our present scheme; and (iii) the observationally derived AlO and AlOH abundances are artefacts of a rather simplistic treatment that assumes static peak abundances that follow a Gaussian distribution with an e-fold or dissociation radius.
To test the first hypothesis, we varied the AlOH photodissociation rate. Best agreement with the observations of AlO and AlOH for all models (non-pulsating and pulsating, SRV and MIRA) is found, when we increased the photolysis rate by a factor of 104. However, this artificial up-scaling of the photodissociation leads to a vanishing alumina cluster production in the SRV pulsation models. In the non-pulsating models, alumina clusters are still forming, but show a later onset of their synthesis.
The ground states of Al2O and AlO2 are not observable by their rotational transitions. Our calculations indicate that Al2O is likely to be an intermediate in the alumina cluster formation and shows noticeable abundances, whereas AlO2 is negligible in abundance and cluster formation. Therefore, there are no detections nor abundance estimates for these symmetric and linear molecules. For completeness, the aluminium-bearing halides AlF and AlCl are also listed in Tables 7, 8 and 9. These species become more important in S-type AGBstars and are not the main subject of this study examining oxygen-rich AGB stars. Nevertheless, the aluminium-bearing species AlF and AlCl might hamper the formation of aluminium oxide molecules and clusters by locking up aluminium. Decin et al. (2017) found that AlCl is about 3 times more abundant in oxygen-rich SRV-type stars. The β-velocity law at 3 R⋆ best fits these observations, but also the (single) pulsating models at 1 R⋆ reflect the magnitude and trends of these recent observations.
About 50 yr ago Henderson (1970) suggested that the combustion of aluminium particles proceeds via the clustering of AlO molecules, followed by an evaporation of aluminium, to finally form alumina. Since then, Al combustion including related clustering and burning times have been extensively studied in the laboratory (see e.g. Desai et al. 1997; Beckstead 2005 and references therein). More recent studies have used aluminised fuels and modelled the (Al2O3)n cluster formation by numerical simulations (Starik et al. 2015; Savel’ev & Starik 2018). These studies were predominantly performed under conditions that are radically different from circumstellar envelopes: in the combustion environment the pressure is at least five orders of magnitude higher, the bath gas is N2, and there are high levels of oxidants (O2 and CO2). Bearing in mind these intrinsic differences, a comparison of the data from aluminium combustion experiments with our study is not applicable. An adaptation of our model and tests against experimental data could be done in a future study. Moreover, we note that the majority of the clustering rates used in this study (in particular reaction involving species with more than four atoms) is based on collision and capture theory. These theoretically derived rates could differ from currently lacking laboratory measurements. However, we aimed to minimise this effect by using the most recent and accurate experimental rate date available.
The stoichiometric (Al2O3)n show a gradual monotonic trend with cluster size n in energy, atomic coordination, average bond length, and atomic charges. However, for all these quantities, we find outliers to these trends, and these outlier cannot be predicted by interpolations. Our derived fit parameter for the bulk limit (a0 = −1687.82 kJ mol−1) shows excellent agreement with the JANAF-NIST database and other experimental data (Ghosh & Kay 1977). Calorimetric experiments on the specific surface areas show that two size-dependent phase transition occur in alumina (McHale et al. 1997; Tavakoli et al. 2013). The smallest clusters reside in the amorphous regime characterised by sizes n < 800, or in terms of diameters, by d < 40Å. For sizes 800 < n < 1900 (or diameters of d = 40−116Å), alumina is predominantly in cubic γ–alumina crystals. Only larger-sized alumina particles (n > 1900, d > 116Å) are mainly present in the form of hexagonal corundum. Therefore, our cluster calculations up to a size of n = 10 and their interpolation to larger sizes clearly pertain to the size-regime of the non-crystalline (amorphous) phase, and cannot be represented by top-down derived (crystalline) energies and structures.
Overview of the MIRA model abundances for thermodynamic equilibrium (TE), the non-pulsating model (β-velocity), and the pulsating model.
Overview of recent observations of the species AlO, AlOH, and AlCl in the inner winds of oxygen-rich AGB stars of SRV and Mira types.
5 Conclusions
We have modelled the nucleation of alumina dust particles from a bottom-up perspective, starting with atomic and molecular precursors and using a chemical-kinetic approach applied to different circumstellar gas trajectories that represent two model stars, a semi-regular variable (SRV) and a regular variable (MIRA). In both sets of circumstellar models, SRV and MIRA, alumina cluster particles form efficiently, independent of their initial gas-phase compositions. The results of the non-pulsating monotonic outflow (β-velocity law) and the pulsating (ballistic trajectory) models show similar trends. The non-pulsating models predict a later onset of cluster formation at larger radii (2–2.5 R⋆) in the SRV envelope, as compared with the MIRA model star, where the clusters form already at 1.5 R⋆. The pulsating models show that alumina clusters form yet at 1 R⋆ in the late post-shock gas. In the SRV pulsating model, the amount of alumina clusters formed at 1 R⋆ is already substantial (~72% of the total aluminium content). However, in the MIRA pulsating envelope, the cluster synthesis is even more fruitful, showing that more than 90% of the total Al content is in condensable clusters after one pulsation period. These results reflect the evolutionary sequence along the AGB, showing an increase in the stellar mass-loss rate. Furthermore, the models consistently show larger AlO abundances in the SRV case, as compared with the MIRA case, reflecting the trends of the most recent ALMA observations. Still, the modelled AlOH abundances exceed those derived from observations by about two orders of magnitude. A possible process that destroys the stable singlet AlOH molecule is the photolysis of AlOH. However, in AGB stars with rather low temperatures (< 2500 K), the AlOH photolysis is of secondary importance. Therefore, it is predominantly the bimolecular reaction AlO+H2 ↔ AlOH+H that determines the AlO/AlOH ratio. The effectiveness of this process depends on the concentration of molecular hydrogen, which is generally larger in the denser MIRA models. Therefore, the AlO/AlOH ratio is primarily controlled by the H/H2 in circumstellar envelopes.
Larger-sized (Al2O3)n clusters (n = 4−10) and their interpolation to the bulk limit (n →∞) are described by size-dependent properties, as a chemical-kinetic treatment becomes increasingly expensive and prohibitive. We find that the cluster energy can be approximated by a fit of the form E(n) = −1687.82 + 1075.38n−1∕3 kJ mol−1. The offset of–1687.82 kJ mol−1 is reasonably close to experimental values for bulk alumina (corundum). Nevertheless, it is very likely that the nucleation in oxygen-rich AGB stars proceeds heterogeneously, involving additional species that are different from pure aluminium-oxygen clusters. Moreover, we note that the small size regime under consideration here is still deeply in the non-crystalline (amorphous) size regime and that phase transitions could affect our bottom-up nucleation fit.
Acknowledgements
We acknowledge the referee H.-P. Gail for his valuable comments that helped improving the quality of this manuscript. D.G., J.M.C.P., and L.D. acknowledge support from the ERC consolidator grant 646 758 “AEROSOL” and STFC grant ST/T000287/1. S.T.B. acknowledges Spanish MICIUN/FEDER RTI2018-095460-B-I00 and María de Maeztu MDM-2017-0767 grants and a Generalitat de Catalunya 2017SGR13 grant. We acknowledge the CINECA award under the ISCRA initiative, for the availability of high performance computing resources and support for the projects IsC65 “SPINEL” and IsC76 “DUSTY”. We acknowledge the “Accordo Quadro” INAF-CINECA MoU 2017–2020 for the projects INA17-C5A28 and INA20-C7B35.
Appendix A Equilibrium constant and detailed balance
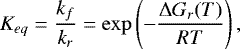
where Keq is the dimensionless equilibrium constant and kf and kr are the forward and the reverse reaction rates, respectively.
Appendix B Chemical-kinetic network
Kinetic rate network listing (1) the reaction number, (2) the reaction, (3) the CBS-QB3 heat of reaction (enthalpy) at T= 0 K, (4) the critical temperature (Tc), where the free energy of reaction, ΔGr(T), changes its sign, (5) the reaction rate with the pre-exponential factor A given as a(−b) ≡ a × 10−b for unimolecular reactions (photodissociations in units of s−1, for bimolecular reactions in units of cm3s−1, for termolecular reactions in units of cm6s−1), and (6) the reference or method of calculation.
Cartesian coordinates x, y, z of (Al2O3)n, n =1−10, GM clusters(in units of Å). The full table is available at the CDS.
Appendix C Thermo-chemical tables
Thermochemical tables of (Al2O3)n, n =1−10, GM clusters as afunction of temperature. The full table is available at the CDS.
Appendix D Thermochemistry: Fit parameters
Fitting parameters a, b, c, d, e for the computation of ΔG (T) used in equilibrium calculations.
Appendix E Cluster geometries
Cluster volumes (in Å3) and radii (inÅ) as derived from atomic core coordinates (Delauney triangulation) and from van der Waals interactions. The radii are calculated assuming spherical volumes.
Appendix F Cluster coordinates
Cluster coordinates (in units of Å) of the (Al2O3)n, n = 1 − 10, global minimum candidates. The full table is available at the CDS.
References
- Appleton, J. P., Steinberg, M., & Liquornik, D. J. 1970, J. Chem. Phys., 52, 2205 [NASA ADS] [CrossRef] [Google Scholar]
- Armstrong, A., Reber, A. C., & Khanna, S. N. 2019, J. Phys. Chem. A, 123, 5114 [NASA ADS] [CrossRef] [Google Scholar]
- Arslan, H., & Güven, M. H. 2005, New. J. Phys., 7, 60 [NASA ADS] [CrossRef] [Google Scholar]
- Asplund, M., Grevesse, N., Sauval, A. J., & Scott, P. 2009, ARA&A, 47, 481 [NASA ADS] [CrossRef] [Google Scholar]
- Bai, X., & Steimle, T. C. 2020, ApJ, 889, 147 [NASA ADS] [CrossRef] [Google Scholar]
- Bauernschmitt, R., & Ahlrichs, R. 1996, Chem. Phys. Lett., 256, 454 [CrossRef] [Google Scholar]
- Becke, A. D. 1993, J. Chem. Phys., 98, 1372 [Google Scholar]
- Beckstead, M. W. 2005, Combustion, Explosion Shock Waves, 41, 533 [Google Scholar]
- Begemann, B., Dorschner, J., Henning, T., et al. 1997, ApJ, 476, 199 [NASA ADS] [CrossRef] [Google Scholar]
- Bertschinger, E., & Chevalier, R. A. 1985, ApJ, 299, 167 [NASA ADS] [CrossRef] [Google Scholar]
- Boulangier, J., Gobrecht, D., Decin, L., de Koter, A., & Yates, J. 2019, MNRAS, 2040 [Google Scholar]
- Bromley, S. T., & Flikkema, E. 2005, Phys. Rev. Lett., 95, 185505 [NASA ADS] [CrossRef] [Google Scholar]
- Bromley, S. T., & Zwijnenburg, M. A. 2016, Computational Modeling of Inorganic Nanomaterials, Series in Materials Science and Engineering (CRC Press) [Google Scholar]
- Bromley, S. T., Gomez Martin, J. C., & Plane, J. M. C. 2016, Phys. Chem. Chem. Phys., 18, 26913 [NASA ADS] [CrossRef] [Google Scholar]
- Bush, T. S., Gale, J. D., Catlow, C. R. A., & Battle, P. D. 1994, J. Mater. Chem., 4, 831 [Google Scholar]
- Cernicharo, J., & Guelin, M. 1987, A&A, 183, L10 [Google Scholar]
- Cherchneff, I. 2006, A&A, 456, 1001 [NASA ADS] [CrossRef] [EDP Sciences] [Google Scholar]
- Cherchneff, I., Barker, J. R., & Tielens, A. G. G. M. 1992, ApJ, 401, 269 [Google Scholar]
- Cobos, C. 2002, J. Mol. Struct.: Theochem, 581, 17 [Google Scholar]
- Cristallo, S., Straniero, O., Piersanti, L., & Gobrecht, D. 2015, ApJS, 219, 40 [Google Scholar]
- Cristallo, S., Piersanti, L., Gobrecht, D., Crivellari, L., & Nanni, A. 2021, Universe, 7, 80 [NASA ADS] [CrossRef] [Google Scholar]
- Dalgarno, A., Du, M. L., & You, J. H. 1990, ApJ, 349, 675 [NASA ADS] [CrossRef] [Google Scholar]
- Danilovich, T., Gottlieb, C. A., Decin, L., et al. 2020, ApJ, 904, 110 [NASA ADS] [CrossRef] [Google Scholar]
- Das, U., & Raghavachari, K. 2008, J. Chem. Theory Comput., 4, 2011, 26620474 [Google Scholar]
- De Beck, E., Decin, L., Ramstedt, S., et al. 2017, A&A, 598, A53 [NASA ADS] [CrossRef] [EDP Sciences] [Google Scholar]
- Decin, L., De Beck, E., Brünken, S., et al. 2010, A&A, 516, A69 [NASA ADS] [CrossRef] [EDP Sciences] [Google Scholar]
- Decin, L., Richards, A. M. S., Waters, L. B. F. M., et al. 2017, A&A, 608, A55 [NASA ADS] [CrossRef] [EDP Sciences] [Google Scholar]
- Decin, L., Montargès, M., Richards, A. M. S., et al. 2020, Science, 369, 1497 [Google Scholar]
- Dell’Agli, F., García-Hernández, D. A., Rossi, C., et al. 2014, MNRAS, 441, 1115 [Google Scholar]
- Demyk, K., van Heijnsbergen, D., von Helden, G., & Meijer, G. 2004, A&A, 420, 547 [NASA ADS] [CrossRef] [EDP Sciences] [Google Scholar]
- Desai, S. R., Wu, H., Rohlfing, C. M., & Wang, L.-S. 1997, J. Chem. Phys., 106, 1309 [NASA ADS] [CrossRef] [Google Scholar]
- Donn, B., & Nuth, J. A. 1985, ApJ, 288, 187 [NASA ADS] [CrossRef] [Google Scholar]
- Duari, D., Cherchneff, I., & Willacy, K. 1999, A&A, 341, L47 [NASA ADS] [Google Scholar]
- Escatllar, A. M., Lazaukas, T., Woodley, S. M., & Bromley, S. T. 2020, ACS Earth Space Chem., 3, 2390 [Google Scholar]
- Fabian, D., Posch, T., Mutschke, H., Kerschbaum, F., & Dorschner, J. 2001, A&A, 373, 1125 [NASA ADS] [CrossRef] [EDP Sciences] [Google Scholar]
- Frisch, M. J., Trucks, G. W., Schlegel, H. B., et al. 2010, Gaussian 09 Revision A.1 (Wallingford, CT: Gaussian Inc.), 2009 [Google Scholar]
- Gale, J. D. 1997, J. Chem. Soc., Faraday Trans., 93, 629 [CrossRef] [Google Scholar]
- Gail, H.-P., & Sedlmayr, E. 2013, Physics and Chemistry of Circumstellar Dust Shells (Cambridge University Press) [CrossRef] [Google Scholar]
- Gail, H. P., Keller, R., & Sedlmayr, E. 1984, A&A, 133, 320 [Google Scholar]
- Gail, H.-P., Wetzel, S., Pucci, A., & Tamanai, A. 2013, A&A, 555, A119 [NASA ADS] [CrossRef] [EDP Sciences] [Google Scholar]
- Georgievskii, Y., & Klippenstein, S. J. 2005, J. Che. Phys., 122, 194103 [NASA ADS] [CrossRef] [Google Scholar]
- Ghosh, D., & Kay, D. A. R. 1977, J. Electrochem. Soc., 124, 1836 [NASA ADS] [CrossRef] [Google Scholar]
- Gilbert, R., & Smith, S. 1990, in Theory of Unimolecular and Recombination Reactions [Google Scholar]
- Glowacki, D. R., Liang, C.-H., Morley, C., Pilling, M. J., & Robertson, S. H. 2012, J. Phys. Chem. A, 116, 9545 [NASA ADS] [CrossRef] [Google Scholar]
- Gobrecht, D., Cherchneff, I., Sarangi, A., Plane, J. M. C., & Bromley, S. T. 2016, A&A, 585, A6 [NASA ADS] [CrossRef] [EDP Sciences] [Google Scholar]
- Gobrecht, D., Cristallo, S., Piersanti, L., & Bromley, S. T. 2017, ApJ, 840, 117 [NASA ADS] [CrossRef] [Google Scholar]
- Gobrecht, D., Decin, L., Cristallo, S., & Bromley, S. T. 2018, Chem. Phys. Lett., 711, 138 [NASA ADS] [CrossRef] [Google Scholar]
- Gómez Martín, J. C., Daly, S. M., Brooke, J. S., & Plane, J. M. 2017, Chem. Phys. Lett., 675, 56 [CrossRef] [Google Scholar]
- Goumans, T. P. M., & Bromley, S. T. 2012, MNRAS, 420, 3344 [NASA ADS] [Google Scholar]
- Gowtham, S., Lau, K. C., Deshpande, M., et al. 2004, J. Phys. Chem. A, 108, 5081 [NASA ADS] [CrossRef] [Google Scholar]
- Guiu, J. M., Escatllar, A. M., & Bromley, S. T. 2021, ACS Earth Space Chem., 5, 812 [NASA ADS] [CrossRef] [Google Scholar]
- Gustafsson, B., Edvardsson, B., Eriksson, K., et al. 2008, A&A, 486, 951 [NASA ADS] [CrossRef] [EDP Sciences] [Google Scholar]
- Hackwell, J. A., Gerhz, R. D., & Woolf, N. J. 1970, Nature, 227, 822 [NASA ADS] [CrossRef] [Google Scholar]
- Henderson, C. B. 1970, Combust. Sci. Technol., 1, 275 [NASA ADS] [CrossRef] [Google Scholar]
- Henning, T., ed. 2010, Astromineralogy (Berlin Springer Verlag), Lect. Notes Phys., 815 [Google Scholar]
- Höfner, S., & Olofsson, H. 2018, A&ARv, 26, 1 [Google Scholar]
- Huber, K. P., & Herzberg, G. 1979, Constants of Diatomic Molecules (Boston, MA: Springer US), 8 [Google Scholar]
- Ishizuka, S., Kimura, Y., Sakon, I., et al. 2018, Nat. Commun., 9, 3820 [NASA ADS] [CrossRef] [Google Scholar]
- Johnston, R. L. 2002, Atomic and Molecular Clusters (CRC Press) [Google Scholar]
- Justtanont, K., Feuchtgruber, H., de Jong, T., et al. 1998, A&A, 330, L17 [NASA ADS] [Google Scholar]
- Kamiński, T., Wong, K. T., Schmidt, M. R., et al. 2016, A&A, 592, A42 [NASA ADS] [CrossRef] [EDP Sciences] [Google Scholar]
- Karovicova, I., Wittkowski, M., Ohnaka, K., et al. 2013, A&A, 560, A75 [NASA ADS] [CrossRef] [EDP Sciences] [Google Scholar]
- Kerschbaum, F., & Hron, J. 1992, A&A, 263, 97 [NASA ADS] [Google Scholar]
- Khouri, T., de Koter, A., Decin, L., et al. 2014, A&A, 561, A5 [NASA ADS] [CrossRef] [EDP Sciences] [Google Scholar]
- Lagadec, E., & Zijlstra, A. A. 2008, MNRAS Lett., 390, L59 [NASA ADS] [CrossRef] [Google Scholar]
- Lam, J., Amans, D., Dujardin, C., Ledoux, G., & Allouche, A.-R. 2015, J. Phys. Chem. A, 119, 8944 [NASA ADS] [CrossRef] [Google Scholar]
- Lamiel-Garcia, O., Cuko, A., Calatayud, M., Illas, F., & Bromley, S. T. 2017, Nanoscale, 9, 1049 [Google Scholar]
- Launila, O., & Berg, L.-E. 2011, J. Mol. Spectr., 265, 10 [NASA ADS] [CrossRef] [Google Scholar]
- Laurens, G., Amans, D., Lam, J., & Allouche, A.-R. 2020, Phys. Rev. B, 101, 045427 [NASA ADS] [CrossRef] [Google Scholar]
- Levin, I., & Brandon, D. 1998, J. Am. Ceram. Soc., 81, 1995 [Google Scholar]
- Li, R., & Cheng, L. 2012, Comput. Theor. Chem., 996, 125 [Google Scholar]
- Liljegren, S., Höfner, S., Freytag, B., & Bladh, S. 2018, A&A, 619, A47 [NASA ADS] [CrossRef] [EDP Sciences] [Google Scholar]
- Little-Marenin, I. R., & Little, S. J. 1990, AJ, 99, 1173 [NASA ADS] [CrossRef] [Google Scholar]
- Luo, Y.-R. 2007, Comprehensive Handbook of Chemical Bond Energies (CRC Press) [CrossRef] [Google Scholar]
- Maercker, M., Danilovich, T., Olofsson, H., et al. 2016, A&A, 591, A44 [NASA ADS] [CrossRef] [EDP Sciences] [Google Scholar]
- Mangan, T. P., Harman-Thomas, J. M., Lade, R. E., Douglas, K. M., & Plane, J. M. C. 2020, ACS Earth Space Chem., 4, 2007 [NASA ADS] [CrossRef] [Google Scholar]
- Mangan, T., Douglas, K., Lade, R. E., et al. 2021, ACS Earth and Space Chemistry, 5, 3385 [NASA ADS] [CrossRef] [Google Scholar]
- Martinez, A., Tenorio, F. J., & Ortiz, J. V. 2001, J. Phys. Chem. A, 105, 11291 [NASA ADS] [CrossRef] [Google Scholar]
- McDonald, I., & Zijlstra, A. A. 2016, ApJ, 823, L38 [NASA ADS] [CrossRef] [Google Scholar]
- McHale, J. M., Auroux, A., Perrotta, A. J., & Navrotsky, A. 1997, Science, 277, 788 [CrossRef] [Google Scholar]
- Merrill, P. W., Deutsch, A. J., & Keenan, P. C. 1962, ApJ, 136, 21 [NASA ADS] [CrossRef] [Google Scholar]
- Montgomery, J. A., Frisch, M. J., Ochterski, J. W., & Petersson, G. A. 2000, J. Chem. Phys., 112, 6532 [NASA ADS] [CrossRef] [Google Scholar]
- Ohnaka, K., Weigelt, G., & Hofmann, K.-H. 2017, A&A, 597, A20 [NASA ADS] [CrossRef] [EDP Sciences] [Google Scholar]
- Parnis, J. M., Mitchell, S. A., Kanigan, T. S., & Hackett, P. A. 1989, J. Phys. Chem. (USA), 93, 24 [Google Scholar]
- Patzer, A. B. C., Chang, C., Sedlmayr, E., & Sülzle, D. 2005, Eur. Phys. J. D, 32, 329 [NASA ADS] [CrossRef] [Google Scholar]
- Perdew, J. P., Ernzerhof, M., & Burke, K. 1996, J. Chem. Phys., 105, 9982 [NASA ADS] [CrossRef] [Google Scholar]
- Plane, J. M. C., Daly, S. M., Feng, W., Gerding, M., & Gómez Martín, J. C. 2021, J. Geophys. Res.: Space Phys., 126, e2020JA028792 [Google Scholar]
- Posch, T., Kerschbaum, F., Mutschke, H., et al. 1999, A&A, 352, 609 [NASA ADS] [Google Scholar]
- Rahane, A. B., Deshpande, M. D., & Kumar, V. 2011, J. Phys. Chem. C, 115, 18111 [Google Scholar]
- Rogowski, D. F., Marshall, P., & Fontijn, A. 1989, J. Phys. Chem., 93, 1118 [CrossRef] [Google Scholar]
- Saba, M., Kato, T., & Oguchi, T. 2021, Combust. Flame, 225, 535 [Google Scholar]
- Sargent, B. 2019, in Amer. Astron. Soc. Meet. Abstr., 233, 411.04 [Google Scholar]
- Savel’ev, A. M., & Starik, A. M. 2018, Combust. Flame, 196, 223 [CrossRef] [Google Scholar]
- Schlegel, H. B., Iyengar, S. S., Li, X., et al. 2002, J. Chem. Phys., 117, 8694 [CrossRef] [Google Scholar]
- Schöier, F. L., Olofsson, H., Wong, T., Lindqvist, M., & Kerschbaum, F. 2004, A&A, 422, 651 [NASA ADS] [CrossRef] [EDP Sciences] [Google Scholar]
- Sharipov, A., Titova, N., & Starik, A. 2011, J. Phys. Chem. A, 115, 4476 [NASA ADS] [CrossRef] [Google Scholar]
- Sierka, M., Döbler, J., Sauer, J., et al. 2007, Angew. Chem. Int. Ed., 46, 3372 [Google Scholar]
- Sloan, G. C., Levan, P. D., & Little-Marenin, I. R. 1996, ApJ, 463, 310 [NASA ADS] [CrossRef] [Google Scholar]
- Sloan, G. C., Kraemer, K. E., Goebel, J. H., & Price, S. D. 2003, ApJ, 594, 483 [Google Scholar]
- Starik, A. M., Savel’ev, A. M., & Titova, N. S. 2015, Combust. Explosion. Shock Waves, 51, 197 [Google Scholar]
- Stillinger, F. H., & Weber, T. A. 1983, Phys. Rev. A, 28, 2408 [NASA ADS] [CrossRef] [Google Scholar]
- Stock, J. W., Kitzmann, D., Patzer, A. B. C., & Sedlmayr, E. 2018, MNRAS, 479, 865 [NASA ADS] [Google Scholar]
- Swihart, M. T., Catoire, L., Legrand, B., Gökalp, I., & Paillard, C. 2003, Combust. Flame, 132, 91 [Google Scholar]
- Tavakoli, A. H., Maram, P. S., Widgeon, S. J., et al. 2013, J. Phys. Chem. C, 117, 17123 [Google Scholar]
- Takigawa, A., Kamizuka, T., Tachibana, S., & Yamamura, I. 2017, Sci. Adv., 3 [Google Scholar]
- Tenenbaum, E. D., & Ziurys, L. M. 2009, ApJ, 694, L59 [NASA ADS] [CrossRef] [Google Scholar]
- Tenenbaum, E. D., & Ziurys, L. M. 2010, ApJ, 712, L93 [NASA ADS] [CrossRef] [Google Scholar]
- Tielens, A. G. G. M. 2005, The Physics and Chemistry of the Interstellar Medium (Cambridge University Press) [Google Scholar]
- Trabelsi, T., & Francisco, J. S. 2018, ApJ, 863, 139 [NASA ADS] [CrossRef] [Google Scholar]
- van Heijnsbergen, D., Demyk, K., Duncan, M. A., Meijer, G., & von Helden, G. 2003, Phys. Chem. Chem. Phys., 5, 2515 [CrossRef] [Google Scholar]
- Wales, D., & Doye, J. 1998, [arXiv:cond-mat/9803344] [Google Scholar]
- Wetzel, S., Pucci, A., & Gail, H.-P. 2012, J. Chem. Eng. Data, 57, 1594 [CrossRef] [Google Scholar]
- Willacy, K., & Cherchneff, I. 1998, A&A, 330, 676 [NASA ADS] [Google Scholar]
- Willacy, K., & Millar, T. J. 1997, A&A, 324, 237 [NASA ADS] [Google Scholar]
- Willacy, K., Klahr, H. H., Millar, T. J., & Henning, T. 1998, A&A, 338, 995 [NASA ADS] [Google Scholar]
- Woitke, P. 2006, A&A, 460, L9 [NASA ADS] [CrossRef] [EDP Sciences] [Google Scholar]
- Woitke, P., Helling, C., Hunter, G. H., et al. 2018, A&A, 614, A1 [NASA ADS] [CrossRef] [EDP Sciences] [Google Scholar]
- Woodley, S. M., Battle, P. D., Gale, J. D., & Catlow, R. A. 1999, Phys. Chem. Chem. Phys., 1, 2535 [NASA ADS] [CrossRef] [Google Scholar]
- Zamirri, L., Macià Escatllar, A., Mariñoso Guiu, J., Ugliengo, P., & Bromley, S. T. 2019, ACS Earth Space Chem., 3, 2323 [NASA ADS] [CrossRef] [Google Scholar]
- Zhong, M.-M., Kuang, X.-Y., Wang, H.-Q., Li, H.-F., & Zhao, Y.-R. 2011, Mol. Phys., 109, 603 [NASA ADS] [CrossRef] [Google Scholar]
- Ziurys, L. M., Apponi, A. J., & Phillips, T. G. 1994, ApJ, 433, 729 [NASA ADS] [CrossRef] [Google Scholar]
All Tables
Parameter ranges used in this study to compute the interionic Buckingham pair potential.
Enthalpies of formation, , at T = 0 K in kJ mol−1 of Al-bearingmolecules for different density functional and basis set combinations used in this study, compared with the JANAF thermochemical database.
GM candidate structures of AlxOy, x = 1–5 y = 1–6 clusters, including binding energies per atom (in kJ mol−1).
Parameters for the model stars SRV and MIRA used to calculate hydrodynamic trajectories.
Point group (symmetry), average coordination numbers ( and ), the average bond distance in Å (ångström), and electronic binding energy (E0) per Al2O3 unit (n) of the GM clusters in kJ mol−1 for each cluster size (n).
Overview of the SRV model abundances for thermodynamic equilibrium (TE), the non-pulsating model (β-velocity), and the pulsating model.
Overview of the MIRA model abundances for thermodynamic equilibrium (TE), the non-pulsating model (β-velocity), and the pulsating model.
Overview of recent observations of the species AlO, AlOH, and AlCl in the inner winds of oxygen-rich AGB stars of SRV and Mira types.
Kinetic rate network listing (1) the reaction number, (2) the reaction, (3) the CBS-QB3 heat of reaction (enthalpy) at T= 0 K, (4) the critical temperature (Tc), where the free energy of reaction, ΔGr(T), changes its sign, (5) the reaction rate with the pre-exponential factor A given as a(−b) ≡ a × 10−b for unimolecular reactions (photodissociations in units of s−1, for bimolecular reactions in units of cm3s−1, for termolecular reactions in units of cm6s−1), and (6) the reference or method of calculation.
Cartesian coordinates x, y, z of (Al2O3)n, n =1−10, GM clusters(in units of Å). The full table is available at the CDS.
Thermochemical tables of (Al2O3)n, n =1−10, GM clusters as afunction of temperature. The full table is available at the CDS.
Fitting parameters a, b, c, d, e for the computation of ΔG(T) used in equilibrium calculations.
Cluster volumes (in Å3) and radii (inÅ) as derived from atomic core coordinates (Delauney triangulation) and from van der Waals interactions. The radii are calculated assuming spherical volumes.
Cluster coordinates (in units of Å) of the (Al2O3)n, n = 1 − 10, global minimum candidates. The full table is available at the CDS.
All Figures
|
Fig. 1 Structures of the molecules AlO, AlOH, and OAlOH. Al atoms are displayed in turquoise, O atoms in red, and H atoms in white. |
| In the text | |
|
Fig. 2 Left: GM structure of the alumina monomer Al2O3 (1A). Right:second lowest-energy isomer of the alumina monomer (1B). |
| In the text | |
|
Fig. 3 GM structure of the alumina dimer (Al2O3)2 (2A). |
| In the text | |
|
Fig. 4 GM candidate structure of the alumina trimer (Al2O3)3. Left: 3A. Right: 3B. |
| In the text | |
|
Fig. 5 GM candidates of the alumina tetramer (Al2O3)4. Left: 4A. Right: 4B. |
| In the text | |
|
Fig. 6 GM candidates of the alumina pentamer (Al2O3)5. Left: 5A. Right: 5B. |
| In the text | |
|
Fig. 7 GM candidates of the alumina hexamer (Al2O3)6. Left: 6A. Right: 6B. |
| In the text | |
|
Fig. 8 GM candidate (7A) of the alumina heptamer (Al2O3)7. |
| In the text | |
|
Fig. 9 Relative energies of the lowest-energy alumina heptamer isomers (Al2O3)7. Structures reported by Li & Cheng (2012) are indicated in violet as LC2012 and the GM candidate reported by Rahane et al. (2011) in green as RDK2010. |
| In the text | |
|
Fig. 10 GM candidate structures of the alumina octamer (Al2O3)8. |
| In the text | |
|
Fig. 11 GM candidate (9A) of the alumina nonamer (Al2O3)9. |
| In the text | |
|
Fig. 12 Low-energy isomers of the alumina nonamer (Al2O3)9. |
| In the text | |
|
Fig. 13 GM candidate (10A) of the alumina decamer (Al2O3)10. |
| In the text | |
|
Fig. 14 Low-energy isomers (top: 10B, 10C, 10D; bottom: 10E, 10F, 10G) of the alumina decamer ((Al2O3)10). |
| In the text | |
|
Fig. 15 Reaction scheme: Formation routes towards the alumina monomer (Al2O3). Reaction enthalpies are given in kJ mol−1 and colour-coded according to their values. Red corresponds to suppressed exothermic reactions (ΔH > 0 kJ mol−1), yellow to slightly exothermic reactions (ΔH > −30 kJ mol−1), and green to very exothermic reactions (ΔH < −30 kJ mol−1). |
| In the text | |
|
Fig. 16 Reaction scheme: formation routes towards the alumina dimer. Reaction enthalpies are given in kJ mol−1, and the colour-coding is the same as in Fig. 15, where very exothermic reactions are colour-coded in green, slightly exothermic reactions in orange, and endothermic reactions in red. |
| In the text | |
|
Fig. 17 Upper panel: TE abundances of the abundant molecules CO, CO2, H2O (black), OH, and O2 as a function of temperature for different C/O ratios. Middle panel: TE abundances of the aluminium-bearing molecules AlO, AlOH, Al2O, and AlO2 as well as Al and Al+, as a function of temperature for different C/O ratios. Lower panel: TE abundances of the aluminium-bearing clusters OAlOH, Al(OH)2, Al3O3, Al4O4, Al4O5, Al4O6, and AlSiO3, which participate in the formation of the alumina dimer (Al4O6), as a function of temperature for different C/O ratios. Straight lines correspond to C/O = 0.4, dashed lines to C/O = 0.7, and dashed-dotted line to C/O = 1.0, respectively. The pressure is kept constant at 10−5 bar. |
| In the text | |
|
Fig. 18 Density and temperature profiles of the SRV and MIRA model star envelopes. These profiles apply to the non-pulsating models as well as to the pre-shock conditions of the pulsating models. |
| In the text | |
|
Fig. 19 Abundances of the prevalent aluminium-bearing species in the SRV β-velocity model. Straight lines show abundances that include photolysis reactions, dashed lines without them. |
| In the text | |
|
Fig. 20 Abundances of the prevalent aluminium-bearing species in the MIRA non-pulsating outflow model. Straight lines show abundances that include the photolysis, dashed lines without it. |
| In the text | |
|
Fig. 21 Temperature and density profiles of the post-shock gas at 1 R⋆ in the two models, SRV and MIRA, as a function of pulsation phase Φ = t/P, where t is the time and P is the pulsation period. |
| In the text | |
|
Fig. 22 Kinetic (non-equilibrium) abundances of the prevalent gas-phase molecules in the post-shock gas at 1 R⋆ of the pulsating models as a function of pulsation phase. Upper panel: SRV, lower panel: MIRA. |
| In the text | |
|
Fig. 23 Kinetic abundances of aluminium-bearing species in the post-shock gas at 1 R⋆ of the pulsating SRV model as a function of pulsation phase, Φ. Dashed lines show the abundances when the photodissociation is excluded.Upper panel: initial abundances given by chemical equilibrium (TE). Lower panel: initial abundances corresponding to a pure atomic gas composition. |
| In the text | |
|
Fig. 24 Kinetic (non-equilibrium) abundances of the aluminium-bearing species in the post-shock gas of the SRV model after a complete pulsation cycle (phase Φ = 1.0) as a function of radial position. Dashed lines show the abundances when the AlOH photodissociation is excluded. Upper panel: initial abundances given by chemical equilibrium. Lower panel: initial abundances corresponding to a pure atomic gas composition. |
| In the text | |
|
Fig. 25 Kinetic (non-equilibrium) abundances of the aluminium-bearing species in the post-shock gas of the MIRA model as a function of pulsation phase, Φ. Dashed lines show the abundances when the AlOH photodissociation is excluded. Upper panel: initial abundances given by chemical equilibrium. Lower panel: initial abundances corresponding to a pure atomic gas composition. |
| In the text | |
|
Fig. 26 Non-equilibrium abundances of the aluminium-bearing species in the post-shock gas of the MIRA model after a complete pulsation cycle (phase Φ = 1.0) as a function of radial position. Dashed-dotted lines show the abundances when the AlOH photodissociation is excluded. Upper panel: initial abundances given by chemical equilibrium (TE). Lower panel: initial abundances corresponding to a pure atomic gas composition. |
| In the text | |
|
Fig. 27 Cluster energies (in kJ mol−1), normalised with respect to the Al2O3 monomer, which is set to 0 (purple straight lines), nucleation energies (in kJ mol−1) shown by monomer addition (in green) and by dimers (in blue), and fit with a0 = − 1287.9 kJ mol−1 and a1 = 1075.42 kJ mol−1 of the normalised binding energies (in red). |
| In the text | |
|
Fig. 28 Gibbs free energies, ΔGf(T), of the clusters (in kJ mol−1), normalised to the cluster size, n, as a functionof cluster size, n, shown for different temperatures. |
| In the text | |
|
Fig. 29 Average Al coordination (top panel) and average AlO bond length in the GM clusters as a function of cluster size, n. The values for the bulk limit (α-alumina) are given in dashed red lines. |
| In the text | |
|
Fig. 30 Vibration modes of the (Al2O3)n, n = 1–10, GM clusters (colour-coded) as a function of the wavelength (in μm). The black contour corresponds to non-weighted (in size and metastable isomers) Lorentzian distribution. |
| In the text | |
Current usage metrics show cumulative count of Article Views (full-text article views including HTML views, PDF and ePub downloads, according to the available data) and Abstracts Views on Vision4Press platform.
Data correspond to usage on the plateform after 2015. The current usage metrics is available 48-96 hours after online publication and is updated daily on week days.
Initial download of the metrics may take a while.