| Issue |
A&A
Volume 647, March 2021
|
|
|---|---|---|
| Article Number | A20 | |
| Number of page(s) | 9 | |
| Section | Extragalactic astronomy | |
| DOI | https://doi.org/10.1051/0004-6361/202039570 | |
| Published online | 01 March 2021 | |
Edge-on boxes with X-features as parts of galactic bars
NGC 352: A direct piece of observational evidence⋆,⋆⋆
1
Research Center for Astronomy, Academy of Athens, Soranou Efessiou 4, 115 27 Athens, Greece
e-mail: This email address is being protected from spambots. You need JavaScript enabled to view it.
2
IAASARS, National Observatory of Athens, I. Metaxa & V. Pavlou, Penteli, 15236 Athens, Greece
e-mail: This email address is being protected from spambots. You need JavaScript enabled to view it.
3
Aix Marseille Université, CNRS, LAM (Laboratoire d’Astrophysique de Marseille), UMR 7326, 13388 Marseille 13, France
e-mail: This email address is being protected from spambots. You need JavaScript enabled to view it.
Received:
1
October
2020
Accepted:
2
December
2020
Abstract
Context. This paper is a contribution to the discussion about whether the X/peanut component is part of the bar, or the bar itself.
Aims. Our goal is to present a clear-cut case of a barred-spiral galaxy in which all structural components (i.e. the thick and thin part of the bar and the spiral arms) can be observed in its image and their dimensions directly measured there.
Methods. We obtained deep images of the nearby galaxy NGC 352, which has an ideal inclination allowing us to observe all of the parts that compose its morphology, estimate their relative sizes, and determine the topology of the luminous matter of this galaxy. We successfully compare our findings with the existence and the relative dimensions of the corresponding components encountered in the disc of a GADGET N-body model.
Results. NGC 352 is a barred spiral galaxy with a bar of about 13 kpc radius. Its bar has a central thick part that extends up to a distance about 5 kpc from the centre of the galaxy along its major axis, while its thickness reaches a height of 3.8 kpc. Thus, the thick part of the bar occupies the central part of the bar component, and its length is about 40% of that of the thin bar. The branches of the X-feature are characterised by the presence of ‘hooks’ at their extremities. The profile along the major axis of the bar is characterised by the presence of ‘shoulders’, the end of which is associated with local surface brightness enhancements on the equatorial plane. A central disc with a spiral-like feature embedded in it dominates in the innermost 1.7 kpc.
Conclusions. NGC 352 offers a case in which we directly observe that the X/peanut component is unambiguously part of the bar. This boxy structure is neither a separate bulge component nor the bar itself. The relative extent of the peanut with respect to the bar is well inside the range predicted in the majority of the simulated N-body bars. The hooks of the X-feature and the local surface brightness enhancements on the equatorial plane have their counterparts in surface density features of models based on the orbital theory, as well as of models based on response calculations and of fully selfconsistent N-body calculations.
Key words: galaxies: bulges / galaxies: kinematics and dynamics / galaxies: spiral / galaxies: structure
The reduced Fig. 1 is only available at the CDS via anonymous ftp to cdsarc.u-strasbg.fr (130.79.128.5) or via http://cdsarc.u-strasbg.fr/viz-bin/cat/J/A+A/647/A20
Based on observations collected at the 2.3 m Aristarchos telescope, operated on Helmos Observatory by the Institute for Astronomy, Astrophysics, Space Applications and Remote Sensing of the National Observatory of Athens.
© ESO 2021
1. Introduction
Numerical and observational studies strongly indicate that the peanut-shaped bulges observed in many edge-on disc galaxies are, in most cases, part of a bar and not the bar itself (Combes & Sanders 1981; Bettoni & Galletta 1994; Lütticke et al. 2000; Athanassoula & Misiriotis 2002; Athanassoula 2005; Bureau et al. 2006; Martinez-Valpuesta et al. 2006; Romero-Gomez et al. 2011; Athanassoula et al. 2015). For a review, see Laurikainen & Salo (2016, and references therein).
The main obstacle for verifying this is that the extent of the boxy bulge is best realised when the galaxy is viewed edge-on, while in order to specify the end of the thin bar, one needs a nearly face-on view. Thus, from an observational point of view, the arguments of this hypothesis are based on image analysis algorithms developed for that purpose, since one cannot simultaneously observe a galaxy from two perspectives. The edge-on orientation of the galaxies provides only a lower limit for the bar length, and thus no safe estimate for the relative length with respect to the peanut component.
Usually, the ratio of the boxy bulge (or peanut) to the thin bar length is estimated from the projected surface density profiles of cuts along and parallel to the major axis of the galaxy. From the profile along the major axis, one obtains the thin bar length, while the parallel cuts, which are offset from the equatorial plane, can help to estimate the extent of the peanut component (Wakamatsu & Hamabe 1984; Dettmar & Barteldrees 1990; Lütticke et al. 2000; Pohlen et al. 2000; Bureau et al. 2006). More recent studies have used, among other techniques, algorithms based on isophotal analysis in order to quantify the peanut-shaped bulges in edge-on, or nearly edge-on, disc galaxies (Erwin & Debattista 2013; Ciambur & Graham 2016; Ciambur et al. 2017). Kinematic tools have also been developed to tell whether boxy/peanut (hereafter b/p) bulges do indeed constitute part of the bar or not (Kuijken & Merrifield 1995; Chung & Bureau 2004, and references therein).
The thick bar character of the b/p bulge is in agreement with the majority of N-body models in which a thick bar component develops (for a review on the subject see Athanassoula 2016, and references therein). The technique of the parallel cuts, which is used in the observational studies, has also been applied in snapshots of N-body simulations with a similar morphology (Athanassoula & Misiriotis 2002), giving qualitatively similar results. We note, however, that there are also some cases of N-body simulations in which the thick part, that is to say the peanut structure, is the major part of the bar (see e.g. Harsoula & Kalapotharakos 2009; Contopoulos & Harsoula 2013). This may also depend on the gas fraction of the disc of the simulation (Machado 2000). We note that the extent of barlens components, which are considered to be b/p bulges of barred galaxies observed nearly face-on (Laurikainen et al. 2014), was found to be in three out of 18 simulations comparable to that of the thin bar (see Tables 1 and 2 in Athanassoula et al. 2015).
In this paper we present the case of the galaxy NGC 352 in which both the thin bar and the peanut component can be observed and their lengths directly measured on its image. Thus, there is no need for an indirect estimation. We also present a snapshot of an N-body simulation that reproduces the same morphology of a thin and a thick bar component as in NGC 352 and the corresponding spiral arms as well.
In Sect. 2 we describe the observations we conducted, on which our analysis is based. In Sect. 3 we estimate the dimensions of the components of the galaxy, in Sect. 4 we discuss the morphology in the innermost kiloparsec, while in Sect. 5 we compare the basic features of the observed morphology with that of a snapshot of a typical barred-galaxy N-body model. We present our conclusions in Sect. 6.
2. Observational data
NGC 352 is a nearby galaxy, which is viewed close to, but not perfectly, edge-on (inclination about 70° – see Sect. 3.1). This property, as well as the appropriate relative value of the bar position angles with respect to that of the galaxy gives to the observer an advantage for estimating the size of its morphological structures. This can even be done without the need for an isophotal analysis or by means of other techniques applied to galaxies with a nearly edge-on orientation (Athanassoula & Beaton 2006; Erwin & Debattista 2013). As we see, this galaxy displays interesting morphological features at large, as well as in small spatial scales. Due to its overall structure, NGC 352 has been classified in the SB class of galaxies (de Souza & dos Anjos 1987; Kandalian & Kalloghlian 1998), that is, it has been considered as a barred-spiral one.
NGC 352 is classified in the Third Reference Catalogue (de Vaucouleurs et al. 1991, RC30s) as being of an (R′)SB(rs)b? type. In the same catalogue, the apparent major isophotal diameter at the isophotal level 2 mag arcsec−2 in the B-band is  , and the ratio of the major to the minor isophotal diameter at the same isophotal level (again in the B-band) is 2.63. The cosmology-corrected luminosity distance given in the NASA/IPAC Extragalactic Database (NED) is 68.9 Mpc, for which the corresponding linear scale is 334 pc/″.
The galaxy was observed in the broad (1065.6 Å) R band, centred at 6349 Å, with the 2.3 m Aristarchos telescope at Helmos Observatory in Greece. We used the LN2 CCD optical imaging camera e2v CCD42-40, which had a scale of  pixel−1 on the re-binned to 1024 × 1024 pixels field. Three sets of 9 × 600 s, 4 × 900 s, and 1 × 1200 s were obtained, yielding a total of 10 200 s of observing time. Observations were made on July 21–22 and September 23, 2017.
Standard methods were used to analyse the data. Bias subtraction was performed in every single frame using the measured bias level from dedicated bias exposures in between successive frames. For each observing run, several flat field frames (five to eight) of variable exposure times, which were shifted with respect to each other, were obtained during twilight and later combined to create a master flat field map. This map was then used to correct the science images for the different pixel-to-pixel sensitivity and distortions in the optical path. Careful subtraction of the background was then performed in each individual science frame by using the median value of the background, which was calculated in areas away from the galaxy and less populated by stars. The corrected frames were then aligned by using several bright stars in the field as a reference. The alignment was done using the ‘align/image’ command in the ESO-MIDAS data reduction software1.
Despite the large amount of extinction in the optical bands, a careful analysis of the R image uncovers the relative dimensions and the extent of features such as the peanut, the bar, and the spiral arms of the galaxy. In Fig. 1 we present the reduced image of the galaxy, as observed with the Aristarchos telescope.
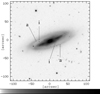 |
Fig. 1. R-band image of NGC 352, as observed with the Aristarchos telescope. The axes are in arcseconds. In the orientation of this image, north is to the right and east is down. The brighter parts appear darker according to the shades in the logarithmic, grey-scale, bar at the bottom. The arrows indicate the arms with ‘a’ and the inter-arm regions with ‘i’. |
The phenomenology of the observed object clearly points to a typical barred galaxy with a peanut-shaped central part, which probably includes an X-feature. At the image of Fig. 1, we can observe the elongated structure of a bar from the ends of which two spiral arms emerge. The spiral arms (indicated by arrows with ‘a’) are discernible and clearly separated from the main body of the bar by two lower intensity, ‘inter-arm’ regions, which are between the sides of the bar and the spiral arms (indicated by arrows with ‘i’).
The total integrated observing time allowed us to discern another inner spiral system, which is embedded in the central R ⪅ 5″. In Fig. 2 we present this inner structure together with the other morphological features of the NGC 352 bar, so that we can perceive their relative dimensions. An enlargement of the central region is given in the embedded box, which is given in the lower right corner of the figure.
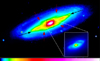 |
Fig. 2. Central structure embedded in the NGC 352 bar. It can be observed in the central parts of the galaxy and is also presented separately in the enlarged frame. The red arrows indicate the tips of the boxy feature, while the black ones point to the ends of the thin bar. |
3. The size of morphological features
3.1. Estimating the inclination
By assuming that the disc of the galaxy is already flat at the spiral arms region, we can try to estimate its inclination with respect to the sky. For this, we have used an image in which stars close to the galaxy were first identified and subsequently removed using the ‘imedit’ routine in IRAF. The actual position angle was found by fitting successive ellipses from the centre all the way to the outskirts of the galaxy (Fig. 3a). We did this by means of the corresponding ESO-MIDAS and IRAF procedures, obtaining the same results with both of them. Characteristic ellipses used for indicating the variations in the position angle (PA) of the galaxy are given in Fig. 3a. The outermost drawn ellipse, indicated with a red arrow in Fig. 3a, is at a distance from the centre 64″, while beyond 70″, we consider that to be into the noise. In Figs. 3b and c, we give the variation of the position angle and inclination angle, i = cos−1(b/a), respectively, where b and a are the semiminor and semimajor axes of each ellipse. In these two lower panels, we have indicated some distances that correspond to morphological features with vertical dashed lines; they are discussed in Sect. 3.3 below.
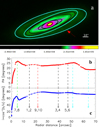 |
Fig. 3. Panel a: ellipses used for estimating the inclination of the galaxy are given overplotted in its ‘final’ image. The red arrow points to the ellipse at 64″, which includes the spiral arms. Panel b: variation with radial distance of the PA. Panel c: variation with radial distance of the quantity i = cos−1(b/a). The curve levels off in the outer parts at a value ⪆70°. The dashed lines point to distances of characteristic morphological features (see Sect. 3.3), while the two rightmost of them, which are coloured cyan, correspond to the two outermost drawn cyan ellipses in panel a. |
Here, we only note that the two cyan dashed lines on the right-hand side of the figures correspond to the two cyan drawn ellipses bracketing the spiral arms in Fig. 3a. A clearly discernible abrupt decrease in the PA curve is observed close to R = 50″. At the same distance, the curve of the inclination starts levelling off tending towards a value of about 70°. The inclination measured at the spiral arms region is  .
.
3.2. Measuring distances
The final image used for our measurements, which was rotated so that the bar of the galaxy is almost horizontal, is presented in Fig. 4a. The position angle of the bar was found to be 23° and rotation was performed using the ‘rotate/image’ command in ESO-MIDAS.
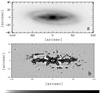 |
Fig. 4. Panel a: reduced, final, image of NGC 352. Stars have been removed and the original image has been rotated so that the major axis of the bar is almost horizontal. Panel b: same image after applying an unsharp masking technique by means of a median filter of 15 × 15 pixels, in which the X-feature is underlined. Arrows point to the characteristic hook morphology of the branches of X. Pixel intensities vary according to the (logarithmic) grey-scale bands below the images. Darker regions correspond to higher intensities. |
In order to visualise the morphological features of the galaxy in detail, which are hidden when looking directly at the observed image in many cases, we used standard unsharp masking algorithms in which a filtered (blurred) image is subtracted from the original one. Different filtering techniques may enhance different features in galactic images. In our case, a median filter of 15 × 15 pixels, which was applied to the final image in Fig. 4a, seems to enhance the bar characteristics and the faint ‘X-shaped’ structure (Fig. 4b) when used to obtain the unsharp masked image. By overplotting characteristic isophotes on the image in Fig. 4b, we emphasise the borders of the X-feature as well as the borders of the thin bar.
The details of the morphology of the thick bar component, as revealed in the unsharp masked image, are very useful for comparison with dynamical models. The X-feature, dominating the thick part of the bar, is a structure that ends abruptly; it does not fade out with increasing distance from the centre of the galaxy. As already observed in several galaxies, including NGC 352, this is underlined by the presence of characteristic breaks in the upper parts of the branches of the X-feature. These branches, or wings, turn upwards, perpendicular to the major axis of the bar. In some other cases, they even turn towards the centre of the galaxy. We could describe these features as hooks. Arrows in Fig. 4b point to them. We have also encountered hooks in unsharp masked images of NGC 4013 and UGC 2048 (Patsis & Xilouris 2006). Further typical examples of such breaks can be found in Bureau et al. (2006) (NGC 4710, NGC 6771, ESO 597-G036). It is a feature expected to be present if the b/p bulges are built by the superposition of orbits close to the x1v1 family of periodic orbits (Skokos et al. 2002). The reader may refer to Fig. 18 in Patsis et al. (2002) and Fig. 3a in Patsis & Xilouris (2006).
The use of a median filter in the unsharp masking technique helped us to determine the details of the morphology and the size of the bar. However, we found that the bar-spiral connection and the morphological details of the spiral arms are better traced when we blurred and reduced noise by using a linear Gaussian filter, with a 3 pixel sigma of the Gaussian, in the unsharp masking. This is presented in Fig. 5, where this filtering technique was applied on the original image (Fig. 1). In Fig. 5, the barred-spiral morphology of NGC 352 is apparent, as the thin bar and spiral components are emphasised. Nevertheless, in Fig. 5 the region occupied by the boxy bulge is obscured and the peanut structure is not discernible. On the other hand, the nuclear spiral is clearly revealed.
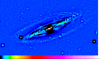 |
Fig. 5. Unsharp masking by means of a Gaussian filter, with a 3 pixel sigma of the Gaussian, applied to the galaxy image, reveals detailed features in the spiral arms region. |
By means of the unsharp masked images of the galaxy, we can visually estimate the size of its morphological components by merely pointing to the coordinates of the estimated edge of the feature we are interested in. The galaxy does not appear perfectly symmetric, so in all cases we give the average value of the two measured lengths, left and right of the galactic centre, or above and below the equatorial plane. When estimating distances in Fig. 4b, the lengths of the thin bar and the peanut were measured along the major axis of the bar. For the peanut, we considered the projection of the branches of the X-feature on this axis. The measured values are given in Table 1.
Dimensions of the morphological components of NGC 352.
The analysis of the observations allowed us to estimate quantitatively the sizes of the two structures that form the bar (b/p as well as thin bar components). Their lengths, given in Table 1, lead to a ratio of thin bar to b/p component of about 2.6, which is very close to 2.7, the mean value of this quantity found by Lütticke et al. (2000). It also corresponds to the mean value of the bar to b/p length given by Erwin & Debattista (2013) for their complete sample. In a later study, Erwin & Debattista (2017) estimate the corresponding ratio in their new sample to have a mean value of about 2.4. A slightly larger mean value, 2.86, is estimated by Laurikainen & Salo (2017). However, in this latter study, the extent of the boxy bulge was identified with the extent of the X-feature, as it is actually done in the present study as well. Despite the variations in the mean value of the ratio encountered in the above papers, we definitely can say that the size of the X-shaped peanut of NGC 352, compared with the length of its bar, is close to the mean values found in the above-mentioned papers.
We also find that the nuclear disc, which contains a spiral-like substructure, extends within a radius of about 5″. This central feature is characterised by the presence of two spiral arms and a bar-like component (enlarged box in Fig. 2).
3.3. Parallel cuts
Having estimated the lengths of the two components that constitute the bar of NGC 352 by directly measuring distances on its image, we now study how the various morphological substructures manifest their presence when one uses the standard method of the parallel cuts. This method was initiated by Wakamatsu & Hamabe (1984) and has been used by many authors (see e.g. Dettmar & Barteldrees 1990; Pohlen et al. 2000; Lütticke et al. 2000; Bureau et al. 2006).
In Fig. 6a we give the profiles successively, which were taken throughout the length of slits along (black line) and parallel to the major axis of the bar at heights of 3 14, 6
14, 6 9, and 10″. Red lines correspond to cuts above the major axis of the bar, in the final image of the galaxy (Fig. 4a), while blue lines correspond to cuts parallel to the major axis at the same heights below it. The reference distances at which one of the morphological features under discussion appears are indicated by dashed lines, which point to numbers in order to facilitate their description. By indicating the distances by means of dashed lines intersecting the curves, we can see the effect of the presence of a morphological structure on the shape of the surface brightness profile at each slit. In order to associate the features of the curves with the morphological features of the galaxy, we give below Fig. 6a with the surface brightness profiles, an unsharp version of the final image (Fig. 6b). For creating the unsharp image in Fig. 6b we have used a median filter. Distances corresponding to those marked in Fig. 6a are indicated in Fig. 6b again with dashed lines pointing to numbers compatible with those in Fig. 6a.
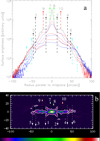 |
Fig. 6. Panel a: surface brightness profiles along slits, parallel to the x-axis of Fig. 4a. The black line crosses the centre of the galaxy, while the rest of them, from top to bottom, were taken 3 |


The limits of the conspicuous X-feature, which essentially delineate the extent of the b/p bulge, can be better traced in the two higher cuts (6 9 and 10″) between the dashed lines ‘1’ and ‘2’, at about a distance R = 15″ from the centre. The presence of the b/p structure is reflected in the “Π” shape of these curves, which indicate the steep decrease in the surface brightness beyond the borders of the boxy bulge. We also note that lines 1 and 2 cross two local minima of the black curve (along the major axis), just to the right and left of its central peak at the centre of the galaxy. Such minima are very common, both in observations (e.g. Elmegreen & Elmegreen 1985; Kim et al. 2016) and in simulations (Athanassoula & Misiriotis 2002). Both approaches clearly show that their existence is linked to the strength of the bar. Kim et al. (2016), as well as the aforementioned simulation paper (their Fig. 5), show that the depth and radial location of this minimum is a function of the position angle of the measurement with respect to the position angle of the bar. The deepest minimum, which is along the direction of the bar minor axis, is deeper when the bar is strong and nonexistent for weak bars. All this argues strongly that the bar of NGC 352 is a strong bar. The presence of these local minima in the cut along the major axis coincide as well with the end of the b/p bulge. Lütticke et al. (2000) identified this feature with the end of the presence of a central bulge (CBU) component. Their assertion that this could be associated with the radial inner Lindblad resonance should be investigated. In such a case, a radial resonance is related to the extent of a three dimensional feature, as is the b/p bulge. A similar variation in the surface brightness is observed in several other cases, for example in the major axis profiles of NGC 4710, NGC 2788A, PGC 44931, and ESO 597-G036 (Bureau et al. 2006). In all of these cases, the edges of the b/p structure can be inferred by the surface brightness profile along the major axis only.
Abrupt changes in the variation of the curves presented in Fig. 6a are in agreement with the picture of a b/p component with sharp edges embedded in the central region of an almost two dimensional disc. This morphology is secured by assuming that the building blocks of the peanut are orbits reflecting a known property of the families of the x1-tree, namely that the side-on projections of the orbits reach a maximum distance along the major axis, Rmax, beyond which they practically grow perpendicular to the equatorial plane. In this way they can form sharp edges at the sides of boxy bulges (Patsis et al. 2002). There is perfect correspondence between the kinks and plateaus of the curves of the profiles discussed so far and the edges of the X-feature depicted in Fig. 6b. In this figure, the X-feature extends between the lines numbered 1 and 2.
In the images of NGC 352, we can trace both the end of the thin bar (best viewed in Fig. 4) and the beginning of the spirals (best viewed in Fig. 5). In Fig. 6b the thin bar extends between the lines ‘3’ and ‘4’ at a distance about 39″from the centre. At the corresponding distance, on either side of the galaxy with respect to the galactic centre, the profile curves in Fig. 6a show different features. At these distances, the upper black line along the major axis of the bar has some minor kinks, which are more evident on the right side of the figure (line 4). It would be difficult just by means of the black curve to associate a major morphological feature, such as the end of the thin bar, with some characteristic kink of the curve. Looking to the corresponding curves presented for other galaxies in the relevant literature, we realise that the shape of the black line in Fig. 6a is not an exception. For example in Lütticke et al. (2000), for NGC 2654, at the estimated end of the bar length (BAL parameter in their Fig. 1), no particular features can be observed. For NGC 1175 in the same work (their Fig. 5) at the distances associated with the projected bar length of this galaxy, one may note only some minor bending of the curve of the cut along the major axis. In our case, for NGC 352, we can see at the corresponding distance in the parallel cuts, especially at those at height  , small plateaus followed by a further decrease in the surface brightness. We can say that the presence of the thin part of the bar is reflected in these kinks of the curves, apparently because the bar of NGC 352 is not perfectly aligned with the horizontal axis in the figure. Perfect alignment is not achieved because not all surface brightness maxima in the bar region are encountered along a line going through the centre of the galaxy (see also Sect. 7 below).
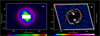 |
Fig. 7. Panel a: deprojected image of NGC 352 with parameters i = 71.6°, PA = 18.6°. Panel b: same image after applying an unsharp masking algorithm. In both panels we observe a barred-spiral morphology with a bar twisted close to its ends and tightly wound spirals. The red curves in panel b are parts of a logarithmic spiral of 5° pitch angle (see text). |
The spiral arms are clearly associated with the local surface brightness enhancements beyond the ends of the bar in Fig. 6b. Along the direction of the major axis of the bar, they can be identified close before the distance of 50″. Their presence can also be inferred readily in the two cuts at the height of 3 14. In Fig. 6a we observe that all curves decrease monotonically ending up in the noise. At larger than 70″distances, we reach the outer regions of the disc, where we have low values for the surface brightness and thus a low signal-to-noise ratio in these regions of the image. Finally, the innermost local crease of the black curve in Fig. 6a, at about 5″(lines ‘7’ and ‘8’), which is more evident at negative radii (green line 7), is clearly associated with the presence of the nuclear disc in the central 1.5 kpc of the bar.
By inspecting Fig. 6a, we realise that all curves have a staircase-like character between dashed lines ‘5’ and ‘6’ and, by comparing Fig. 6a with Fig. 6b, we can see that all kinds of stairs are associated with major morphological features. However, there is a major plateau, which is mainly evident in the black curve in Fig. 6a, but also to some degree in the curves of the cut at 3 14, which does not designate the presence of any of the main structural components of the barred-spiral morphology. The outer edges of this plateau are indicated with the dashed lines ‘9’ and ‘10’ in Fig. 6a at distances about 22″ from the centre. The corresponding positions have also been marked with lines 9 and 10 in Fig. 6b, which are clearly located between the ends of the X-feature and the thin bar. They are related with the presence of local surface brightness enhancements (green regions along the major axis of the bar). Also in Lütticke et al. (2000), one may notice these shoulders of the curve of the cut along the major axis of the bar in the cases of NGC 2654 and NGC 1157. They appear at distances clearly less than the estimated radii of the ends of the thin bars of these galaxies. In the case of NGC 352, we observe that the shoulders of the black curve in Fig. 6a correspond to these surface brightness enhancements along the major axis between the centre of the galaxy and the ends of the bar. In Patsis et al. (2002), we proposed a possible explanation for the presence of such local surface density (or surface brightness) maxima along the bar’s major axis. They could be formed due to the presence of successive, spatially nested families of the x1-tree (see ‘blurred’ profiles in that paper). This seems to be compatible with the present findings. Nevertheless, another option is discussed below (Sect. 3.4).
The application of techniques used to estimate the dimensions of the thick and thin bar components in cases of edge-on and moderately inclined galaxies (Erwin & Debattista 2013; Ciambur & Graham 2016) could lead to a more precise estimation of the lengths of the b/p and thin bar components. However, the differences are not expected to significantly change the observed overall morphology in the case of NGC 352.
3.4. Deprojection of the image
The advantage of the current image with respect to other images of galaxies with peanut-shaped ‘bulges’ is the presence of clearly discernible spirals emerging from the ends of the bar. Ignoring the thick part of the bar, we attempted to deproject the flat part of the disc, which includes the thin bar and the spirals. We did it by means of the rotated final image presented in Fig. 4a.
Since we estimated the inclination of the disc to be  at the location of the outermost ellipse in Fig. 3a, we used this value and the corresponding PA = 18 ° .4 to create a face-on image of NGC 352. By means of the ESO-MIDAS application procedure ‘perspec.prg’, we ended up with the image depicted in Fig. 7a. The central part, corresponding to the thick part of the bar, has been masked out, as it is a structure with a considerable height. In the deprojected image, we applied the unsharp masking technique again, using a Gaussian smoothed image with a 3 pixel sigma in order to emphasise the details of the morphology of the galaxy and we present it in Fig. 7b. The spiral arms, traced beyond the end of the bar, are asymmetric. The main difference is that the left arm, which starts close to the upper end of the bar in Figs. 7a and b, turns again towards the opposite end forming a pseudoring; while in the right arm, a similar extension towards the upper end of the bar is missing. Such asymmetric morphologies are common among barred-spiral galaxies. As a typical example, we mention NGC 986 in Fornax2. A bi-symmetric logarithmic spiral with a 5° pitch angle, originated at the centre of the system, passes through most of the local surface brightness maxima in the arms’ region (probably HII regions). This was overplotted with continuous red lines in Fig. 7b. Although we did not try to fit the resulting spiral structure with a logarithmic spiral, it is evident that we had to make do with a tightly wound set of spiral arms.
In both figures we discern a part of the thin bar exceeding the masked areas along the directions of the major axis. The surface brightness maxima of this part are not aligned with the major axis all the way to its end. The bright parts of the bar are bend in towards the beginning of the spiral arms as we can observe in both panels of Fig. 7. Such a morphology is compatible with the known phenomenon of twisting of isophotes (see e.g. Elmegreen et al. 1996).
4. The central spiral-like feature
Our deep images of the NGC 352 bar revealed the presence of a visually separated nuclear disc component, with an apparent barred-spiral-like structure, as we can see in Fig. 2 and Fig. 5. In both figures it is evident that the nuclear and the outer sets of spirals unwind in the same direction. Assuming dynamics of an isolated system and a unique sense of rotation for all galaxy components, we conclude that we have to make do with two, two-armed spiral patterns, which are expected to be trailing (Binney & Tremaine 2008, Sect. 6.1.3). The presence of nuclear bars, nuclear spirals, and/or nuclear rings are usually associated with the presence of nuclear discs in the central parts of galactic discs (Kormend & Kennicutt 2004; Athanassoula 2005; Drory & Fisher 2007; Gadotti et al. 2018).
We note that Chung & Bureau (2004) as well as Méndez-Abreu et al. (2014) find cool disc components, related with the presence of nuclear rings or spiral arms, embedded in several b/p bulges. Recently b/p bulges have also been detected in inner bars in the central regions of galaxies (Méndez-Abreu et al. 2019). In typical X-shaped bulge cases such as NGC 4710 and NGC 5746, Bureau & Freeman (1999) traced fast-rotating gaseous components in the central regions (nuclear spirals) attributing them to the presence of x2 flows.
An additional relevant case worth being mentioned here is of a galaxy with a ‘barlens’ feature. Galaxies in which a barlens component is identified (Laurikainen et al. 2011) are considered to be barred galaxies with b/p bulges observed nearly face-on. In other words, the barlenses are the face-on counterparts of the b/p bulges (see Laurikainen & Salo 2016; Athanassoula 2016, for a review). A typical case of a barlens galaxy is NGC 4314, which shows a star forming nuclear ring in its central region and, exterior to the ring of young stars, two symmetric stellar spiral arms (Benedict et al. 2002). Counting NGC 4314 as a b/p galaxy, then the central morphology of the X-shaped NGC 352 is in direct correspondence with the one encountered in typical b/p/barlens galaxies.
As noted by Athanassoula (2005), nuclear discy components can co-exist with b/p bulges, in other words barlenses, in which case a number of structures of a limited radial extent, such as nuclear spirals, nuclear rings, and nuclear bars, are seen in the central parts of the barlenses. In our study, NGC 352 offers a nice example of such a case.
5. N-body model
In Fig. 8 we present a snapshot from simulation 114 by Athanassoula et al. (2013). It was run with the TreeSPH code GADGET (Springel 2005). Here, we provide some information and refer the reader to the aforementioned paper for a full description.
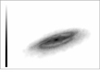 |
Fig. 8. Snapshot of the N-body model viewed in an orientation similar to that of NGC 352 (cf with Fig. 1). Darker shades correspond to denser regions, according to the grey-scale bar at the left side of the figure. |
The total baryon mass is equal to 5 × 10¹⁰ M⊙ of which three-quarters are initially in gas. Star formation, feedback, and cooling were included in the simulation using the subgrid physics of Springel & Hernquist (2003). The initial conditions were set up following Rodionov et al. (2009) and Rodionov & Athanassoula (2011). In the initial configuration, a stellar and a gas disc were embedded in a dark matter halo. Both discs have an exponential radial distribution. The density profiles of the disc and halo components are given by
 (1)
(1)
and
 (2)
(2)
respectively. We note that Rdisc and zdisc are the radial scale length and the vertical scale height of the stellar disc of 3 and 0.6 kpc, respectively. The gaseous disc also has a radial scale-length of 6 kpc, while its vertical scale height is considerably smaller and its precise value was set by the hydrostatic equilibrium achieved during the iterative calculation of the initial conditions (Rodionov & Athanassoula 2011).
The parameter α in Eq. (2) is defined as
![Mathematical equation: $$ \begin{aligned} \alpha = [1 -\sqrt{\pi } \exp (q^2) (1- \mathrm{erf}(q))]^{-1}, \end{aligned} $$](/articles/aa/full_html/2021/03/aa39570-20/aa39570-20-eq15.gif)
where q = γ/rc (Hernquist 1993). In the present model, we have taken γ = 1.5 kpc, rc = 30 kpc, and Mhalo = 2.5 × 10¹¹ M⊙. We used the GADGET2 system of units, that is to say the unit of length is 1 kpc, the unit of mass is 1010 M⊙, and the unit of velocity 1 km s−1. As a result, the time unit is 0.98 Gyr. More information on the initial conditions, the code, and the simulation can be found in Athanassoula et al. (2013). The snapshot in Fig. 8 corresponds to 9 Gyr after the beginning of the simulation.
This is a typical N-body model of a barred-spiral system that reproduces a b/p-thin-bar morphology, followed by trailing spiral arms, with relative dimensions of its components very similar to those we estimate for the galaxy we study. In self-consistent simulations, such a morphological configuration lasts for several gigayears for a large variation in the properties of the initial conditions of the models (see e.g. Athanassoula et al. 2013; Salo & Laurikainen 2017). Thus, we conclude that the basic NGC 352 morphology is very frequent in barred-spiral systems. By estimating the ratio of the length of the thin part of the bar to that of the peanut in the snapshot of the simulation by applying the same method as in the image of the galaxy, we get a value of about 2.5. This is in excellent agreement with the corresponding ratio we find for NGC 352. We note that in Athanassoula et al. (2015), for the same simulation (‘gtr114’) but with a different procedure, the ratio of the thin bar length to the length of the barlens was found to be about to 2.2. This is expected since the two studies use a different definition for peanut length. Here, we consider the projection of the branches of the X-feature on the major axis of the bar as the peanut length, a definition which gives the shortest of all peanut length estimates. In general, the snapshot of the simulation and the galaxy we study have similar morphologies and relative dimensions of their morphological features.
We also note that another similarity between simulation gtr114 from Athanassoula et al. (2013) and the NGC 352 morphology are the tightly wound spirals beyond the end of the bar. In both cases, such spiral arms can be described as forming a pseudo-ring.
The details of the presented simulation match the overall morphology of NGC 352. However, the ratio of the length of the X-shape bulge, besides the one from Athanassoula (2005), is found to be 35–50% of the length of the thin bar in the majority of the relevant N-body models (see also e.g. Erwin & Debattista 2013; Laurikainen & Salo 2017; Saha et al. 2018).
6. Discussion and conclusions
The ideal inclination of NGC 352, which is close to 70°, and our deep images of its disc gave us the opportunity to measure the relative dimensions of its structural components. We can directly observe the following on the image of the galaxy:
-
The peanut-shaped bulge occupies the central part of the bar and it is not the bar itself.
-
The b/p bulge harbours a prominent X-feature, which is best traced in unsharp masked images of the galaxy. The details of its morphology are similar to many X-features observed in other cases. We underline the abrupt end of the feature along the direction of the major axis of the bar and the hooks at the ends of its branches.
-
The ratio of the lengths of the thin bar to the b/p feature is about 2.6. This is in good agreement with the mean value of this ratio in the samples of Lütticke et al. (2000) and Erwin & Debattista (2013) and well inside the range of the corresponding ratios in Erwin & Debattista (2017) and Laurikainen & Salo (2017).
-
The thin part of the bar extends to larger distances from the centre than the b/p bulge and is followed by spiral arms, which are discernible in the image of the galaxy.
-
We estimated the inclination angle of the galactic disc to be i ≈ 71°. Such a value leads to a deprojected image in which the spiral arms are tightly wound with pitch angles, pi ≈ 5°, although not perfectly logarithmic. Such a spiral structure can be considered as forming an asymmetric pseudoring.
-
At the centre of the galaxy, there is a discy component in which a nuclear spiral has been observed with arms unwinding in the same direction as the main ones.
The revealed overall face-on morphology of the flat parts of the bar of NGC 352 is the one reproduced by response models of bars followed by chaotic spirals. A typical example is model 1 in Patsis & Kalapotharakos (2011, cf. their Fig. 3). Similar configurations are encountered in the barred-spiral or barred-ring morphologies of the chaotic spiral models by means of the manifold theory in Athanassoula et al. (2009), as well as in fully self-consistent N-body simulations, as the one we show in Sect. 5.
A further result of this study is the presence of shoulders in the surface brightness profile along the major axis of the bar, which are clearly located in the region between the ends of the thick and the thin parts of the bar. Explanations for their presence can be sought either in the stair-type profiles predicted by the orbital theory for the vertical structure of the bars, or in the twisting of the outer parts of the bar close to the beginning of the spiral arms. Nevertheless, the two scenarios could be easily combined as the twisting of the orbits may well affect all families of the x1-tree close to corotation.
By looking at snapshots of N-body models in large databases of simulations, it is evident that the peanut-barred-spiral morphology, with similar relative dimensions between the two components of the bar as in NGC 352, followed by a tightly wound, or pseudo-ring shaped, spiral structure is a typical one. In the vast majority of such models (Athanassoula 2005; Athanassoula et al. 2013; Salo & Laurikainen 2017), the b/p feature is the thick part of the bar, while its thin part extends to larger radii. The data we present here for NGC 352 are a direct observational example of this structure in a real barred-spiral galaxy.
Acknowledgments
This work has been partially supported by the Research Committee of the Academy of Athens through the project 200/895. The 2.3 m Aristarchos telescope is operated on Helmos Observatory by the Institute for Astronomy, Astrophysics, Space Applications and Remote Sensing of the National Observatory of Athens. We thank Prof. G. Contopoulos for fruitful discussions and very useful comments. PAP thanks the financial support of Aix Marseille Université for a 2-month visiting professorship at LAM. E.A. thanks the CNES for financial support. This work was granted access to the HPC resources of CINES under the allocations 2018-A0040407665 and 2019-A0040407665 attributed by GENCI(Grand Equipement National de Calcul Intensif). Centre de Calcul Intensif Aix-Marseille is acknowledged for granting access to its high-performance computing resources. These two CPU time allocations allowed EA to run and analyse the simulation used here.
References
- Athanassoula, E. 2005, MNRAS, 358, 1477 [NASA ADS] [CrossRef] [Google Scholar]
- Athanassoula, E. 2016, Galactic Bulges, eds. E. Laurikainen, R. Peletier, & D. Gadotti (Switzerland: Springer International Publishing), Astrophys. Space Sci. Library, 418, 391 [NASA ADS] [CrossRef] [Google Scholar]
- Athanassoula, E., & Beaton, R. 2006, MNRAS, 370, 1499 [NASA ADS] [CrossRef] [Google Scholar]
- Athanassoula, E., & Misiriotis, A. 2002, MNRAS, 330, 35 [NASA ADS] [CrossRef] [Google Scholar]
- Athanassoula, E., Romero-Gomez, M., & Masdemont, J. J. 2009, MNRAS, 394, 67 [NASA ADS] [CrossRef] [Google Scholar]
- Athanassoula, E., Machado, R. R. G., & Rodionov, S. A. 2013, MNRAS, 429, 1949 [NASA ADS] [CrossRef] [Google Scholar]
- Athanassoula, E., Laurikainen, E., Salo, H., & Bosma, A. 2015, MNRAS, 454, 3843 [NASA ADS] [CrossRef] [Google Scholar]
- Barnes, J. E. 2002, MNRAS, 333, 481 [Google Scholar]
- Benedict, G. F., Howell, D. A., Jørgensen, I., et al. 2002, AJ, 123, 1411 [NASA ADS] [CrossRef] [Google Scholar]
- Bettoni, D., & Galletta, G. 1994, A&A, 281, 1 [NASA ADS] [Google Scholar]
- Binney, J., & Tremaine, S. 2008, Galactic Dynamics (Princeton University Press) [Google Scholar]
- Bureau, M., & Freeman, K. 1999, MNRAS, 118, 126 [Google Scholar]
- Bureau, M., Aronica, G., Athanassoula, E., et al. 2006, MNRAS, 370, 753 [NASA ADS] [CrossRef] [Google Scholar]
- Chung, A., & Bureau, M. 2004, AJ, 127, 3192 [NASA ADS] [CrossRef] [Google Scholar]
- Ciambur, B. C., & Graham, A. W. 2016, MNRAS, 459, 1276 [NASA ADS] [CrossRef] [Google Scholar]
- Ciambur, B. C., Graham, A. W., & Bland-Hawthorn, J. 2017, MNRAS, 471, 3988 [NASA ADS] [CrossRef] [Google Scholar]
- Combes, F., & Sanders, R. H. 1981, A&A, 96, 164 [NASA ADS] [Google Scholar]
- Contopoulos, G., & Harsoula, M. 2013, MNRAS, 436, 1201 [NASA ADS] [CrossRef] [Google Scholar]
- Cox, T. J., Jonsson, P., Primac, K. J. R., & Somerville, R. S. 2006, MNRAS, 373, 1013 [NASA ADS] [CrossRef] [Google Scholar]
- de Souza, R. E., & dos Anjos, S. 1987, A&A, 70, 465 [Google Scholar]
- Dettmar, R.-J., & Barteldrees, A. 1990, ESO.CTIO Workshop on Bulge sof Galaxies, ESO, eds. B. J. Jarvis, & D. M. Terndruo, 255 [Google Scholar]
- de Vaucouleurs, G., de Vaucouleurs, A., Cowien, H. G., Jr, et al. 1991, Third reference catalogue of bright galaxies (RC3) (New York: Springer) [Google Scholar]
- Drory, N., & Fisher, D. B. 2007, ApJ, 664, 640 [NASA ADS] [CrossRef] [Google Scholar]
- Elmegreen, D. M., & Elmegreen, B. G. 1985, ApJ, 288, 43 [NASA ADS] [CrossRef] [Google Scholar]
- Elmegreen, D. M., Elmegreen, B. G., Chromey, F. R., et al. 1996, AJ, 111, 1880 [NASA ADS] [CrossRef] [Google Scholar]
- Erwin, P., & Debattista, V. 2013, MNRAS, 431, 3060 [NASA ADS] [CrossRef] [Google Scholar]
- Erwin, P., & Debattista, V. 2017, MNRAS, 468, 2058 [NASA ADS] [CrossRef] [Google Scholar]
- Gadotti, D. A., Sánchez-Blázquez, P., Falcón-Barroso, J., et al. 2018, MNRAS, 482, 506 [NASA ADS] [CrossRef] [Google Scholar]
- Harsoula, M., & Kalapotharakos, C. 2009, MNRAS, 394, 1605 [NASA ADS] [CrossRef] [Google Scholar]
- Hernquist, L. 1993, ApJS, 86, 389 [NASA ADS] [CrossRef] [Google Scholar]
- Kandalian, R. A., & Kalloghlian, A. T. 1998, Astrophysics, 41, 1 [CrossRef] [Google Scholar]
- Kim, T., Gadotti, D., Athanassoula, E., et al. 2016, MNRAS, 462, 3430 [NASA ADS] [CrossRef] [Google Scholar]
- Kormend, Y. J., & Kennicutt, R. C., Jr 2004, ARA&A, 42, 603 [NASA ADS] [CrossRef] [Google Scholar]
- Kuijken, K., & Merrifield, M. 1995, ApJ, 443, 13 [NASA ADS] [CrossRef] [Google Scholar]
- Laurikainen, E., & Salo, H. 2016, in Galactic Bulges, eds. E. Laurikainen, R. Peletier, & D. Gadotti (Springer), Astrophys. Space Sci. Library, 77, 418 [Google Scholar]
- Laurikainen, E., & Salo, H. 2017, A&A, 598, A10 [NASA ADS] [CrossRef] [EDP Sciences] [Google Scholar]
- Laurikainen, E., Salo, H., Buta, R., & Knapen, J. H. 2011, MNRAS, 418, 1452 [NASA ADS] [CrossRef] [Google Scholar]
- Laurikainen, E., Salo, H., Athanassoula, E., Bosma, A., & Herrera-Endoqui, M. 2014, MNRAS, 444, L80 [NASA ADS] [CrossRef] [Google Scholar]
- Lütticke, R., Dettmar, R. J., & Pohlen, M. 2000, A&A, 362, 435 [Google Scholar]
- Machado, R. E. G. Ph.D. Thesis, University of Sao Paolo, Brazil [Google Scholar]
- Manos, T., & Machado, R. E. G. 2014, MNRAS, 438, 2201 [NASA ADS] [CrossRef] [Google Scholar]
- Martinez-Valpuesta, I., Shlosman, I., & Heller, C. 2006, ApJ, 637, 214 [NASA ADS] [CrossRef] [Google Scholar]
- Méndez-Abreu, J., Debattista, V. P., Corsini, E. M., & Aguerri, J. A. L. 2014, A&A, 572, 25 [Google Scholar]
- Méndez-Abreu, J., de Lorenzo-Cáceres, A., Gadotti, D. A., et al. 2019, MNRAS, 482, L118 [NASA ADS] [CrossRef] [Google Scholar]
- Patsis, P. A., & Kalapotharakos, C. 2011, Mem. Soc. Astr. It. Suppl., 18, 83 [Google Scholar]
- Patsis, P. A., & Xilouris, E. M. 2006, MNRAS, 366, 1121 [NASA ADS] [CrossRef] [Google Scholar]
- Patsis, P. A., Skokos, Ch., & Athanassoula, E. 2002, MNRAS, 337, 578 [NASA ADS] [CrossRef] [Google Scholar]
- Pohlen, M., Dettmar, R.-J., Lütticke, R., & Schwarzkopf, U. 2000, A&AS, 144, 405 [NASA ADS] [CrossRef] [EDP Sciences] [Google Scholar]
- Rodionov, S. A., & Athanassoula, E. 2011, MNRAS, 410, 111 [CrossRef] [Google Scholar]
- Rodionov, S. A., Athanassoula, E., & Sotnikova, N. Y. a. 2009, MNRAS, 392, 904 [NASA ADS] [CrossRef] [Google Scholar]
- Romero-Gomez, M., Athanassoula, E., Antoja, T., & Figueras, F. 2011, MNRAS, 418, 1176 [NASA ADS] [CrossRef] [Google Scholar]
- Saha, K., Graham, A. W., & Rodríguez-Herranz, I. 2018, ApJ, 852, 133 [NASA ADS] [CrossRef] [Google Scholar]
- Salo, H., & Laurikainen, E. 2017, ApJ, 835, 252 [NASA ADS] [CrossRef] [Google Scholar]
- Skokos, Ch., Patsis, P. A., & Athanassoula, E. 2002, MNRAS, 333, 847 [NASA ADS] [CrossRef] [Google Scholar]
- Springel, V. 2005, MNRAS, 364, 1105 [Google Scholar]
- Springel, V., & Hernquist, L. 2003, MNRAS, 339, 289 [Google Scholar]
- Wakamatsu, K., & Hamabe, M. 1984, ApJS, 56, 283 [NASA ADS] [CrossRef] [Google Scholar]
All Tables
All Figures
|
Fig. 1. R-band image of NGC 352, as observed with the Aristarchos telescope. The axes are in arcseconds. In the orientation of this image, north is to the right and east is down. The brighter parts appear darker according to the shades in the logarithmic, grey-scale, bar at the bottom. The arrows indicate the arms with ‘a’ and the inter-arm regions with ‘i’. |
| In the text | |
|
Fig. 2. Central structure embedded in the NGC 352 bar. It can be observed in the central parts of the galaxy and is also presented separately in the enlarged frame. The red arrows indicate the tips of the boxy feature, while the black ones point to the ends of the thin bar. |
| In the text | |
|
Fig. 3. Panel a: ellipses used for estimating the inclination of the galaxy are given overplotted in its ‘final’ image. The red arrow points to the ellipse at 64″, which includes the spiral arms. Panel b: variation with radial distance of the PA. Panel c: variation with radial distance of the quantity i = cos−1(b/a). The curve levels off in the outer parts at a value ⪆70°. The dashed lines point to distances of characteristic morphological features (see Sect. 3.3), while the two rightmost of them, which are coloured cyan, correspond to the two outermost drawn cyan ellipses in panel a. |
| In the text | |
|
Fig. 4. Panel a: reduced, final, image of NGC 352. Stars have been removed and the original image has been rotated so that the major axis of the bar is almost horizontal. Panel b: same image after applying an unsharp masking technique by means of a median filter of 15 × 15 pixels, in which the X-feature is underlined. Arrows point to the characteristic hook morphology of the branches of X. Pixel intensities vary according to the (logarithmic) grey-scale bands below the images. Darker regions correspond to higher intensities. |
| In the text | |
|
Fig. 5. Unsharp masking by means of a Gaussian filter, with a 3 pixel sigma of the Gaussian, applied to the galaxy image, reveals detailed features in the spiral arms region. |
| In the text | |
|
Fig. 6. Panel a: surface brightness profiles along slits, parallel to the x-axis of Fig. 4a. The black line crosses the centre of the galaxy, while the rest of them, from top to bottom, were taken 3 |
| In the text | |
|
Fig. 7. Panel a: deprojected image of NGC 352 with parameters i = 71.6°, PA = 18.6°. Panel b: same image after applying an unsharp masking algorithm. In both panels we observe a barred-spiral morphology with a bar twisted close to its ends and tightly wound spirals. The red curves in panel b are parts of a logarithmic spiral of 5° pitch angle (see text). |
| In the text | |
|
Fig. 8. Snapshot of the N-body model viewed in an orientation similar to that of NGC 352 (cf with Fig. 1). Darker shades correspond to denser regions, according to the grey-scale bar at the left side of the figure. |
| In the text | |
Current usage metrics show cumulative count of Article Views (full-text article views including HTML views, PDF and ePub downloads, according to the available data) and Abstracts Views on Vision4Press platform.
Data correspond to usage on the plateform after 2015. The current usage metrics is available 48-96 hours after online publication and is updated daily on week days.
Initial download of the metrics may take a while.