Fig. 6.
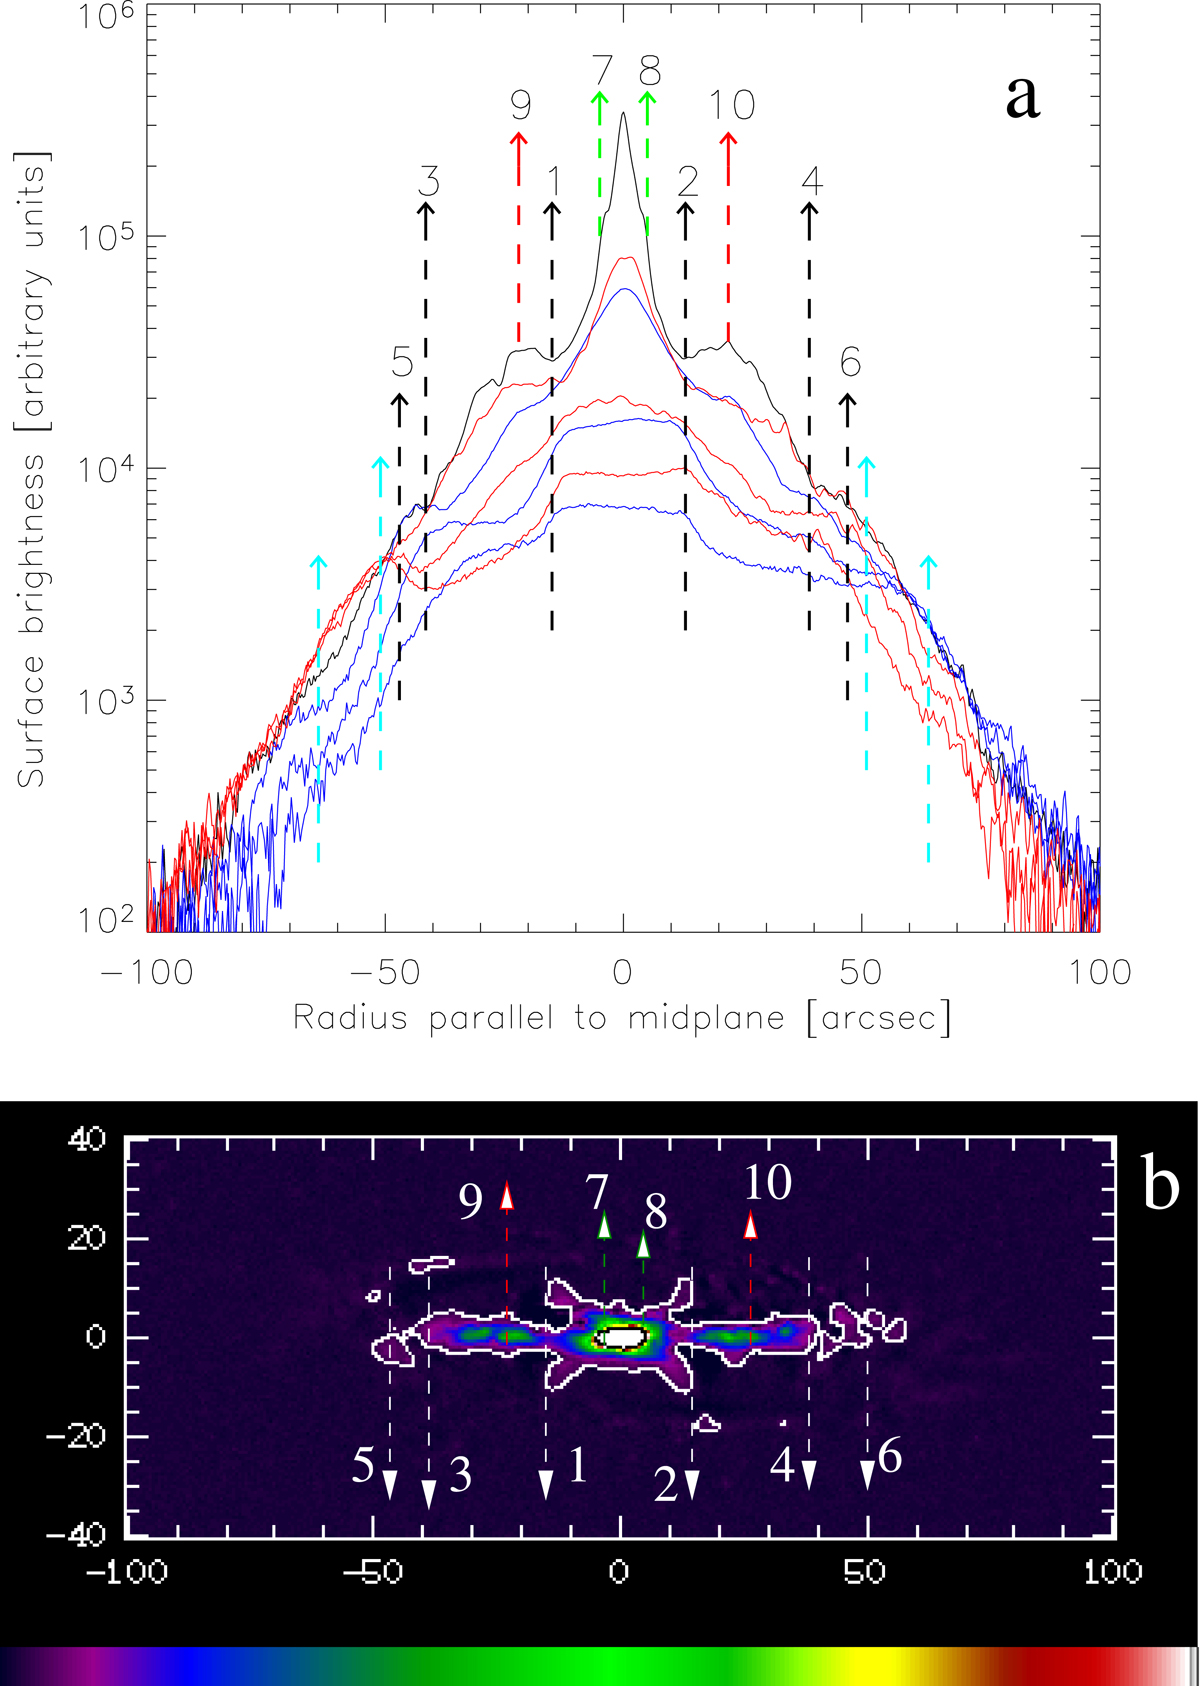
Panel a: surface brightness profiles along slits, parallel to the x-axis of Fig. 4a. The black line crosses the centre of the galaxy, while the rest of them, from top to bottom, were taken 3![]() 14, 6
14, 6![]() 9, and 10″above (red lines) and below (blue lines) it. Panel b: unsharped masked image of the galaxy. Characteristic distances from the galactic centre are indicated in both panels with dashed perpendicular lines, which correspond to morphological features discussed in the text.
9, and 10″above (red lines) and below (blue lines) it. Panel b: unsharped masked image of the galaxy. Characteristic distances from the galactic centre are indicated in both panels with dashed perpendicular lines, which correspond to morphological features discussed in the text.
Current usage metrics show cumulative count of Article Views (full-text article views including HTML views, PDF and ePub downloads, according to the available data) and Abstracts Views on Vision4Press platform.
Data correspond to usage on the plateform after 2015. The current usage metrics is available 48-96 hours after online publication and is updated daily on week days.
Initial download of the metrics may take a while.