Fig. 3.
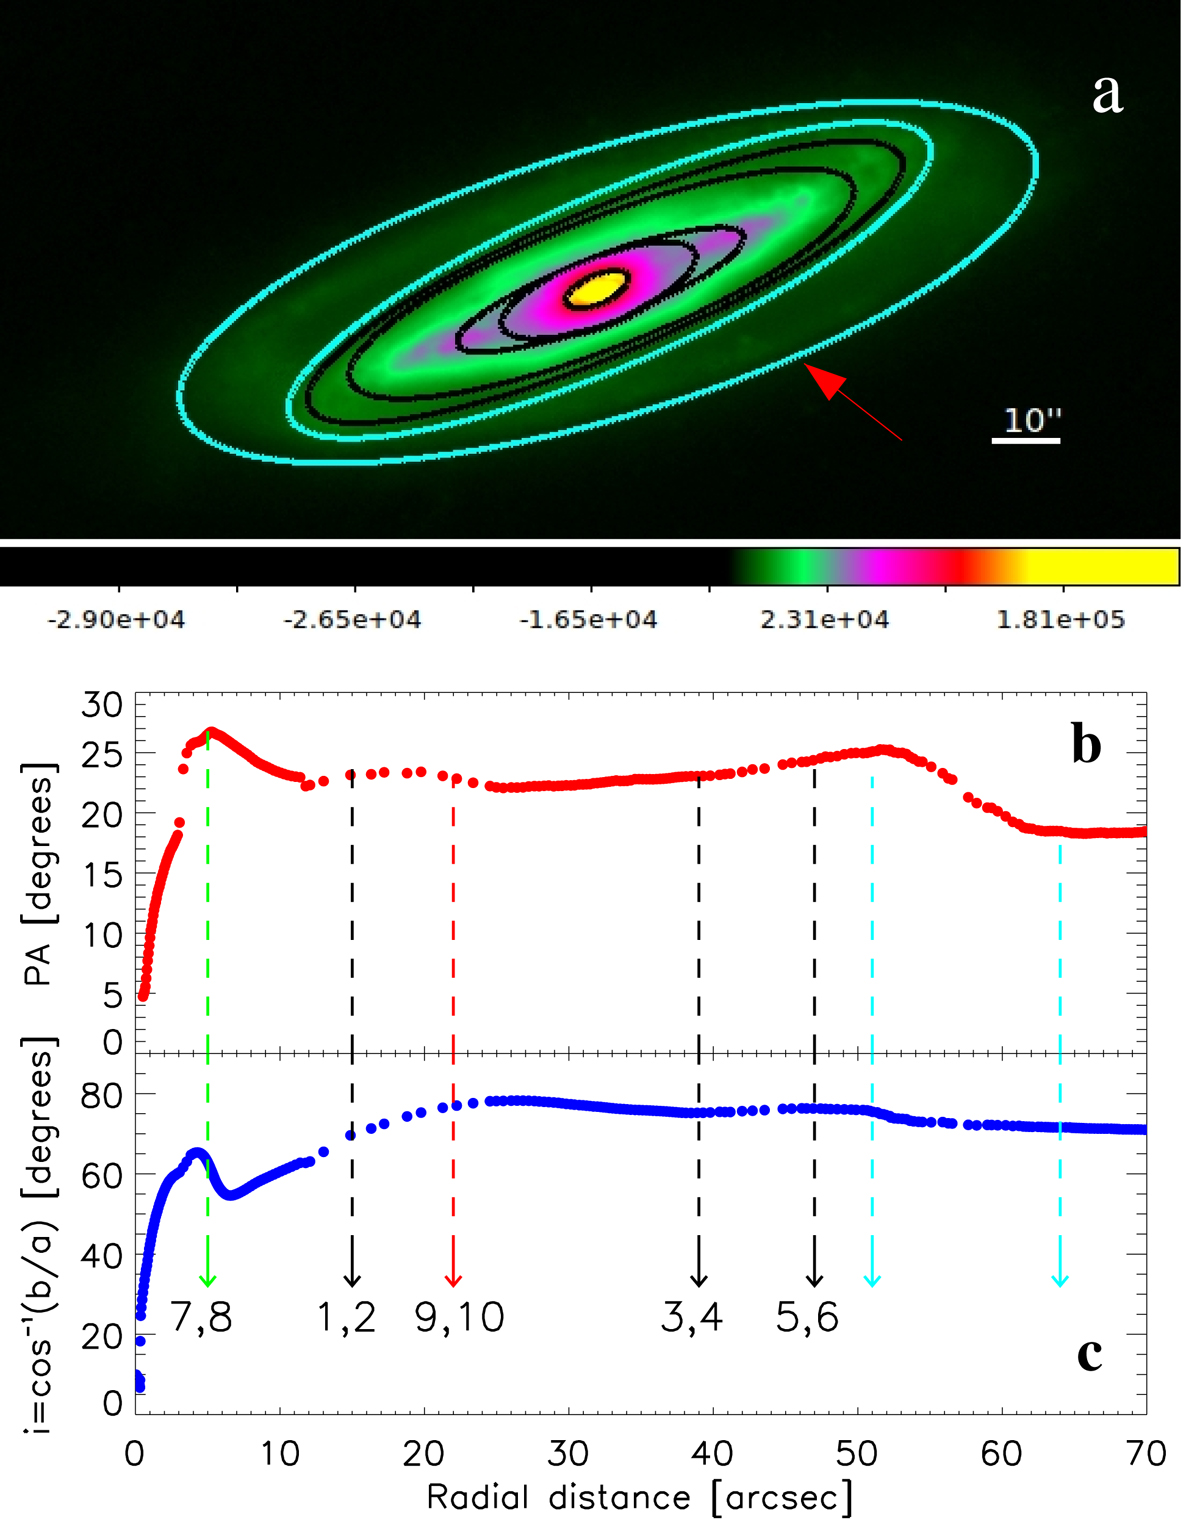
Panel a: ellipses used for estimating the inclination of the galaxy are given overplotted in its ‘final’ image. The red arrow points to the ellipse at 64″, which includes the spiral arms. Panel b: variation with radial distance of the PA. Panel c: variation with radial distance of the quantity i = cos−1(b/a). The curve levels off in the outer parts at a value ⪆70°. The dashed lines point to distances of characteristic morphological features (see Sect. 3.3), while the two rightmost of them, which are coloured cyan, correspond to the two outermost drawn cyan ellipses in panel a.
Current usage metrics show cumulative count of Article Views (full-text article views including HTML views, PDF and ePub downloads, according to the available data) and Abstracts Views on Vision4Press platform.
Data correspond to usage on the plateform after 2015. The current usage metrics is available 48-96 hours after online publication and is updated daily on week days.
Initial download of the metrics may take a while.