| Issue |
A&A
Volume 642, October 2020
|
|
|---|---|---|
| Article Number | A218 | |
| Number of page(s) | 10 | |
| Section | Planets and planetary systems | |
| DOI | https://doi.org/10.1051/0004-6361/202037763 | |
| Published online | 23 October 2020 | |
Tensile strength of dust-ice mixtures and their relevance as cometary analog material
1
Institut für Planetenforschung, Deutsches Zentrum für Luft- und Raumfahrt (DLR),
Berlin, Germany
e-mail: This email address is being protected from spambots. You need JavaScript enabled to view it.
2
Institut für Geophysik und Extraterrestrische Physik, Technische Universität Braunschweig, Braunschweig, Germany
Received:
18
February
2020
Accepted:
2
September
2020
Abstract
Aims. The tensile strength of granular matter is of great importance to our understanding of the evolution of comets and to our attempts to reproduce processes on cometary surfaces in laboratory experiments. In this work, we investigate the tensile strength of three different materials and their mixtures, which can be used as cometary analog materials in the laboratory.
Methods. We used two types of siliceous dusts and granular water ice whose polydisperse particles were either angular or spherical. Our samples were cooled to below 150 K to better simulate the conditions of a cometary surface and to avoid thermal alteration of the material. We used the Brazilian disk test method to exert stress on the cooled samples and determine the tensile strength at the moment the samples broke.
Results. We find that the tensile strength of two component mixtures is strongly dominated by the component with the higher tensile strength. The materials made of mostly angular dust particles have a lower filling fraction, but a higher tensile strength compared to materials made of spherical particles. Furthermore, the tensile strength of the cooled components is substantially lower than the tensile strength of the same components at room temperature. This implies that the surface energy of the investigated materials at low temperatures is significantly lower than previously assumed.
Key words: comets: general / methods: laboratory: solid state / planets and satellites: formation
© ESO 2020
1 Introduction
Despite visits of recent space missions to comets (e.g., ESA’s Rosetta mission and NASA’s Deep Impact mission), the activity of comets is not yet well understood. Direct observations and laboratory experiments on Earth have shown that cometary surfaces are very active when approaching the Sun. Near-surface volatiles enter the gas phase through sublimation and drag nonvolatile particles with them (Kührt & Keller 1994; Gundlach et al. 2015; Keller et al. 2017). Through this process a comet loses material during each orbit until it finally extinguishes. In the 1990s sublimation experiments with dust-ice mixtures were performed as part of the KOSI (KOmetenSImulation) project to simulate and understand these cometary surface processes (e.g., Grün et al. 1989, 1993; Lämmerzahl et al. 1995). However, these experiments are not suitable and were not designed to understand complex morphologies such as cliffs, cracks, or mass movements that have only later been observed on 67P/Churyumov-Gerasimenko (Thomas et al. 2015; Pajola et al. 2016; El-Maarry et al. 2019). The composition and grain size of the material, interparticle forces, and porosity are of fundamental importance in processes that form these morphologies. These parameters find their macroscopic expression in the tensile strength of the comet-forming materials and determine whether cliffs, cracks, or boulders can form on the surface of a comet (El-Maarry et al. 2015; Groussin et al. 2015; Vincent et al. 2016).
In this work we examined the suitability of different components and their mixtures as cometary analogs with respect to their tensile strength. According to the Johnson-Kendall-Roberts (JKR) theory from Johnson et al. (1971) the tensile strength is linearly dependent on the surface energy of a material. This approach is suitable to calculate the surface energy of granular materials made of spheres and to compare liquid nitrogen cooled samples and uncooled samples of previous works (Kimura et al. 2015). The tensile strength of granular matter is also dependent on the number of mutual contacts of individual particles. This number transfers into the macroscopic value of the filling fraction and describes how much free space is in a volume filled with particles.
To realize the analyses, the Brazilian disk test is an established method to measure the tensile strength of a material (Meisner et al. 2012; Li & Wong 2013). In this test, pressure is applied to cylindrical samples until they break. The pressure exerted in the moment of the breakup refers to the tensile strength and can be analyzed. So far, using the Brazilian disk test method, the tensile strength has only been measured for the pure components from which a comet could be formed, for example, water ice, or dust with a tensile strength of a few kilopascals (Gundlach et al. 2018a; Steinpilz et al. 2019) or granular organic materials (Bischoff et al. 2020). In this study, we present Brazilian disk test measurements of mixtures of different components that could be considered as cometary analog materials and show their dependence on particle shape, tensile strength, filling fraction, and surface energy. With the data obtained from these measurements, numerical models simulating granular matter on comets (Kappel et al. 2020) can be improved or calibrated.
A major challenge to design Earth-based experiments and to find suitable analog materials is to overcome Earth’s gravity that usually is orders of magnitude larger than comets. On a comet gravity plays a minor role in solidity, which is dominated by the cohesion of its components (Scheeres et al. 2010; Skorov & Blum 2012; Sánchez & Scheeres 2014). In order to achieve a regime dominated by cohesion in the laboratory, the used particles have to be very small. When the particle radius is less than 50 μm, the amount of mutual particle contacts in a given volume produces cohesive forces that exceed gravity (Bischoff et al. 2019). Thus, to produce cometary analog materials whose mechanical properties are dominated by cohesion, particle sizes in the laboratory must be on the order of a few microns. We selected the three materials water ice, silica, and fly ash with particle sizes in this range, but different particle shapes, and we analyzed their influence on filling fraction, tensile strength, and surface energy of a sample.
In recent years, experiments with vacuum sublimation chambers were used to simulate space conditions to investigate the evolving surfaces of dust-volatile mixtures (Poch et al. 2016a,b; Kaufmann & Hagermann 2018). As part of the Cometary Physics Laboratory (CoPhyLab) project, we aim to support these and similar experiments by studying various siliceous dust and water ice mixtures not only for their tensile strength but also their suitability as cometary analog materials. In addition to the influence of different materials and low temperatures, we investigate how spherical and angular grain shapes affects the tensile strength. The results contribute to a better understanding of the formation of the observed morphologies on a surface of the comet.
Motivated to find suitable cometary analog materials, we describe sample preparation and experimental setup in Sect. 2 and present the determined filling fractions, tensile strengths, and surface energies in Sect. 3. These results are discussed in Sect. 4 and finally summarized in Sect. 5.
 |
Fig. 1 Images of particles used in this work taken with an electron microscope. Panel A: angular silica particles, panel B: spherical fly ash particles, and panel C: spherical water ice particles at the same scale are shown. |
2 Methods
2.1 Sample preparation
We conducted three series of experiments with samples that were composed of two of three materials in varying mixing ratios. The first mixture comprised water ice spherules and angular silica (icy spherical-angular mixture), the second comprised water ice spherules and fly ash (icy spherical-spherical mixture), and the third mixture included fly ash and silica (dry spherical-angular mixture). We used these mixtures to test the dependence of the tensile strength on the ice content of the mixture and the shape of the involvedparticles. We picked these three materials to simulate the different components of a comet. Silica or fly ash represent the siliceousdust content of a comet and the water ice represents its volatile component. Furthermore, with angular silicaand spherical fly ash we were able to study the influence of different particle shapes on the tensile strength. All three components (silica, fly ash, and water ice) had a comparable average grain size (Fig. 1, Table 1). Notably, the grain size distribution of fly ash is wider than that of silica (Fig. 2).
In order to investigate the tensile strength of ice-dust mixtures, we used silica and fly ash as the dusty component of a cometary regolith and combined these in two-component mixtures with water ice. The first dusty component was silica with polydisperse particles of highly angular shape and with the physical and chemical properties shown in Table 1. The second dusty component was fly ash with polydisperse particles of approximately spherical shape. This material is a mixture of mostly SiO2 and Al2O3 (Table 1). To constrain the particle size distribution, the fly ash was sieved to a maximum particle diameter of 25 μm. Another advantage of fly ash is that it is inexpensive and available in large quantities. It must be noted that fly ash may contain minor amounts of magnetic components. These magnetic particles are not spherical and, at more than 25 μm, much larger than the majority of the fly ash particles. Before our experiments started, these components were largely removed by sieving and remained in negligible quantities in the samples. Electron microscopic comparisons of non-sieved and sieved fly ash confirmed the removal of these particles. Furthermore, the samples were not exposed to strong electromagnetic fields during the experiment, which could have an influence on the fracture behavior of the samples. Therefore, we neglected potential magnetic behavior of these particles in our analysis. The volatile component was water ice with particles of spherical shape. To produce the water ice particles, mist from a water droplet dispenser was sprayed into a Dewar vessel filled with liquid nitrogen (Gundlach et al. 2018a). The water droplets instantaneously froze and sank to the bottom of the liquid. The result was a suspension of polydisperse spherical ice particles in liquid nitrogen.
To determine the amount of water ice in the Dewar vessel we used Archimedes’ principle. We measured the weight of a certain volume of pure liquid nitrogen and the weight of the same volume of liquid nitrogen with suspended water ice. The weight difference between both measurements and the known density of liquid nitrogen and water ice allowed us to calculate the mass of water ice in the Dewar vessel. The amount of the used dust was directly measured with a scale.
The usage of liquid nitrogen as a coolant also simulated the required temperature conditions of a comet (Kührt 1984) and prevented sintering of the ice particles (Kuroiwa 1961; Thomas et al. 1994; Gundlach et al. 2018b) in the samples and the experimental setup. Otherwise, sintered ice particles would result in unrealistically high values for the tensile strength.
To produce the icy spherical-angular and the icy spherical-spherical mixtures predefined amounts of either silica or fly ash were added into the Dewar vessel filled with liquid nitrogen and the known amount of water ice spherules. To get the exact mixing ratios, the amounts of used silica and fly ash were measured with a scale. The two types of particles and the liquid nitrogen were mixed manually with a ladle until all particles were in suspension. We then immediately removed material with the ladle from the Dewar vessel and filled it into the cylindrical steel mold while the particles were still in suspension. Given the difficulties in preparation and the fragility of the material involved this is the currently best method to mix the particles sufficiently well. The dry spherical-angular mixture was also prepared in liquid nitrogen to maintain consistency during sample preparation and the experiment.
The mixtures of particles and liquid nitrogen were then filled into a precooled steel mold with an inner diameter of 26 mm. After the evaporation of the liquid nitrogen, cylindrical samples were pressed by manually pushing a stamp down onto the material. Tomaintain consistency, a lid was placed over the stamp and the experimenter pressed onto the lid with his full body weight for 5 s. Given that the weight of the experimenter was constant over the experiment series time frame, this method allowed for a reliable and reproducible implementation of 1.2 MPa to the cylindric sample. However, to reflect variations in weight due to clothing andother natural fluctuations, we assumed an error of 0.05 MPa. At the end of the preparation process, and while still inside the mold, the length and mass of each sample were determined to calculate the filling fraction. The cylindrical samples were subsequently used to measure the tensile strength of the mixtures with the Brazilian disk test (details next section).
Characteristics and chemical composition of individual components mixed to simulate cometary materials.
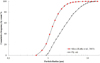 |
Fig. 2 Cumulative size distributions of dust particles. Irregularly shaped silica particles are indicated as red diamonds and spherical fly ash particles as gray dots. The grain size distribution of fly ash is wider than that of silica. |
2.2 Brazilian disk test
Initially, the atmosphere in a precooled polystyrene box was replaced by the evaporation of liquid nitrogen to provide minimal air humidity during the measurement. The samples produced in Sect. 2.1 were horizontally placed in this polystyrene box while still in the cylindrical pressing mold. Then the detachable pressing mold was removed so that the now free sample rested on a sample holder inside the polystyrene box (Fig. 3A). A metal box (cooling shield) was placed around the sample on its holder to keep it at constantly low temperatures. To ensure this, the sample holder and cooling shield were stored in liquid nitrogen and placed inside the polystyrene box directly before the measurement. Thermocouple sensors monitored the temperatures of the sample holder, cooling shield, and atmosphere inside the cooling shield and ensured constant low temperatures of less than 150 K. This temperature is necessary to prevent sintering of the water ice particles before and during the measurement (Kuroiwa 1961; Gundlach et al. 2018a,b). The cooling shield also reduced the formation of frost on the sample surface from atmospheric moisture that could penetrate the box during the measurement. A camera was installed in front of the sample to record the experimental process.
Through a narrow slit in the cooling shield, an actively cooled piston (1 × 30 mm) was used to apply pressure on the full length of the cylindrical surface of the horizontal sample (Fig. 3A). The pressure was continuously increased by lowering the piston with a motor that descends at a constant speed of 0.05 mm s−1. The polystyrene box with the entire precooled experimental setup inside was placed on a scale to record the weight and thus the exerted force. The increasing force transforms into a stress on the sample. The stress at which the sample broke longitudinally in two similar sized half-cylinders was determined (Figs. 3B and 4) and reflects the tensile strength σ of the sample material by
 (1)
(1)
In this equation, F is the force applied to the cylindrical sample in the moment of breakup, D is the sample diameter of 26 mm, and L the length of the sample, which slightly varied for each sample with an average of 25 mm. Simultaneously, images of the samples and evolving cracks were taken with the camera (Fig. 3B) for visual reference of the quality of each individual experiment. As a consequence of the low strength of the involved materials and the challenges arising when handling equipment cooled with liquid nitrogen, this method is very delicate and requires practice; therefore not every experiment resulted in a satisfying measurement. Only samples that showed a clear and central break along their longitudinal axis were used for the analyses (Fig. 3).
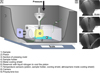 |
Fig. 3 (A) Schematic and not to scale diagram of the Brazilian disk test. The sample (yellow) rests on a section of the mold in a sample holder and is surrounded by a metal cooling shield. These parts were kept in liquid nitrogen until the moment of measurement. A narrow piston descends onto the sample and generates a crack when the force is sufficient. The corresponding mass to the force is measured by a scale. (B) An image series to illustrate the sample size and the crack evolution in a sample. |
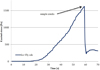 |
Fig. 4 Example of a typical pressure curve for a water ice-fly ash mixture in the volume ratio 1:1. The descent of the piston increases the stress on the sample and weight on the scale. The tensile strength is the maximum stress reached at the moment when the sample breaks. |
3 Results
3.1 Filling fraction
The mass and volume of the samples were measured to determine the bulk density of the samples before applying the above-described Brazilian disk test on the samples. With the known densities of the dust and ice particles, the filling fraction Φ of the samples was calculated by dividing bulk density by particle densities. We determined the average filling fraction of the individual components (water ice, silica, and fly ash) and of their two-component mixtures in various ratios.
Samples made of pure spherical water ice particles had an average filling fraction of Φ = 0.74, which means that 74% of the space is filled with ice particles (Fig. 5). For different icy spherical–spherical mixtures (water ice and fly ash) the average filling fraction varied as the proportion of fly ash was increased, but a clear trend could not be observed (Sect. 4.1). The average filling fraction for pure fly ash was Φ = 0.84. For different icy spherical-angular mixtures (water ice and silica) the filling fraction decreased significantly when the proportion of silica exceeded 25 vol%. With higher silica content the pore space between the particles increased up to a filling fraction of Φ = 0.43 for pure silica dust (Sect. 4.1).
To investigate the influence of particle shape on the filling fraction, we prepared dry spherical-angular mixtures including silica and fly ash without any ice. In this case the filling fraction dropped monotonously from the value of pure fly ash to the value of pure silica (Fig. 6).
 |
Fig. 5 Filling fractions of different ice-dust mixtures with varying amounts of ice. The value for pure ice is shown at 0 vol% on the left and for pure dust at 100 vol% on the right. The error of the ice-dust mixing ratio stems from the uncertainty of the ice mass determination. Spherical water ice particles mixed with spherical fly ash particles are shown as blue circles and mixtures containing angular silica particles as red squares. The number of investigated proportions is different for the two types of mixtures. |
 |
Fig. 6 Filling fractions of angular silica particles mixed with varying amounts of spherical ice particles (red squares) and spherical flyash particles (gray diamonds). The values for pure spherical particles are shown at 0 vol% on the left and for pure angular silica particles at 100 vol% on the right. The number of investigated proportions is different for the two types of mixtures. |
3.2 Tensile strength
For each cylindrical sample used in the Brazilian disk test, we recorded the load exerted by the slowly sinking piston onto the disk. The measured weight rose as the piston contacted the sample and dropped abruptly at the moment the samples cracked (Fig. 4). Equation (1) was used to calculate the tensile strength from the measured maximum force at the moment of breakup (Figs. 3 and 4). For each mixing ratio of ice and dust approximately nine individual measurements were analyzed and averaged. First, the tensile strength of pure ice samples was determined to be σ = 1800 Pa (Fig. 7). The addition of only 10 vol% angular silica to the ice resulted in an increase of the tensile strength to σ = 5400 Pa. With a further increase of the angular silica content the tensile strength increased slowly to σ = 7300 Pa, which is the value of pure angular silica.
The same procedure was repeated for ice-fly ash mixtures. With increasing proportions of spherical fly ash the tensile strength of the samples decreased slightly. At a fly ash content of more than 80 vol% the tensile strength started to decrease significantly and reached its minimum at σ = 140 Pa for pure spherical fly ash.
A comparison of pure components with their mixtures shows that the tensile strength of mixtures is dominated by the component with the higher tensile strength. The tensile strength of the whole mixture starts to decrease when the proportion of the component with the lower tensile strength exceeds 80–85 vol%. Then, the tensile strength of the mixture decreases to the value of the component with the lower tensile strength.
To analyze the influence of the particle shape on the tensile strength, we conducted Brazilian disk tests with dry mixtures of angular silica and spherical fly ash. In contrast to samples with water ice, the tensile strength of dry samples increases steadily toward the value of pure silica with increasing amounts of angular particles (Fig. 8). The angular silica component in the dry spherical-angular mixture has a less dominant effect on the tensile strength compared to the icy spherical-angular mixture. The tensile strength of the dry mixture increases consistently above 25 vol% silica in the mixture. This increase spans over wider range of mixing ratios compared to the icy silica mixture for which the tensile strength increases abruptly at 10% silica content.
 |
Fig. 7 Tensile strength σ of different ice-dust mixtures. The value for pure ice is shown at 0 vol% on the left and for pure dust at 100 vol% on the right. Mixtures of spherical water ice particles and spherical fly ash particles are represented as blue circles and mixtures containing angular silica particles as red squares. The number of investigated proportions is different for the two types of mixtures. |
 |
Fig. 8 Tensile strength σ of spherical particles mixed with angular particles. The tensile strength values for pure spherical particles are shown at 0 vol% on the left and for pure angular silica particles at 100 vol% on the right. The number of investigated proportions is different for the two types of mixtures. |
3.3 Surface energy
Assuming that during the Brazilian disk test in the moment of crack formation all cohesive bonds between the particles break simultaneously, the upper limit of the tensile strength σ can be calculated with the formula of Blum et al. (2006) as follows:
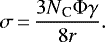 (2)
(2)
This equation is derived from the JKR theory (Johnson et al. 1971) and used to calculate the specific surface energy γ of the sample material. The quantity Φ is the filling fraction (Sect. 3.1) and r is the particle radius. We used the average particle radius as our mixtures were polydisperse. The coordination number NC is the average number of contacts per particle. Following Murphy (1982), Yang et al. (2000), and Gundlach et al. (2018a), a value between 5 and 7 is reasonable and thus we adopted the value of 6 in this equation. Accordingly, the endmembers of 1 and 12 contacts perparticle would result in a sixth and twice the tensile strength value, respectively. The exact coordination number is of minor importance in this equation, since a variation between 5 and 7 has little influence on the calculated trend of the surface energy.
For samples composed of pure water ice and temperatures below 150 K the surface energy was calculated to be γ = 0.0026 J m−2. In the icy spherical-spherical mixture including fly ash and water ice, the surface energy does not change considerably with increasing proportions of fly ash at low fly ash proportions. When the proportion of fly ash exceeds 80 vol%, γ decreases and reached very low values of γ = 0.00019 J m−2 for pure fly ash (Fig. 9).
When angular silica is added to the water ice the surface energy increases rapidly to the value of pure angular silica. The calculated surface energy of pure angular silica is γ = 0.0094 J m−2 and thus higher compared to water ice and fly ash in particular (Figs. 9 and 10). Because of the direct dependence on the tensile strength, the trend of the surface energy at varying mixing ratios is very similar.
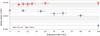 |
Fig. 9 Surface energy γ of different ice-dust mixtures. The value for pure ice is shown at 0 vol% on the left and for pure dust at 100 vol% on the right. Mixtures of water ice particles and spherical fly ash particles are indicated as blue circles and mixtures containing angular silica particles as red squares. The number of investigated proportions is different for the two types of mixtures. |
 |
Fig. 10 Surface energy γ of different spherical particles mixed with angular particles. The values for pure spherical particles (fly ash indicated as gray diamonds and water ice indicated red squares) are shown at 0 vol% on the left and for pure angular silica particles at 100 vol%on the right. The number of investigated proportions is different for the two types of mixtures. |
4 Discussion
4.1 Filling fraction
As observed in experiments by Omura & Nakamura (2017), our samples of primary angular particles trend toward having a lower filling fraction compared to those of spherical particles (Figs. 5 and 6). Rogers & Head (1961) found that the more irregular polydisperse particles are, the lower the filling fraction of a sample. Since the silica used consists of the most irregular grains of the three compounds (Table 1), the lower filling fraction of silica-rich samples canbe explained. This may be caused by increased interparticle friction between angular particles. The angular shape of silica particles may cause restricted rotation and translation against each other. In contrast, the spherical fly ash particles are more mobile than silica particles and can roll into voids upon exerted pressure (Heim et al. 1999; Schellart 2000). As the proportion of angular silica particles in the mixtures exceeds 20 vol%, more of these particles contact each other and interlock without rearranging. Consequently, the space between particles is less effectively filled and the filling fraction decreases. In contrast to angular-spherical mixtures the filling fraction of spherical-spherical mixtures remained rather stable for all mixing ratios. The filing fraction varied around 0.8 with a deviation of 0.07 in all analyzed spherical–spherical mixing ratios (Fig. 5). In these samples, the size and shape of the two particle types were very similar and so were the filling fractions of their mixtures. Therefore, the arrangement of the particles was similar in all samples. The variations of the filling fraction of the spherical-spherical samples may be the result of the sample preparation procedure. Despite all the care taken, it cannot be ruled out for all series of measurements that minor variations occurred in the pressure applied to press the disk. This uncertainty was reduced by standardizing the sample preparation and by repeating the measurement many times. However, since the pressing of the disk was done manually, some variations are unavoidable.
4.2 Tensile strength
The tensile strength of samples mixed of two different components does not change linearly with the proportions of the components. The component with the higher tensile strength dominated the tensile strength of the whole sample until its proportion was significantly lower than that of the material with lower tensile strength. In our icy spherical-angular experimental series the silica (σ = 7300 Pa) had a higher tensile strength compared to water ice (σ = 1800 Pa). In this series the angular silica particles determined the tensile strength of the sample when its content exceeded 15 vol% mixed with spherical water ice particles (Fig. 7). On the other hand, in the icy spherical–spherical series, the tensile strength of water ice was higher than that of fly ash. In this case, water ice dominated the tensile strength of the sample until its proportion decreased below 20 vol%. We explain this threshold of about 15–20 vol% that too few particles with high surface energy are present and do not connect to each other directly. Starting from a pure ice sample, a critical number of dust particles is required to cause a significant change in tensile strength. This number depends on the coordination number and the particle shape. Powell (1979) has shown that this value is 18 vol% for monodisperse spheres in random packing, which is in good agreement with our measurements. This observation is described by the percolation theory and the minimum of particles that must be added to achieve an effect is called critical volume fraction. When the concentration of high surface energy particles is above this critical volume fraction, these particles dominate the cohesion of the whole mixture and the surface energy on the microscopic scale translates into a high tensile strength on the macroscopic scale. If the concentration of particles with high surface energy is lower, the cohesion quickly decreases to the value of the component with the lower surface energy.
The tensile strength of samples containing angular silica particles is significantly higher compared to those samples that mainly consist of spherical particles. In Sect. 4.1 we described that an increasing content of angular particles corresponds to a decreased filling fraction of a sample. A lower filling fraction results in a lower number of mutual particle contacts and should lead to lower cohesive forces (Blum et al. 2006). However, this effect could be superimposed by the smaller size of silica particles, which are only about half as large as fly ash and ice particles (Fig. 2; Table 1). Despite the lower filling fraction, there are more silica particles per sample volume and thus more particle-particle bonds. This would increase the tensile stress of a sample (Sánchez & Scheeres 2014). Additionally, interlocking and higher friction due to increased tensile or shear forces between angular particles (Schellart 2000) may increase the tensile strength of silica-rich samples. Therefore, both the particle size and shape may be attributed to the higher tensile strength of materials rich in angular silica particles. With our experimental setup we can determine the sum of these effects. However, it is not suitable for the quantitative determination of these individual effects. This is not necessary either because we want to find out which easy to obtain material is better suited to produce comet analog material with the lowest possible tensile strength.
4.3 Surface energy
In the past, multiple laboratory experiments with different approaches and environmental conditions have been performed to determine the surface energy of silica (Kimura et al. 2015). It has been shown that the surface energy of silica at elevated temperatures (e.g., Fournel et al. 2012; Li 2013) tends to be about one order of magnitude higher than at room temperature (e.g., Heim et al. 1999; Leroch & Wendland 2012). Our results show that this trend continues for low temperatures. Below 150 K our silica-rich samples show a surface energy of γ = 0.0094 J m−2 that is almost one order of magnitude lower compared to values at room temperature (e.g., Kimura et al. 2015). However, our found surface energy is probably too high as a result of friction between the angular particles that may interlock. The particles can only be separated by the effort of an additional force that could be interpreted as increased geometric cohesion.
The flyash, on the other hand, which consists of about 60% SiO2, has a surface energy of γ = 0.00019 J m−2 at 150 K. Thisvalue for the surface energy of cooled spherical fly ash is about two orders of magnitude lower than in experiments performed with uncooled samples of pure silica (Kimura et al. 2015; Gundlach et al. 2018a). It is unlikely that same types of intermolecular forces lead to strongly different surface energies of silica and fly ash, since their chemical composition is about 60% identical (Table 1). This would be further indication that the determined surface energy of angular silica is too high.
The surface energy of water ice follows the same decreasing trend. It drops significantly from γ = 0.065 J m−2 for samples below freezing point (Ketcham & Hobbs 1969) to γ = 0.0026 J m−2 below 150 K in our experiments. This value was also found by Musiolik & Wurm (2019). With such low surface energy values at low temperatures it is possible to provide water ice-fly ash mixtures as cometary analogs whose tensile strength is well below the tensile strength of uncooled analog materials (Gundlach et al. 2018a; Steinpilz et al. 2019; Bischoff et al. 2020).
4.4 Possible error sources
It should be noted that Eq. (2) is derived from JKR theory (Johnson et al. 1971), which is only valid for spherical particles. Angular silica particles are a more complex material, in which the edges of the particles can be assumed to be particles with very small radii of curvature and their flat sides correspond to very large radii of curvatures. Therefore, the distribution of effective particle sizes derived from the radii of curvature in an angular granular medium varies significantly. This assumed average grain size may result in errors in the derived surface energy.
During the experiments, the samples were cooled down to temperatures <150 K, which prevented sintering of water ice particles (Kuroiwa 1961). As a result, an increase of the tensile strength of the sample material by sinter necks between water ice particles could be avoided. Therefore, the strength of the samples was determined by the cohesion of directly neighboring particles and the particle shape. However, partial sintering of the sample surface cannot be completely ruled out. Air humidity may penetrate into the cooled polystyrene box, reach under the cooling shield, and may have crystallized on the surface of the samples. This would create a stiff connection between individual particles at the disk surface. However, this process probably had only a negligible influence on the measurement. The measurement of the tensile strength lasted only two to three minutes andto avoid atmospheric moisture the atmosphere in the polystyrene box was made up of evaporated liquid nitrogen. Therefore, the nitrogen atmosphere in the box was colder and heavier than air and did not readily mix with it.
Another factor that could influence the results of the tensile strength measurements is the hydrophilicity of amorphous silica. Air humidity could reach the used silica dust before the sample preparation and probably accumulated on its surface. The bonding of water molecules or silanol groups on the particle surface would be the consequence and could decrease the surface energy of the individual particles (Steinpilz et al. 2019). With an increased availability of moisture, a thin layer of water could form arounddust particles. Cooled down, this water would freeze and the particles would be indistinguishable from water ice particles in terms of surface energy and tensile strength. To avoid this effect the silica used in our experiments was always stored in tightly closed containers, which were only opened briefly for gaining sample components. However, the formation of silanol groups on the particle surfaces cannot be ruled out completely. No measurements however give any hint of this effect, especially since we observed an significantly increased tensile strength of silica-rich samples compared to fly ash-rich samples. Even if the tensile strength would be reduced by the hydrophilicity of silica, it is still much higher than that of samples with fly ash and therefore less suitable to produce samples with low tensile strength.
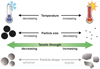 |
Fig. 11 Schematic overview of parameters affecting the tensile strength of granular matter in our experiments. Higher temperatures and smaller particle sizes increase the tensile strength of a material. A dependence of the tensile strength on the grainshape can be assumed, but cannot be determined with our measurements. |
5 Conclusions
We conducted three series of Brazilian disk test measurements to analyze the tensile strength of samples composed of different cometary analog materials. For this we combined two of the three components: spherical water ice, spherical fly ash particles, or angular silica particles at sizes of few microns. We cooled these materials to temperatures below 150 K. The samples of these series were combinations of (a) icy spherical-angular particles, (b) icy spherical-spherical particles, and (c) dry spherical-angular particles. We conclude that below 150 K the tensile strength and the derived surface energy of silica, fly ash, and water ice mixtures are generally much lower than at room temperature (Kimura et al. 2015; Gundlach et al. 2018a).
At temperatures below 150 K the tensile strength of the sample mixtures was strongly dependent on the amount of ice mixed within the sample and on the particle geometry (Fig. 11). We suspect that the friction between angular particles increases, but we cannot quantify this effect with our experiment. This and the mean grain radius of 1.3 μm of pure silica particles lead to the tensile strength of σ = 7300 Pa at a filling fraction of Φ = 0.43. A direct calculation of the surface energy with JKR based Eq. (2) was not feasible in this case, since the particles were not spherical and the friction between particles may distort the tensile strength of the sample. Therefore, the surface energy values for angular silica particles (Figs. 9 and 10) must be interpreted with caution and could be too high.
The second dust component was fly ash, which consists of about 60% SiO2 and is composed of spherical particles with a mean radius of r = 2.43 μm (Table 1). Our samples of pure cooled fly ash have a filling fraction of Φ = 0.84 and a low tensile strength of σ = 140 Pa. That corresponds to a surface energy of γ = 0.00019 J m−2 and is about two orders of magnitude smaller than pure silica at room temperature (e.g., Kimura et al. 2015). In the samples, which are mainly composed of spherical particles, these particles can easily pass each other by rolling. Hence, the surface energy of the material can be calculated more directly from the tensile strength with Eq. (2).
The properties of pure water ice samples were determined to σ = 1800 Pa and γ = 0.0026 J m−2 at 150 K. These values for tensile strength and surface energy are significantly higher compared to values of fly ash particles. Owing to their spherical shape the ice particles were also not affected by interlocking. Therefore, the tensile strength of the samples was used to calculate the surface energy of water ice.
When two of the three analog materials were mixed, the component with the higher tensile strength dominated the tensile strength of the whole sample. As soon as the abundance of the material with the lower surface energy exceeds 80 vol%, the tensile strength of the mixture decreases quickly toward the value of the component with this lower tensile strength (Fig. 7). At that mixing ratio, there are too few direct connections between particles with higher attractive interparticle forces to significantly increase the tensile strength of the whole sample.
Our experiments showed that fly ash can be used as suitable analog material for cometary dust in the laboratory. As a consequenceof the very low surface energy of fly ash, samples with a tensile strength of few hundred Pascals and less can be easily produced. This is in the range of the tensile strength of cometary material, as estimated for comet 67P/Churyumov-Gerasimenko (Groussin et al. 2015; Attree et al. 2018). In contrast to angular silica particles, the spherical shape of the fly ash and water ice particles prevents interlocking. This significantly reduces the friction between the particles so that cohesion remains the dominant force between single particles. Therefore, the spherical shape of fly ash and water ice particles in the laboratory is advantageous to produce samples with very low tensile strength. If more than 20 vol% water ice is mixed as a volatile material to fly ash, the tensile strength increases rapidly to the value of pure water ice. Assuming that comets can be described as icy dirt balls (Keller 1989; Pätzold et al. 2016), this effect can be reduced when the ice content in the samples is kept low. The result is a mixture whose tensile strength is still a few hundred Pascals and would be a good analog material for comets in the laboratory.
In the laboratory the small particle diameter of a few microns increases the cohesion of the samples, which exceeds the influence of gravity (Bischoff et al. 2019). We used the ratios of these cohesive and gravitational force in the laboratory and on 67P/Churyumov-Gerasimenko (Bischoff et al. 2019) to estimate the particle size on a comet we are able to simulate with our micron-sized particles in the laboratory. We found that centimeter-sized aggregates (Güttler et al. 2010, 2019; Blum et al. 2014)in the gravitational field of a comet can be scaled down to few micron-sized particles in the laboratory (Scheeres et al. 2010; Durda et al. 2014).
Acknowledgements
This work was carried out in the framework of the CoPhyLab project funded by the D-A-CH programme (GU 1620/3-1 and BL 298/26-1/SNF 200021E 177964 / FWF I 3730-N36). The research project “The Physics of Volatile-Related Morphologies on Asteroids and Comets” is funded by the DLR Management Board Young Research Group Leader Programme and the Executive Board Member for Space Research and Technology. We gratefully acknowledge their financial support and endorsement. Many thanks to I. Büttner from DLR Berlin for sieving the fly ash, to U. Altenberger from the University of Potsdam forproviding SEM images of fly ash and silica and to M. Neuhaus for providing images of ice particles.
References
- Attree, N., Groussin, O., Jorda, L., et al. 2018, A&A, 611, A33 [NASA ADS] [CrossRef] [EDP Sciences] [Google Scholar]
- Bischoff, D., Gundlach, B., Neuhaus, M., & Blum, J. 2019, MNRAS, 483, 1202 [NASA ADS] [CrossRef] [Google Scholar]
- Bischoff, D., Kreuzig, C., Haack, D., Gundlach, B., & Blum, J. 2020, MNRAS, 497, 2517 [CrossRef] [Google Scholar]
- Blum, J., Schrapler, R., Davidsson, B. J. R., & Trigo-Rodriguez, J. M. 2006, ApJ, 652, 1768–81 [NASA ADS] [CrossRef] [Google Scholar]
- Blum, J., Gundlach, B., Mühle, S., & Trigo-Rodriguez, J. M. 2014, Icarus, 235, 156 [NASA ADS] [CrossRef] [Google Scholar]
- Durda, D. D., Sanchez, P., Fischer, A., et al. 2014, Lunar Planet. Sci. Conf., 45 [Google Scholar]
- El-Maarry, M. R., Thomas, N., Gracia-Berná, A., et al. 2015, Geophys. Res. Lett., 42, 2015GL064500 [NASA ADS] [CrossRef] [Google Scholar]
- El-Maarry, M. R., Groussin, O., Keller, H. U., et al. 2019, Space Sci. Rev., 215, 36 [CrossRef] [Google Scholar]
- Fournel, F., Continni, L., Morales, C., et al. 2012, J. Appl. Phys., 111, 104907 [CrossRef] [Google Scholar]
- Grün, E., Bar-Nun, A., Benkhoff, J., et al. 1989, IAU Colloquium, 116, 277 [Google Scholar]
- Grün, E., Gebhard, J., Bar-Nun, A., et al. 1993, J. Geophys. Res. Planets, 98, 15091 [NASA ADS] [CrossRef] [Google Scholar]
- Groussin, O., Jorda, L., Auger, A.-T., et al. 2015, A&A, 583, A32 [NASA ADS] [CrossRef] [EDP Sciences] [Google Scholar]
- Güttler, C., Blum, J., Zsom, A., Ormel, C. W., & Dullemond, C. P. 2010, A&A, 513, A56 [NASA ADS] [CrossRef] [EDP Sciences] [Google Scholar]
- Güttler, C., Mannel, T., Rotundi, A., et al. 2019, A&A, 630, A24 [NASA ADS] [CrossRef] [EDP Sciences] [Google Scholar]
- Gundlach, B., Blum, J., Keller, H. U., & Skorov, Y. V. 2015, A&A, 583, A12 [NASA ADS] [CrossRef] [EDP Sciences] [Google Scholar]
- Gundlach, B., Ratte, J., Blum, J., Oesert, J., & Gorb, S. N. 2018a, MNRAS, 479, 5272 [NASA ADS] [CrossRef] [Google Scholar]
- Gundlach, B., Schmidt, K. P., Kreuzig, C., et al. 2018b, MNRAS, 479, 1273 [NASA ADS] [CrossRef] [Google Scholar]
- Heim, L.-O., Blum, J., Preuss, M., & Butt, H.-J. 1999, Phys. Rev. Lett., 83, 3328 [NASA ADS] [CrossRef] [Google Scholar]
- Johnson, K. L., Kendall, K., Roberts, A. D., & Tabor, D. 1971, Proc. R. Soc. London A Math. Phys. Sci., 324, 301 [Google Scholar]
- Kappel, D., Sachse, M., Haack, D., & Otto, K. A. 2020, A&A, 641, A19 [CrossRef] [EDP Sciences] [Google Scholar]
- Kaufmann, E., & Hagermann, A. 2018, Icarus, 311, 105 [NASA ADS] [CrossRef] [Google Scholar]
- Keller, H. U. 1989, ESA SP, 302, 39 [Google Scholar]
- Keller, H. U., Mottola, S., Hviid, S. F., et al. 2017, MNRAS, 469, S357 [CrossRef] [Google Scholar]
- Ketcham, W. M., & Hobbs, P. V. 1969, Phil. Mag. J. Theor. Exp. Appl. Phys., 19, 1161 [Google Scholar]
- Kührt, E. 1984, Icarus, 60, 512 [NASA ADS] [CrossRef] [Google Scholar]
- Kührt, E., & Keller, H. U. 1994, Icarus, 109, 121 [NASA ADS] [CrossRef] [Google Scholar]
- Kimura, H., Wada, K., Senshu, H., & Kobayashi, H. 2015, ApJ, 812, 67 [NASA ADS] [CrossRef] [Google Scholar]
- Kothe, S., Blum, J., Weidling, R., & Güttler, C. 2013, Icarus, 225, 75 [NASA ADS] [CrossRef] [Google Scholar]
- Kuroiwa, D. 1961, Tellus, 13, 252 [CrossRef] [Google Scholar]
- Leroch, S., & Wendland, M. 2012, J. Phys. Chem. C, 116, 26247 [CrossRef] [Google Scholar]
- Li, D.-l. 2013, J. Zhejiang Univ. Sci. C, 14, 244 [CrossRef] [Google Scholar]
- Li, D., & Wong, L. N. Y. 2013, Rock Mech. Rock Eng., 46, 269 [CrossRef] [Google Scholar]
- Lämmerzahl, P., Gebhard, J., Grün, E., & Klees, G. 1995, Planet. Space Sci., 43, 363 [NASA ADS] [CrossRef] [Google Scholar]
- Meisner, T., Wurm, G., & Teiser, J. 2012, A&A, 544, A138 [NASA ADS] [CrossRef] [EDP Sciences] [Google Scholar]
- Murphy, W. F. 1982, PhD thesis, Stanford University, USA [Google Scholar]
- Musiolik, G., & Wurm, G. 2019, ApJ, 873, 58 [NASA ADS] [CrossRef] [Google Scholar]
- Omura, T., & Nakamura, A. M. 2017, Planet. Space Sci., 149, 14 [CrossRef] [Google Scholar]
- Pajola, M., Oklay, N., Forgia, F. L., et al. 2016, A&A, 592, A69 [NASA ADS] [CrossRef] [EDP Sciences] [Google Scholar]
- Pätzold, M., Andert, T., Hahn, M., et al. 2016, Nature, 530, 63 [NASA ADS] [CrossRef] [Google Scholar]
- Poch, O., Pommerol, A., Jost, B., et al. 2016a, Icarus, 266, 288 [NASA ADS] [CrossRef] [Google Scholar]
- Poch, O., Pommerol, A., Jost, B., et al. 2016b, Icarus, 267, 154 [NASA ADS] [CrossRef] [Google Scholar]
- Powell, M. J. 1979, Phys. Rev. B, 20, 4194 [CrossRef] [Google Scholar]
- Rogers, J. J. W., & Head, W. B. 1961, J. Sediment. Res., 31, 467 [Google Scholar]
- Scheeres, D., Hartzell, C., Sánchez, P., & Swift, M. 2010, Icarus, 210, 968 [NASA ADS] [CrossRef] [Google Scholar]
- Schellart, W. P. 2000, Tectonophysics, 324, 1 [CrossRef] [Google Scholar]
- Skorov, Y., & Blum, J. 2012, Icarus, 221, 1 [NASA ADS] [CrossRef] [Google Scholar]
- Sánchez, P., & Scheeres, D. J. 2014, Meteorit. Planet. Sci., 49, 788 [CrossRef] [Google Scholar]
- Steinpilz, T., Teiser, J., & Wurm, G. 2019, ApJ, 874, 60 [NASA ADS] [CrossRef] [Google Scholar]
- Thomas, H., Ratke, L., & Kochan, H. 1994, Adv. Space Res., 14, 207 [NASA ADS] [CrossRef] [Google Scholar]
- Thomas, N., Sierks, H., Barbieri, C., et al. 2015, Science, 347, aaa0440 [CrossRef] [Google Scholar]
- Vincent, J.-B., Oklay, N., Pajola, M., et al. 2016, A&A, 587, A14 [NASA ADS] [CrossRef] [EDP Sciences] [Google Scholar]
- Yang, R. Y., Zou, R. P., & Yu, A. B. 2000, Phys. Rev. E, 62, 3900 [NASA ADS] [CrossRef] [Google Scholar]
All Tables
Characteristics and chemical composition of individual components mixed to simulate cometary materials.
All Figures
|
Fig. 1 Images of particles used in this work taken with an electron microscope. Panel A: angular silica particles, panel B: spherical fly ash particles, and panel C: spherical water ice particles at the same scale are shown. |
| In the text | |
|
Fig. 2 Cumulative size distributions of dust particles. Irregularly shaped silica particles are indicated as red diamonds and spherical fly ash particles as gray dots. The grain size distribution of fly ash is wider than that of silica. |
| In the text | |
|
Fig. 3 (A) Schematic and not to scale diagram of the Brazilian disk test. The sample (yellow) rests on a section of the mold in a sample holder and is surrounded by a metal cooling shield. These parts were kept in liquid nitrogen until the moment of measurement. A narrow piston descends onto the sample and generates a crack when the force is sufficient. The corresponding mass to the force is measured by a scale. (B) An image series to illustrate the sample size and the crack evolution in a sample. |
| In the text | |
|
Fig. 4 Example of a typical pressure curve for a water ice-fly ash mixture in the volume ratio 1:1. The descent of the piston increases the stress on the sample and weight on the scale. The tensile strength is the maximum stress reached at the moment when the sample breaks. |
| In the text | |
|
Fig. 5 Filling fractions of different ice-dust mixtures with varying amounts of ice. The value for pure ice is shown at 0 vol% on the left and for pure dust at 100 vol% on the right. The error of the ice-dust mixing ratio stems from the uncertainty of the ice mass determination. Spherical water ice particles mixed with spherical fly ash particles are shown as blue circles and mixtures containing angular silica particles as red squares. The number of investigated proportions is different for the two types of mixtures. |
| In the text | |
|
Fig. 6 Filling fractions of angular silica particles mixed with varying amounts of spherical ice particles (red squares) and spherical flyash particles (gray diamonds). The values for pure spherical particles are shown at 0 vol% on the left and for pure angular silica particles at 100 vol% on the right. The number of investigated proportions is different for the two types of mixtures. |
| In the text | |
|
Fig. 7 Tensile strength σ of different ice-dust mixtures. The value for pure ice is shown at 0 vol% on the left and for pure dust at 100 vol% on the right. Mixtures of spherical water ice particles and spherical fly ash particles are represented as blue circles and mixtures containing angular silica particles as red squares. The number of investigated proportions is different for the two types of mixtures. |
| In the text | |
|
Fig. 8 Tensile strength σ of spherical particles mixed with angular particles. The tensile strength values for pure spherical particles are shown at 0 vol% on the left and for pure angular silica particles at 100 vol% on the right. The number of investigated proportions is different for the two types of mixtures. |
| In the text | |
|
Fig. 9 Surface energy γ of different ice-dust mixtures. The value for pure ice is shown at 0 vol% on the left and for pure dust at 100 vol% on the right. Mixtures of water ice particles and spherical fly ash particles are indicated as blue circles and mixtures containing angular silica particles as red squares. The number of investigated proportions is different for the two types of mixtures. |
| In the text | |
|
Fig. 10 Surface energy γ of different spherical particles mixed with angular particles. The values for pure spherical particles (fly ash indicated as gray diamonds and water ice indicated red squares) are shown at 0 vol% on the left and for pure angular silica particles at 100 vol%on the right. The number of investigated proportions is different for the two types of mixtures. |
| In the text | |
|
Fig. 11 Schematic overview of parameters affecting the tensile strength of granular matter in our experiments. Higher temperatures and smaller particle sizes increase the tensile strength of a material. A dependence of the tensile strength on the grainshape can be assumed, but cannot be determined with our measurements. |
| In the text | |
Current usage metrics show cumulative count of Article Views (full-text article views including HTML views, PDF and ePub downloads, according to the available data) and Abstracts Views on Vision4Press platform.
Data correspond to usage on the plateform after 2015. The current usage metrics is available 48-96 hours after online publication and is updated daily on week days.
Initial download of the metrics may take a while.