| Issue |
A&A
Volume 629, September 2019
|
|
|---|---|---|
| Article Number | A9 | |
| Number of page(s) | 11 | |
| Section | Extragalactic astronomy | |
| DOI | https://doi.org/10.1051/0004-6361/201935594 | |
| Published online | 23 August 2019 | |
Investigating the physical properties of galaxies in the Epoch of Reionization with MIRI/JWST spectroscopy
1
Centro de Astrobiología (CSIC-INTA), Carretera de Ajalvir, 28850 Torrejón de Ardoz, Madrid, Spain
e-mail: javier.alvarez@cab.inta-csic.es
2
Cosmic Dawn Center (DAWN), Denmark
3
Niels Bohr Institute, University of Copenhagen, Lyngbyvej 2, 2100 Copenhagen Ø, Denmark
4
Universität Heidelberg, Zentrum für Astronomie, Institut fürheoretische Astrophysik, Albert-Ueberle-Str. 2, 69120 Heidelberg, Germany
5
Centro de Astrobiología (CAB, CSIC-INTA), ESAC Campus, 28692 Villanueva de la Cañada, Madrid, Spain
6
Kapteyn Astronomical Institute, University of Groningen, PO Box 800, 9700 Groningen, The Netherlands
7
European Space Agency, 3700 San Martin Drive, Baltimore, MD 21218, USA
8
Aix Marseille Université, CNRS, LAM (Laboratoire d’Astrophysique de Marseille) UMR 7326, 13388 Marseille, France
9
DTU Space, National Space Institute, Technical University of Denmark, Elektrovej 327, 2800 Kgs. Lyngby, Denmark
10
Department of Astronomy and Oskar Klein Centre, Stockholm University, 10691 Stockholm, Sweden
11
Department of Physics & Astronomy, University of Leicester, Leicester LE1 7RH, UK
12
Leiden Observatory, Leiden University, PO Box 9513, 2300 Leiden, The Netherlands
13
Max Planck Institute for Astronomy, Königstuhl 17, 69117 Heidelberg, Germany
14
National Radio Astronomy Observatory, Pete V. Domenici Array Science Center, PO Box O, Socorro, NM 87801, USA
15
UK Astronomy Technology Centre, Royal Observatory, Black-ford Hill, Edinburgh EH9 3HJ, UK
Received:
1
April
2019
Accepted:
15
July
2019
The James Webb Space Telescope (JWST) will provide deep imaging and spectroscopy for sources at redshifts above 6, covering the entire Epoch of Reionization (EoR, 6 < z < 10), and enabling the detailed exploration of the nature of the different sources during the first 1 Gyr of the history of the Universe. The Medium Resolution Spectrograph (MRS) of the mid-IR Instrument (MIRI) will be the only instrument on board JWST able to observe the brightest optical emission lines Hα and [OIII]0.5007 μm at redshifts above 7 and 9, respectively, providing key insights into the physical properties of sources during the early phases of the EoR. This paper presents a study of the Hα fluxes predicted by state-of-the-art FIRSTLIGHT cosmological simulations for galaxies at redshifts of 6.5–10.5, and its detectability with MIRI. Deep (40 ks) spectroscopic integrations with MRS will be able to detect (signal-to-noise ratio > 5) EoR sources at redshifts above 7 with intrinsic star formation rates (SFR) of more than 2 M⊙ yr−1, and stellar masses above 4–9 × 10⁷ M⊙. These limits cover the upper end of the SFR and stellar mass distribution at those redshifts, representing ∼6% and ∼1% of the predicted FIRSTLIGHT population at the 6.5–7.5 and 7.5–8.5 redshift ranges, respectively. In addition, the paper presents realistic MRS simulated observations of the expected rest-frame optical and near-infrared spectra for some spectroscopically confirmed EoR sources recently detected by ALMA as [OIII]88 μm emitters. The MRS simulated spectra cover a wide range of low metallicities from about 0.2–0.02 Z⊙, and different [OIII]88 μm/[OIII]0.5007 μm line ratios. The simulated 10 ks MRS spectra show S/N in the range of 5–90 for Hβ, [OIII]0.4959,0.5007 μm, Hα and HeI1.083 μm emission lines of the currently highest spectroscopically confirmed EoR (lensed) source MACS1149-JD1 at a redshift of 9.11, independent of metallicity. In addition, deep 40 ksec simulated spectra of the luminous merger candidate B14-65666 at 7.15 shows the MRS capabilities of detecting, or putting strong upper limits on, the weak [NII]0.6584 μm, [SII]0.6717,0.6731 μm, and [SIII]0.9069,0.9532 μm emission lines. These observations will provide the opportunity of deriving accurate metallicities in bright EoR sources using the full range of rest-frame optical emission lines up to 1 μm. In summary, MRS will enable the detailed study of key physical properties such as internal extinction, instantaneous star formation, hardness of the ionizing continuum, and metallicity in bright (intrinsic or lensed) EoR sources.
Key words: galaxies: high-redshift / galaxies: formation / galaxies: evolution / infrared: galaxies / telescopes
© ESO 2019
1. Introduction
Deep imaging surveys with the Hubble Space Telescope (HST) have detected galaxies at very high redshifts (z > 5) in large numbers; there are hundreds of them at photometric redshifts of about 7, and about 200 candidates at redshifts of 8–10, well within the Epoch of Reionization (EoR) of the universe (Bouwens et al. 2015; Oesch et al. 2015a, 2018; Roberts-Borsani et al. 2016; Stefanon et al. 2017). The combination of HST and Spitzer deep imaging has further identified these galaxies as potential strong optical line emitters based on the flux excess in the IRAC 3.6 and 4.5 μm bands (e.g. Schaerer & de Barros 2009; Labbé et al. 2013; Stark et al. 2013; Smit et al. 2015; Bouwens et al. 2016a; Rasappu et al. 2016; Roberts-Borsani et al. 2016). The Hβ+[OIII] and the Hα lines have large equivalent widths with values of up to (rest-frame) 1000–2000 Å (e.g. Faisst et al. 2016; Mármol-Queraltó et al. 2016; Rasappu et al. 2016; Smit et al. 2016; Caputi et al. 2017; Lam et al. 2019), and a non-linear dependency with redshift (1 + z)α with α ∼ 1.8 and ∼1.3 for sources at redshifts z < 2.5 and 2.5 < z < 6, respectively (Faisst et al. 2016; Mármol-Queraltó et al. 2016).
The spectroscopic confirmation of EoR sources remains very limited. It is based mostly on the Lyα detection (Stark et al. 2017 for a recent compilation; Zitrin et al. 2015; Oesch et al. 2015b; Jung et al. 2019), which becomes very inefficient at z > 7 as only the brightest sources exhibit Lyα emission (Pentericci et al. 2011). Additionally, detection of far-infrared [CII]158 μm and [OIII]88 μm line emitters at redshifts of up to 9.11 have recently been reported with ALMA (Inoue et al. 2016; Carniani et al. 2017; Tamura et al. 2019; Hashimoto et al. 2019, 2018; Smit et al. 2018).
The subarcsec imaging and spectroscopic capabilities of the James Webb Space Telescope (JWST), combined with its broad spectral range coverage (0.6–28 μm) and its increased sensitivity of one to two orders of magnitude better than that of previous space observatories such as HST and Spitzer will provide exquisite data to investigate in detail the physical nature and properties of EoR sources at redshifts above 6. Among the JWST instruments, the Mid-infrared Instrument (MIRI) Medium Resolution Spectrograph (MRS) covering the 5–28 μm spectral range, will be the only instrument capable of detecting the strongest optical lines, Hα and [OIII]0.5007 μm at redshifts well above 6.6 and 9, respectively (Wright et al. 2015; Wells et al. 2015; and references therein). In addition, while the JWST near-infared spectrograph (NIRSpec) will be covering the UV and blue rest-frame range (Chevallard et al. 2019), the MRS extends the observed spectral range above the rest-frame [OIII] lines, and well into the 1 μm region, where internal extinction is less relevant, and other less explored lines such as [SIII]0.907,0.953 μm and HeI1.083 μm are present.
The rest-frame optical and near-IR spectral range covered by the MRS is key to developing a full understanding of the physical properties and mechanisms involved in the earliest stages in the formation of galaxies during EoR. Of the main optical diagnostic lines, the Hα is the least affected by internal extinction, and therefore the cleanest tracer of the instantaneous star formation rate (SFR; Kennicutt 1998 for review) in EoR sources, even if a measurement of internal extinction is not available. Moreover, the combination of Hα with Lyα and UV continuum measurements will provide more accurate values for the Lyα and the ionizing escaping fractions. In addition, the ratios [NII]0.6584 μm/Hα and [SII]0.6717,0.6731 μm/Hα trace the metallicity (Z) in pure star-forming galaxies (Maiolino & Mannucci 2019, for a review), and combined with the ratio [OIII]/Hβ trace the nature of the ionizing source (Kewley et al. 2013a). Several other less explored combinations of line ratios involving the [NII], [SII], and [SIII] lines become available as additional metallicity tracers (Maiolino & Mannucci 2019, and references therein). Finally, the HeI 1.083 μm, which is the strongest HeI line in the entire optical and near-IR range (Porter et al. 2005), can provide in combination with the Hα line, a measurement of the hardness of the ionizing continuum, and therefore information on the nature of the ionizing source, as the hydrogen and HeI lines are sensitive to the total amount of photons with energies above 13.6 eV (912 Å) and 24.6 eV (504 Å), respectively.
Predictions of the nebular spectra of EoR sources from state-of-the-art cosmological simulations (Barrow et al. 2017; Ceverino et al. 2019; Katz et al. 2019) are now available for a direct comparison with future JWST observations. These simulations follow the physical processes associated with the early formation and evolution of galaxies during the first 1 Gyr of the universe. These simulations predict galaxies in the early universe as strong line emitters, confirmed by the detection of Lyα and, more recently, [OIII]88 μm line emitters at redshifts ∼7–9. Therefore, the prospects of investigating the nature, evolution, and physical properties of early galaxies with the MIRI spectrograph should be explored in detail.
This paper presents a study of the detectability of FIRSTLIGHT simulated galaxies at redshifts of 6.5–10.5, and realistic MIRI/JWST spectra of the newly discovered high-z [OIII]88 μm emitters detected with ALMA. The paper is structured as follows. The most relevant features of the FIRSTLIGHT simulations and the apparent fluxes of the two strongest optical emission lines ([OIII]0.5007 μm and Hα) for FIRSLIGHT galaxies at redshifts 6.5 to 10.5 as a function of their SFR, stellar mass (M*), and specific star formation (sSFR) are presented in Sect. 2, together with a discussion of the detectability of the population of FIRSTLIGHT Hα emitters with MRS. Specific examples of MRS simulated spectra for two of the recently detected [OIII]88 μm emitters, MACS1149-JD1 (Zheng et al. 2012; Hashimoto et al. 2018) and B14-65666 (Bowler et al. 2014, 2017; Hashimoto et al. 2019) at a respective redshift of 9.11 and 7.15, are presented in Sect. 3, together with the possibilities that MRS opens for the detail studies of their physical properties, such as internal extinction, instantaneous star formation, hardness of ionizing continuum, and metallicity. A summary of the results and future work is presented in Sect. 4. Throughout this paper we use a standard cosmology with matter and dark energy density Ωm = 0.3 and ΩΛ = 0.7, the Hubble constant H0 = 70 km s−1 Mpc−1, and the AB magnitude system.
2. FIRSTLIGHT: EoR line emitters from cosmological simulations
2.1. FIRSLIGHT overview
We use the zoom-in cosmological simulations of galaxies of the FIRSTLIGHT project (Ceverino et al. 2017, 2018, 2019). Briefly, this consists of a complete mass-selected sample of 289 halos, selected at z = 5 in two cosmological boxes of 10 and 20 Mpc h−1 with halo masses between 109–1011 M⊙ (see details in Ceverino et al. 2017). The maximum spatial resolution is 10 pc. The dark matter particle mass resolution is mDM = 104 M⊙ and the minimum star particle mass is 100 M⊙.
These high-resolution simulations are performed with the ART code (Kravtsov et al. 1997; Kravtsov 2003; Ceverino et al. 2014, 2019; Ceverino & Klypin 2009). They follow the evolution of a gravitating system and the Eulerian gas hydrodynamics, and incorporate other astrophysical processes, such as gas cooling radiation, photoionization heating by the cosmological UV background, a stochastic star formation model, and a model that includes thermal, kinetic and radiative feedback (see details in Ceverino et al. 2017).
The FIRSTLIGHT database1 includes several properties for all snapshots of the main galaxy progenitor of the 289 zoom-in simulations, such as the virial, stellar and gas masses, and its SFR, in steps of 10 Myr. The database starts when the galaxy reaches the halo mass of Mvir = 109 M⊙ and ends in the last available snapshot at z ≥ 5. In general, these galaxies show non-uniform star formation histories, spending most of their time (70%) in bursts of star formation (Ceverino et al. 2018), consistent with cosmological gas accretion events. In this work, we use all snapshots within the redshift range 6.5 ≤ z ≤ 10.5. This sample is composed of 10,064 snapshots, and covers a wide range of stellar masses (∼105 − 9 M⊙), SFRs (∼0 − 30 M⊙ yr−1), and metallicities (Z = 3 × 10⁻⁵ − 8 × 10⁻³).
In addition to the physical properties mentioned above, spectral energy distributions (SEDs) are also publicly available for all these snapshots (Ceverino et al. 2019). Stellar SEDs are generated using the Binary Population and Spectral Synthesis model (BPASS: Eldridge et al. 2017) and assume a Kroupa (2001) initial mass function (IMF). The contribution of nebular emission is also available and assumes the stellar metallicity, and a gas covering factor of one with an electron density of 100 cm−3 (see Ceverino et al. 2019, for details).
2.2. MRS detectability of FIRSTLIGHT EoR line emitters
Luminosities of the two strongest optical emission lines, [OIII]0.5007 μm and Hα, are extracted for each nebular SED component and converted to observable fluxes (in units of erg s−1 cm−2) using the equation
![$$ \begin{aligned} F_{\rm obs} (\mathrm{[OIII]}, \mathrm{H}\alpha ) = \frac{L (\mathrm{[OIII]}, \mathrm{H}\alpha )}{4 \pi D_{\rm L}^2}, \end{aligned} $$](/articles/aa/full_html/2019/09/aa35594-19/aa35594-19-eq1.gif)
where DL is the luminosity distance at a given redshift for the adopted cosmology. Figure 1 shows the relation between the ratio [OIII]/Hα the Hα emission line fluxes of the simulated galaxies. The most luminous FIRSTLIGHT galaxies present similar Hα and [OIII]0.5007 μm fluxes ([OIII]0.5007 μm/Hα ≥ 1), whereas for fainter galaxies Hα tends to be brighter than [OIII]0.5007 μm ([OIII]0.5007 μm/Hα < 1), similar to the values found in metal-deficient, low-z galaxies (e.g. Izotov & Thuan 2011; Hirschauer et al. 2016; Izotov et al. 2018). We note, however, that these simulations do not include the effect of dust attenuation, although it is expected to be negligible in low-mass, low-metallicity, high-z galaxies (e.g. Hashimoto et al. 2018).
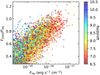 |
Fig. 1. Relation between [OIII]/Hα and Hα fluxes of the FIRSTLIGHT simulated galaxies at 6.5 < z < 10.5. The most luminous galaxies present similar Hα and [OIII] fluxes, whereas for fainter galaxies, Hα tends to be relatively brighter than [OIII], similar to the values found in metal-poor, low-z galaxies. |
Figure 2 shows the derived Hα fluxes of all snapshots of the main galaxy progenitor of the FIRSTLIGHT simulations with redshifts between 6.5 and 10.5 as a function of their SFRs, stellar masses, and specific SFRs. Overall, these galaxies show a linear relation between Hα fluxes and SFRs, as expected, since FIRSTLIGHT SFRs are computed using stellar particles younger than ∼10 Myr that produce copious amounts of ionizing photons that ionize the surrounding gas. The relation between Hα flux and stellar mass, and therefore sSFR, is nevertheless much broader due to the stochastic star formation histories in the simulations (for details, see Ceverino et al. 2018). This sample is dominated by numerous low-mass galaxies with extremely faint Hα emission for JWST spectroscopy, characterized by median values of  , 2.4, and 1.5 × 10⁻²⁰ erg s−1 cm−2 in the redshift intervals of 6.5–7.5, 7.5–8.5, and z > 8.5, respectively. However, a fraction of the galaxies show much higher fluxes of around F(Hα) ∼ 10−18 − 10−17 erg s−1 cm−2 that are accessible to observation with MIRI/JWST spectroscopy.
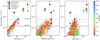 |
Fig. 2. Predicted Hα fluxes as a function of star formation rate (left), stellar mass (middle), and specific star formation rate (right) for the FIRSTLIGHT simulated galaxies at 6.5 < z < 10.5. Grey and black horizontal dashed lines mark respectively the 10σ and 5σ limits of medium deep (10 ks) and deep (40 ks) MRS spectroscopic observations. Other known z > 7 galaxies with detected [OIII] 88μm emission lines (Inoue et al. 2016; Laporte et al. 2017; Hashimoto et al. 2019, 2018; Tamura et al. 2019) are also shown with filled symbols (SFR and stellar mass measurements of A2444_YD4 SXFD-NB10006-2 have been corrected for the lower proportion of low-mass stars in the Kroupa IMF relative to the standard Salpeter assumed in Inoue et al. 2016; Laporte et al. 2017, respectively). For these galaxies, ratios of [OIII] 88μm/[OIII] 0.5007 μm = 10 and [OIII] 0.5007 μm/Hα = 1.1 are used to derive the expected Hα fluxes (vertical lines show the minimum and maximum expected Hα fluxes considering different line ratios of R[OIII] and [OIII]0.5007 μm/Hα; see text for details). For the galaxies magnified by gravitational lensing, such as MACS1149-JD1, A2744_YD4, and MACS0416_Y1, the de-magnified expected fluxes are shown as empty symbols (SFR and M* measurements refer to intrinsic values). |
In order to study the detectability of Hα in such galaxy population, we use the expected MRS limiting sensitivity curves of Glasse et al. (2015). We note that these sensitivity curves refer to point-like sources with spectrally unresolved lines. By using medium deep (10 ks) and deep (40 ks) on-source MRS spectroscopic observations we find limiting Hα fluxes of ≃5.8 × 10⁻¹⁸ erg s−1 cm−2 (10σ in 10 ks) and ≃1.4 × 10⁻¹⁸ erg s−1 cm−2 (5σ in 40 ks), respectively2. As shown in Fig. 2, this means that for the entire 6.5 < z < 10.5 FIRSTLIGHT sample, only a small fraction of about 6.2, 1.1, and 0.4% of FIRSTLIGHT galaxies in the redshift range of 6.5–7.5, 7.5–8.5, and z > 8.5, respectively, would be detected (signal-to-noise ratio S/N ≥ 5) in deep 40 ks observations. This indicates that only the most luminous FIRSTLIGHT simulated galaxies, those with star formation rates higher than 1.6, 1.9, and 3.9 M⊙ yr−1, and stellar masses higher than 4, 9, and 14 × 107 M⊙ in the redshift intervals of 6.5–7.5, 7.5–8.5, and z > 8.5, respectively, will be accessible for detailed studies with MRS spectroscopy in a moderate amount of observing time (40 ks).
It should be noted, however, that the FIRSTLIGHT simulations are limited to halo masses of a few times 1011 M⊙ within a cosmological volume of ∼2 × 10⁴ Mpc3. As shown in the middle panel of Fig. 2, this limits simulated galaxies to have stellar masses above 2 × 10⁹ M⊙. However, massive EoR galaxies have been recently detected by ALMA as [OIII]88 μm emitters (Inoue et al. 2016; Hashimoto et al. 2019; Tamura et al. 2019). These galaxies are relatively massive, M* = (2 − 5)×109 M⊙, and show very strong [OIII] 88 μm line fluxes, ≃(0.6 − 17.5)×10−18 erg s−1 cm−2. The UV-luminous, high EW[Hβ+OIII], Lyα-emitter sources (Roberts-Borsani et al. 2016; Stark et al. 2017), could also belong to the same class of EoRs. Assuming a wide range of [OIII]0.5007 μm/[OIII]88 μm (hereafter R[OIII]) and [OIII]0.5007 μm/Hα line ratios (R[OIII]=6.5 − 10 and [OIII]0.5007 μm/Hα = 0.59 − 1.93, see Table 3), these galaxies will show Hα fluxes of about (0.2 − 30)×10−17 erg s−1 cm−2 (see Fig. 2), well above the detection limits even for medium-deep (10 ks) MRS observations. On the other hand, for more typical, less luminous galaxies, the power of strong gravitational lensing may add the required boost in the apparent fluxes necessary to reach the MRS sensitivity. Therefore, high S/N optical (∼0.5–1 μm) emission line spectra will become available with MRS for the first time at such early cosmic times, providing the opportunity of characterizing several of the physical properties of these sources. An exploration of these possibilities is presented in the following section with two specific examples.
3. MIRI/JWST spectroscopy: EoR [OIII]88 μm line emitters
In the previous section we conclude that all ALMA detected [OIII]88 μm sources, and also known UV-luminous Lyman-alpha emitters (LAEs; Stark et al. 2017), in the EoR will be easily studied using the Hα emission line with a medium-deep (10 ks) and deep (40 ks) MRS observations. In the following we present realistic MRS simulated observations of the rest-frame optical and near-IR spectrum (∼0.5–1.2 μm) for two recently ALMA detected [OIII]88μm emitters, MACS1149-JD1 (Zheng et al. 2012; Hashimoto et al. 2018) and B14-65666 (Bowler et al. 2014, 2017; Hashimoto et al. 2019). MACS1149-JD1 is a lensed galaxy with a magnification factor of ∼10 at a redshift of 9.11, being the highest-z spectroscopically confirmed galaxy based on an emission line. Its derived intrinsic SFR of 4.2 M⊙ yr−1, sSFR of 4 Gyr−1, stellar mass of 1.1 × 10⁹ M⊙, and observed [OIII] 88 μm flux of 3 × 10⁻¹⁸ erg s−1 cm−2 places it within the range of Hα fluxes clearly detectable with medium-deep MRS spectroscopy. On the other hand, B14-65666 is a Lyman-break galaxy system of two sources likely interacting or merging at redshift 7.15, identified as UV bright with an absolute magnitude of MUV ∼ −22.3, which places it in the range of luminous LAEs (Roberts-Borsani et al. 2016; Stark et al. 2017). The global system has a derived SFR of 200 M⊙ yr−1, sSFR of 259 Gyr−1, stellar mass of 7.7 × 10⁸ M⊙, and [OIII] 88 μm flux of 21.8 × 10⁻¹⁸ erg s−1 cm−2. Table 1 summarizes the intrinsic properties of the two sources.
Intrinsic properties of MACS1149-JD1 and B14-65666.
3.1. Generating MRS simulated spectra
The process to build a final calibrated 1D MRS simulated spectrum has four different phases. First, a variety of spectral templates that cover the expected range of metallicities and excitation conditions of the ionized gas for galaxies in the EoR are built (Sect. 3.1.1). Second, we take advantage of the MIRI instrument simulator (MIRISim)3 to generate simulated MRS observations where the spectral template, astronomical scene, and instrumental and observational configurations are set up (Sect. 3.1.2). Third, the official JWST calibration pipeline is used to calibrate the simulated MRS observations and derive the 3D spectral cubes (Sect. 3.1.3). Finally, we extract the final 1D calibrated spectrum for each simulated MRS observation and calculate the emission line fluxes (Sect. 3.1.4).
3.1.1. Low-metallicity spectral templates
The spectral templates consist of only rest-frame optical/near-IR emission lines (i.e. no stellar continuum included), where the line ratios are based on observed spectra of low-z, low-metallicity, dwarf galaxies (Fig. 3 and Table 2). To cover the range of metallicities expected in EoR sources, three different templates are constructed according to metallicity: one low-metallicity (∼0.2 Z⊙) and two metal-poor (0.04 and 0.02 Z⊙). For the low-metallicity template (METAL_0.2_SOLAR) the emission lines are taken as the average ratios derived for a sample of well-measured, low-metallicity (0.2 Z⊙), dwarf galaxies (Izotov & Thuan 2011). For the metal-poor templates the spectra of the metal-deficient, blue compact dwarf SBS0335-052E (Izotov & Thuan 2011, METAL_0.04_SOLAR), and the lowest metallicity J0811+4130 dwarf star-forming galaxy (Izotov et al. 2018, METAL_0.02_SOLAR) are used. The selected values cover the wide range of metallicities derived for FIRSTLIGHT EoR galaxies (Ceverino et al. 2019). The spectral templates do not include any contribution from a low-luminosity active galactic nucleus (AGN). In the optical range the presence of an AGN increases the luminosity of the metallic lines relative to hydrogen, and therefore would help to detect the presence of an AGN (Kewley et al. 2013b).
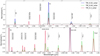 |
Fig. 3. Spectral templates used on the MRS simulated observations (see Table 2 for details). Upper panel shows the brightest optical and near-IR emission lines in the range from Hβ to Paβ. The bottom panel is a zoom-in of the dashed line rectangle shown in the upper panel, and illustrates the fainter optical and near-IR emission lines in the range from Hα to Paβ. The spectra have a line width of 154 km s−1 (FWHM) and are normalized to the peak of the [OIII]0.5007 μm emission line; the continuum is set to zero. |
Spectral templates for MRS simulations of EoR sources.
The templates are further normalized in flux using the R[OIII], and the observed [OIII]88 μm flux. The line ratios between the optical and far-infrared [OIII] lines have a well-known and strong dependency on the electron density and temperature of the ionized gas (Dinerstein et al. 1985; Keenan & Aggarwal 1990). According to these authors, the R[OIII] ratio has a value of ∼3 to ∼15 for an electron density of 100 cm−3, and electron temperatures in the (1−2) × 104 K range. For a given temperature in this range, the R([OIII]) ratio would further increase with density by factors of up to 2 for electron densities of up to 1000 cm−3.
Studies of a large representative sample of giant HII regions, nearby HII galaxies, and green peas covering the 8.5 to 7.2 (12 + log[O/H])4 metallicity range show a well-defined relation between the metallicity and the [OIII] electron temperature given by the expression (Amorín et al. 2015) 12 + log(O/H) = 9.22–0.89 ×Te ([OIII], in units of 104 K). According to this expression, the electron temperature of the [OIII] ionized gas ranges from 1.4 to 2.3 × 10⁴ K for metallicities ∼8.4 to ∼7.2 (Amorín et al. 2015). These temperatures agree well with those measured in a sample of high-ionization, metal-deficient, blue dwarf galaxies (Thuan & Izotov 2005). Blue dwarfs have [OIII] temperatures in the range of 1.3–1.4, 1.4–1.8, and 1.8–2.0 × 10⁴ K for metallicities above 8.0, between 7.5 and 7.9, and below 7.5, respectively. On the other hand, the electron density derived from the [SII] doublet line ratio has values in the 110–1310 cm−3 range, with an average of 410 cm−3. These densities are similar to those measured in some of the most metal-deficient, low-z galaxies known, such as SBS0335-052E (Izotov et al. 2009), J0811+4730 (Izotov et al. 2018), or A198691 (Hirschauer et al. 2016). In summary, the physical conditions of the [OIII] emitting gas in low-metallicity and metal-poor galaxies favour electron densities above 100 cm−3, and temperatures well above 104 K, and closer to 2 × 10⁴ K. Therefore, following the dependence of R([OIII]) with temperature and density, the spectral templates are normalized in flux with two different R([OIII]) ratios, R([OIII]) = 6.5 for the low-metallicity template (i.e. 0.2 Z⊙) and R([OIII]) = 10 for the metal-poor template (i.e. 0.04–0.02 Z⊙).
The width of the emission lines in the templates is simulated by a Gaussian with a full width at half maximum (FWHM) of the [OIII]88 μm flux measured in each galaxy (i.e. 154 km s−1 for MACS1149-JD1, and 300 and 267 km s−1 for the components of the B14-65666 system). Finally, the templates are normalized to the [OIII]0.5007 μm flux derived from the [OIII]88 μm flux, and redshifted to the corresponding observed wavelengths. Galaxies at redshifts above 6 show a steep UV continuum slope (β < −2, Bouwens et al. 2016b), in other words an optical extinction AV < 0.3 mag, and therefore no internal extinction correction is applied to the line fluxes in the templates.
Finally, the UV-brightest sources at z > 7 (Roberts-Borsani et al. 2016; Stark et al. 2017) have continuum fluxes of 0.2–0.4 μJy at 4.5 μm. The 10σ sensitivity for a 10 ks observation with the MRS Channel 1 is ∼35–55 μJy (Glasse et al. 2015), depending of the wavelength. The continuum emission is well bellow the detection limit of the MRS in the exposure time used here. Then the templates only contain the main optical and near-IR emission lines in the Hβ to Paβ spectral range without continuum emission.
3.1.2. MIRI instrument simulator: MRS raw observations
We use MIRISim (Klaassen et al., in prep.), public release 2.0.05, to perform simulated MRS observations of the EoR sources, MACS1149-JD1 and B14-65666. MIRISim is the MIRI instrument simulator able to reproduce realistic observations with the MRS and with other MIRI observational modes. It takes advantage of the full information collected during the cryogenic test and calibration campaigns of MIRI to simulate realistic point spread function (PSF), detector read noise, Poisson noise, dark current, detector non-linearity, flat-fielding, cosmic rays, fringing, and other observational and instrumental effects. MIRISim allows modelling of astronomical targets, combining SEDs and emission line information with different morphologies, and with user-provided astronomical images. It produces the raw uncalibrated data that are input into the MIRI JWST calibration pipeline to obtain the calibrated data cube.
The lensed galaxy detected at z = 9.11 with ALMA, MACS1149-JD1, presents [OIII] 88 μm observed flux of 3 × 10⁻¹⁸ erg s−1 cm−2 with a line width of 154 km s−1 (FWHM, Hashimoto et al. 2018). Its strongest optical and near-IR lines (Hβ, [OIII] 0.4959,0.5007 μm, Hα, and HeI 1.087 μm) fall in MRS Channels 1 and 26. In order to investigate their detectability as a function of metallicity and electron temperature and density, we simulate three medium-deep (10 ks) MRS observations with different spectral templates and R[OIII] ratios (see Table 3 for details). We consider MACS1149-JD1 as an unresolved source for the MRS, and located in the centre of the Channel 1 field of view. The solar activity, which is related with the frequency of cosmic rays events, and the instrument and sky backgrounds are set to low. A four-point dither pattern is used to generate the MRS observations. Each of the dither pointings consists of 35 groups, three integrations, and one exposure in SLOW read-out mode, which gives 2.5 ks of integration per pointing, for a total of 10 ks on-source integration time per MRS spectral setting7. We note that a MRS spectral setting (SHORT, MEDIUM, or LONG) covers one-third of the available wavelength range in each channel; therefore, the three different spectral settings are needed for full spectral coverage. For MACS1149-JD1 simulations, we use two spectral settings, SHORT and LONG.
Properties of the MACS1149-JD1 and B14-65666 MRS simulated templates.
The interacting or merging system at redshift of z = 7.15, B14-65666, is composed of two UV-bright sources with a projected separation of 2–4 kpc. The system presents a total integrated [OIII] 88 μm flux of 21.8 × 10⁻¹⁸ erg s−1 cm−2. We simulated a deep (40 ks) Channel 1 and 2 MRS observation to investigate the possibility of detecting Hα and other weak optical and near-IR emission lines ([NII]0.6583 μm, [SII] 0.6716,0.6731 μm, [SIII] 0.9069,0.9532 μm, Paschen series). B14-65666 is simulated combining two unresolved sources with a separation of 1″. The full extension in [OIII]88 μm is 0.84″, and the separation between clumps in rest-frame UV is around 0.5″. Since the optimal deblending of two sources in the MRS observations is beyond the scope of this paper, the separation between clumps has been increased to reduce the confusion. B14-65666_0.2_solar is simulated at a redshift of 7.153, with [OIII] 88 μm flux of 13.5 × 10⁻¹⁸ erg s−1 cm−2, R[OIII] of 6.5, and a line width of ∼325 km s−1 (FWHM). B14-65666_0.04_solar is simulated at a redshift of 7.1482, with [OIII] 88 μm flux of 8.3 × 10⁻¹⁸ erg s−1 cm−2, R[OIII] of 10, and a line width of ∼267 km s−1 (FWHM). We note that an offset in velocity between the two components has been included, as presented in Hashimoto et al. (2019). A different spectral template and R[OIII] ratio is used for each component to analyse the detectability of the lines with different metallicity and physical conditions (see Table 3). The solar activity and the instrument and sky background are set to low. An eight-point dither pattern is used to generate the MRS observations. Each of the dither pointings consists of 35 groups, three integrations, and two exposures in SLOW read-out mode, which gives 5 ks of integration per pointing, and a total of 40 ks on-source integration time per MRS spectral setting (SHORT, MEDIUM, and LONG).
Epoch of Reionization sources are expected to have sizes of less than 1 kpc (Shibuya et al. 2019), and therefore are point-like sources for the MRS PSF8; galaxies at lower redshifts would be larger in size, with a median radius of 2.2 kpc (Ribeiro et al. 2016). This would imply a dilution of the observed flux over a larger number of spaxels, and therefore would require these galaxies to be treated as extended sources with a specific light profile and clumpiness in the simulations.
Alternatively, the SED-fitting SFRs could be used to derive the Hα emission (Kennicutt 1998). MACS1149-JD1 and B14-65666 system have a intrinsic SFRs of 4.2 and 200 M⊙ yr−1 that is equivalent to observed Hα fluxes of 8 and 67 × 10−18 erg s−1 cm−2, respectively. The predicted Hα fluxes are in close agreement with the low-metallicity templates derived using the methodology presented in Sect. 3.1.1.
3.1.3. Calibration of MRS observations
The MACS1149-JD1 and B14-65666 MIRISim simulated MRS observations are calibrated with the JWST calibration pipeline (release 0.9.6)9. The pipeline is divided into three different processing stages. The first stage performs a detector-level correction, where the MRS observations are corrected for saturation, linearity, and dark current. It also applies the jump detection and ramp-fitting modules to transform the raw MRS ramps observations to slope detector products. We use a rejection threshold of 1.75σ to identify the jumps between adjacent frames and correct the cosmic ray events. The selected rejection threshold is optimized to produce the best S/N on the final calibrated spectrum. The modification of the rejection threshold from 4σ to 1.75σ produces variations of S/N in factors of ∼1.5 and ∼1.25 for Channel 1 and 2, respectively. These variations are likely to be relevant during on-orbit operations as the solar activity, and therefore changes in the density and energy of cosmic rays, could have different residual effects in the calibrated data. The second stage corrects the slope products from flat-fields and fringes, assigns the coordinate system, and produces a photometric calibration at individual exposure levels. We note that the pipeline and MIRISim use the same reference file to simulate and calibrate the effect of the fringes. It could underestimate the fringe residuals in the final MRS simulated spectra, which are expected to be lower than 2%. The third stage combines the different dither exposures to create a 3D spectral cube. The final cubes have a spatial and spectral resolution of 0.196″ × 0.196″ × 0.001 μm for Channel 1, and 0.196″ × 0.196″ × 0.002 μm for Channel 2. Figure 4 shows an example of the MRS calibrated 3D spectral cubes, and illustrates the integrated Hα map of the simulated B14-65666 system (see detailed explanations and caveats in Sect. 3.1.2).
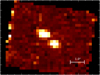 |
Fig. 4. Simulated B14-65666 system. It illustrates the integrated Hα map for a deep (40 ks) MRS observations, where two components are simulated as point-like source separated by 1″, and with metallicities of 0.2 and 0.04 Z⊙. |
3.1.4. Extraction and analysis of 1D MRS spectra
The 1D spectra are obtained by performing circular aperture photometry with a radius equal to the PSF FWHM (r ∼ 0.31″ − 0.42″ depending on the Channel). The subtracted background is obtained in an annulus from 0.78″ to 1.37″ centred in the source. An aperture correction is applied to obtain the final 1D calibrated spectra. The aperture correction is calculated by combining simulated bright point sources on MIRISim and the PSF model obtained during the test and calibration campaigns of MIRI. The aperture correction is calculated in each wavelength of the spectral cube, Channel 1 presents values from 1.59 to 1.69 and Channel 2 from 1.64 to 1.89.
The emission line fluxes are derived by fitting a single Gaussian model to the line profile. The fit is performed within a spectral range equal to 0.1 μm and 0.14 μm for Channel 1 and 2, respectively. If the defined spectral range contains more than one emission line, we use a multiple Gaussian model to simultaneously fit the different line profiles. To estimate the flux error of each emission line, we implement a Monte Carlo method. We measure the noise of the spectra as the root mean square (rms) of the residuals after subtracting the derived Gaussian profile. The noise is used to generate N (N = 3000) new spectra, where a random Gaussian noise with a sigma equal to the rms is added to the original spectrum and the lines are again fitted. The error of the measurements is obtained as the standard deviation of the N derived fluxes. Tables 4 and 5 contain the derived integrated fluxes and uncertainties for the optical and near-IR emission lines analysed in the simulated MACS1149-JD1 and B14-65666 MRS observations.
Derived emission line fluxes for the MACS1149-JD1 simulated spectra.
Derived emission line fluxes for the simulated spectra of the B14-65666 system.
The absolute fluxes of the emission lines detected with high significance (S/N > 10) are in agreement with the input values with average deviations lower than 10%10. The same emission lines, those with S/N > 10, are also used to investigate the S/N differences between the JWST exposure time calculator (ETC)11 and the MRS simulated observations based on the combination of MIRISim and JWST pipeline. The ETC provides mean S/N values of 25% and 6% lower than those derived from respectively the medium-deep (10 ks) and deep (40 ks) MRS simulated observations for Channel 1 and 2. As we note in Sect. 3.1.3, the tuning of the configuration parameters of the JWST pipeline produces variations in the S/N of the final 1D spectrum. This level of difference is expected as the ETC, MIRISim, and JWST pipelines approximate our current best knowledge and understanding of the performance of MIRI, and the remaining uncertainties associated with noise properties, cosmic ray effects, and pipeline processing are still under study, and will be revised with in orbit commissioning data.
3.2. Exploring the physical properties of EoR [OIII]88 μm line emitters
The MRS simulated 1D spectra of the [OIII]-emitters MACS1149-JD1 and B14-65666 were analysed to investigate the detectability of their main optical and near-IR emission lines, and the prospects of inferring key physical properties such as the instantaneous star formation rates, ionization, Lyα escape fractions, shape and hardness of the ionizing continuum, metallicity, among other physical properties.
3.2.1. EoR lensed sources: MACS1149-JD1
As already mentioned in Sect. 3 and Table 1, MACS1149-JD1 is a lensed galaxy recently detected in [OIII]88 μm at a redshift of 9.11. The intrinsic properties, SFR of 4.2 M⊙ yr−1, and sSFR of 4 Gyr−1 place it in the upper SFR range of FIRSTLIGHT galaxies at a redshift of 9, but at the lower end of the sSFR as the total estimated stellar mass is 1.1 × 10⁹ M⊙ (Hashimoto et al. 2018). Figure 5 shows the simulated (10 ks) MRS spectra for a MACS1149-JD1-like source using three different metallicities (0.2, 0.04, and 0.02 Z⊙) and R[OIII] values, covering the expected range of metallicities and excitation conditions in the ionized gas at a redshift of 9.11. The 1D extracted spectra containing the brightest optical emission lines (Hβ, [OIII]0.4959,0.5007 μm, Hα, and HeI1.087 μm) show the detection of all lines at a significance level higher than 4σ at different metallicities. In particular, we obtain S/N ∼ 5 − 24, 8–42, 18–90, and 5–10 for the integrated fluxes of Hβ, [OIII]0.4959,0.5007 μm, Hα, and HeI1.083 μm emission lines, respectively.
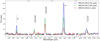 |
Fig. 5. Simulated medium-deep (10 ks) MRS observation of MACS1149-JD1 at a redshift of 9.11. It illustrates the simulated spectrum with metallicities of 0.02 Z⊙ (blue), 0.04 Z⊙ (green), and 0.2 Z⊙ (red). The main emission lines are shown as dashed lines, and their derived integrated fluxes can be found in Table 4. |
Thanks to the additional magnification factor due to lensing, the MRS spectra illustrate important results for strong [OIII] 88 μm line emitters at the highest redshifts (i.e. z > 9). First, for a given [OIII] 88 μm luminosity, the [OIII]0.5007 μm and Hα lines will be most luminous for the lowest metallicity, and therefore would be detected with the highest significance at 0.02 Z⊙. This effect is mainly due to the expected increase in the electron temperature of the ionized gas, and therefore the R[OIII] decreases with metallicity from subsolar to metal poor (see Sect. 3.1.1). Second, additional detection of the Hβ emission line provides the opportunity to set direct quantitative constraints in key physical aspects of these galaxies like the internal extinction (Hα/Hβ ratio) and the total instantaneous star formation rate (Hα). Third, the detection of both Hα and HeI1.083 μm, the strongest HeI in the entire UV to near-IR spectral range, will provide unique information on the hardness of the ionizing source, even for the lowest metallicity sources. The ratio of ionizing photons can be derived as
![$$ \begin{aligned} \dfrac{\mathrm{Nph}~[{>}13.6\,\mathrm{eV}]}{\mathrm{Nph}~[{>}24.6\,\mathrm{eV}]} = (0.89{-}2.10) \times \dfrac{L~[\mathrm{H}\alpha ]}{L~[\mathrm{HeI}1.083\,\mu \mathrm{m}]} \end{aligned} $$](/articles/aa/full_html/2019/09/aa35594-19/aa35594-19-eq5.gif)
after extinction correction, and assuming emissivities for hydrogen (Osterbrock 1989), and HeI (Benjamin et al. 1999; Porter et al. 2005) for electron densities of 100 cm−3 and temperatures of 1–2 × 10⁴ K, similar to those measured in low-metallicity, low-z galaxies (Izotov et al. 2014). However, as the HeI 1.083 μm emissivity has a strong dependence with the electron density (factors 6–8 for densities in the 102 − 104 cm−3 range), a measure of the electron density (e.g. [SII]0.6717+0.6731 μm optical lines or [OIII]52,88 μm far-IR lines) is required to get an accurate value for the hardness of the ionizing source. For an instantaneous starburst and a given metallicity, the ratio of ionizing photons is a strong function of age with a drop in photons with energies above 24.6 eV relative to 13.6 eV for ages older than 6 Myr. Binaries (Eldridge et al. 2017) could also be playing a relevant role in changing the hardness of the ionizing spectrum in these galaxies, in particular at low metallicities. The presence of a low-luminosity AGN could also produce an ionizing spectrum harder than the predicted from stars only.
In addition, if Lyα measurements are available, the MIRI-MRS Hα observed flux and the Hα/Hβ derived internal extinction measurement, will provide a measurement of the Lyα escaping fraction,
![$$ \begin{aligned} F_{\rm esc}[\mathrm{Ly}\alpha ]= \dfrac{F_{\rm obs}[\mathrm{Ly}\alpha ]}{F_{\rm int}[\mathrm{Ly}\alpha ]}=\dfrac{F_{\rm obs}[\mathrm{Ly}\alpha ]}{R(\mathrm{Ly}\alpha ,\mathrm{H}\alpha ) \times F_{\rm int}[\mathrm{H}\alpha ]}, \end{aligned} $$](/articles/aa/full_html/2019/09/aa35594-19/aa35594-19-eq6.gif)
where Fobs[Lyα] is the observed Lyα flux (at z > 6)12, Fint[Hα] is the intrinsic Hα emission after correction for internal extinction, and R(Lyα,Hα) is the theoretical recombination case B value assumed to be 8.7 for the typical electron densities (a few ×102 cm−3 and temperatures < 2 × 10⁴ K). Likewise, as the Hα line is the least affected by extinction of all the optical hydrogen recombination lines, it provides a more accurate estimate of the escape fraction of ionizing photons (e.g. Matthee et al. 2017) when combined with the observed rest-frame < 912 Å photometry from existing HST or future NIRCam/JWST imaging.
Finally, the high S/N of [OIII]0.5007 μm and Hα emission lines open the possibility of detecting the presence of ionized gas outflows. Although beyond the scope of the present paper, preliminary simulations show that massive ionized outflows (> 107 M⊙, blueshifted by ∼300 km s−1, and with terminal velocities of 650–700 km s−1) could by traced by the Hα line in metal-poor sources similar to MACS1149-JD1 (Colina et al., in prep.)
3.2.2. UV-bright and massive EoR sources: B14-65666
B14-65666, as already mentioned in Sect. 3 and Table 1, is a strong [OIII]88 μm line emitter at a redshift of 7.15 detected with ALMA also as a [CII]158 μm source (Hashimoto et al. 2019). This UV-bright source (MUV ∼ − 22.3), is identified with a system of two galaxies, likely interacting or merging. Its derived global properties with a total SFR of 200 M⊙ yr−1, a stellar mass of 7.7 × 10⁸ M⊙, a low visual extinction (AV = 0.3 mag), and sSFR of 259 Gyr−1 place it among the most massive star-forming galaxies known at a redshift above 7, excluding quasi-stellar objects (QSOs). As such, it provides with an extraordinary opportunity for the detection of faint metallic lines ([NII]0.6584 μm, [SII]0.6717,0.6731 μm, and [SIII]0.9069,0.9532 μm), and therefore establishes strong constraints on the metallicity of the ionized gas in addition to the physical properties already mentioned in Sect. 3.2.1. Figure 6 shows the deep (40 ks) MRS simulated spectra of B14-65666 assuming, for the purpose of this simulation, that one of the components of the system has a metallicity of 0.2 Z⊙ (upper panel), while the metallicity for the second component is 0.04 Z⊙ (bottom panel). For the 0.2 Z⊙ spectrum, the weak [NII]0.6584 μm and [SII]0.6717,0.6731 μm integrated emission lines are detected at about the 3σ level, while the [SIII]0.9069,0.9532 μm integrated lines are detected at 6σ and 17σ, respectively. On the other hand, the 0.04 Z⊙ spectrum shows no detection (at the 3σ level) of [NII]0.6584 μm or [SII]0.6717,0.6731 μm, while the [SIII]0.9069,0.9532 μm lines are detected at 3σ and 7σ, respectively. Thus, the metallicity of luminous [OIII]88 μm emitters detected by ALMA or other JWST instruments (e.g. NIRSpec) could be explored in full, using the standard R23, and all the different optical tracers as well, including the N2, S2, N2S2Hα, N2S2 ratios, as well as the combined O3N2, O3S2, and S23 ratios (see Maiolino & Mannucci 2019 for a review).
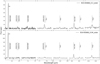 |
Fig. 6. Simulated deep (40 ks) MRS observation of B14-65666 at a redshift of 7.15. Upper panel shows the B14-65666_0.2_solar component spectrum with a metallicity of 0.2 Z⊙, and bottom panel illustrates the B14-65666_0.04_solar component with a metallicity of 0.04 Z⊙. The emission lines are shown as a dashed line, and their derived integrated fluxes can be found in Table 5. |
4. Conclusions
This paper has presented a study of the Hα fluxes predicted by state-of-the-art FIRSTLIGHT cosmological simulations for galaxies at redshifts of 6.5–10.5, covering the Epoch of Reionization, and of its detectability with the Medium Resolution Spectrograph (MRS) of the mid-IR Instrument (MIRI) on JWST. The paper has investigated the MRS detectability of the FIRSTLIGHT sources as a function of redshift, star formation rate, stellar mass, and specific star formation. In addition, it has presented realistic MRS simulated observation of the rest-frame optical and near-IR spectra of EoR sources recently detected by ALMA as [OIII]88 μm emitters. These include the lensed source MACS1149-JD1 and the interacting-merger candidate B14-65666 at a redshift of 9.11 and 7.15, respectively. These simulations cover different metallicities and emission line ratios, and are based on medium-deep (10 ks) and deep (40 ks) MRS observations using the current versions of the MIRI instrument simulator (MIRISim), and of the official JWST calibration pipeline. The main conclusions are as follows:
-
All currently ALMA detected [OIII]88 μm emitters at redshifts above 7 can be detected in the Hα line with MRS spectroscopy in a few hours (10 ks) with a high significance (i.e. with S/N > 5σ).
-
Deep integrations (40 ks) with MRS will detect (at least at the 5σ level) Hα emission line in EoR sources at redshifts above 7 with a SFR above ∼2 M⊙ yr−1, stellar masses above ∼4 − 9 × 10⁷ M⊙, and specific star formation above 4 Gyr−1. These limits cover the upper end of the SFR and stellar mass distribution at those redshifts, representing ∼6% and ∼1% of the predicted FIRSTLIGHT population in the 6.5–7.5 and 7.5–8.5 redshift ranges, respectively.
-
The FIRSTLIGHT population is dominated by numerous low-mass galaxies with faint Hα emission for JWST spectroscopy, characterized by median values of
 , 2.4, and 1.5 × 10⁻²⁰ erg s−1 cm−2 in the redshift intervals of 6.5–7.5, 7.5–8.5, and z > 8.5, respectively. However, a fraction of galaxies show much higher fluxes around F(Hα) ∼ 10−18 − 10−17 erg s−1 cm−2 and are accessible to observation with MIRI/JWST spectroscopy.
 -
The MRS will provide a good S/N Hβ (5–24σ) – Hα (18–90σ) emission line spectra of sources similar to the MACS1149-JD1 at a redshift of 9.11 in exposures of a few hours (∼10 ks) for metallicity 0.2–0.02 Z⊙. This example clearly illustrates the possibility of performing detailed studies of intrinsically bright or lensed sources, even at the beginning of the Epoch of Reionization.
-
The MRS will be able to establish and put strong limits on the metallicity of bright EoR sources, as demonstrated by the simulated B14-65666 system at 7.15 with metallicities 0.2 and 0.04 Z⊙. This will be achieved by adding the optical metallicity tracers (N2, S2, N2S2Hα, and N2S2) to the standard R23.
-
A measure of the hardness of the ionizing spectrum, Nph(> 912 Å)/Nph(> 504 Å), can be derived directly from the L(Hα)/L(HeI1.083 μm) line ratio if the electron density is known. This measure of the hardness will constrain the nature of the ionization source, i.e. the age and IMF upper mass limit of the stellar population, or the presence of a low luminosity AGN.
As shown in this paper, the prospects of detecting the Hα emission line with very high S/N (> 50) at least in bright (intrinsic or lensed) sources at redshifts of 7–9, opens the opportunity of investigating the presence and properties of outflows of ionized gas in galaxies during the Epoch of Reionization.
Data retrieval is available from http://www.ita.uni-heidelberg.de/∼ceverino/FirstLight/index.html
The sensitivity is roughly constant within the wavelength range covered by the MRS Channel 1, from 4.9 to 7.6 μm, i.e. Hα redshifted to 6.5 < z < 10.5 (see Glasse et al. 2015).
It is part of MIRICLE python environment (http://www.miricle.org).
Throughout the paper a value of 8.69 is assumed for the solar abundance, as given by Asplund et al. (2009).
Public and stable MIRISim releases are available at http://miri.ster.kuleuven.be/bin/view/Public/MIRISim_Public
Information about wavelength coverage, spectral setting, spatial resolution, dithering pattern, detector read-out mode, and exposure time for the MRS can be found at https://jwst-docs.stsci.edu/display/JTI/MIRI+Medium-Resolution+Spectroscopy
FWHM ∼0.31″–0.42″ depending on the Channel; see Wells et al. (2015) for an extensive explanation of the PSF dependence with the wavelength.
For more information about the JWST pipeline, see https://jwst-docs.stsci.edu/jwst-data-reduction-pipeline
The absolute photometric calibration uncertainties reported by the MIRISim team are can be found at http://miri.ster.kuleuven.be/bin/view/Public/MIRISimPublicReleases
Fobs[Lyα] also depends on the intergalactic medium (IGM) transmission, so that Fobs[Lyα]=Fem[Lyα]  , where Fem[Lyα] is the emitted Lyα flux and
  is the IGM transmission to Lyα photons (e.g. Inoue et al. 2014).
Acknowledgments
The authors gratefully thank the referee for the constructive comments and recommendations that helped to improve the quality of the paper, and the EC MIRI test team and MIRISim developers for providing a great and useful tool, the MIRI instrument simulator (MIRISim). The authors also acknowledge the STScI and the developer team of the official JWST calibration pipeline. This work was supported by the Spanish Ministry for Science, Innovation and Universities project number ESP2017-83197. D.C. acknowledges the Gauss Center for Supercomputing for funding this project by providing computing time on the GCS Supercomputer SuperMUC at Leibniz Supercomputing Centre (Project ID: pr92za). D.C. is supported by the state of Baden-Württemberg through bwHPC. D.C. is a DAWN fellow. A.L. acknowledges funding from the Comunidad de Madrid, Spain, under Atracción de Talento Investigador Grant 2017-T1/TIC-5213. J.P.P. and T.V.T. acknowledge financial support from UK Space Agency grants. A.A.-H. acknowledges support from the Spanish Ministry of Science, Innovation and Universities through grants AYA2015-64346-C2-1-P and PGC2018-094671-B-I00, which were party funded by the FEDER program and from CSIC grant PIE201650E36. K.I.C. acknowledges funding from the European Research Council through the award of the Consolidator Grant ID 681627-BUILDUP.
References
- Amorín, R., Pérez-Montero, E., Contini, T., et al. 2015, A&A, 578, A105 [NASA ADS] [CrossRef] [EDP Sciences] [Google Scholar]
- Asplund, M., Grevesse, N., Sauval, A. J., & Scott, P. 2009, ARA&A, 47, 481 [NASA ADS] [CrossRef] [Google Scholar]
- Barrow, K. S. S., Wise, J. H., Norman, M. L., O’Shea, B. W., & Xu, H. 2017, MNRAS, 469, 4863 [Google Scholar]
- Benjamin, R. A., Skillman, E. D., & Smits, D. P. 1999, ApJ, 514, 307 [NASA ADS] [CrossRef] [Google Scholar]
- Bouwens, R. J., Illingworth, G. D., Oesch, P. A., et al. 2015, ApJ, 803, 34 [NASA ADS] [CrossRef] [Google Scholar]
- Bouwens, R. J., Smit, R., Labbé, I., et al. 2016a, ApJ, 831, 176 [NASA ADS] [CrossRef] [Google Scholar]
- Bouwens, R. J., Aravena, M., Decarli, R., et al. 2016b, ApJ, 833, 72 [NASA ADS] [CrossRef] [Google Scholar]
- Bowler, R. A. A., Dunlop, J. S., McLure, R. J., et al. 2014, MNRAS, 440, 2810 [NASA ADS] [CrossRef] [Google Scholar]
- Bowler, R. A. A., Dunlop, J. S., McLure, R. J., & McLeod, D. J. 2017, MNRAS, 466, 3612 [NASA ADS] [CrossRef] [Google Scholar]
- Caputi, K. I., Deshmukh, S., Ashby, M. L. N., et al. 2017, ApJ, 849, 45 [NASA ADS] [CrossRef] [Google Scholar]
- Carniani, S., Maiolino, R., Pallottini, A., et al. 2017, A&A, 605, A42 [NASA ADS] [CrossRef] [EDP Sciences] [Google Scholar]
- Ceverino, D., & Klypin, A. 2009, ApJ, 695, 292 [NASA ADS] [CrossRef] [Google Scholar]
- Ceverino, D., Klypin, A., Klimek, E. S., et al. 2014, MNRAS, 442, 1545 [NASA ADS] [CrossRef] [Google Scholar]
- Ceverino, D., Glover, S. C. O., & Klessen, R. S. 2017, MNRAS, 470, 2791 [NASA ADS] [CrossRef] [Google Scholar]
- Ceverino, D., Klessen, R. S., & Glover, S. C. O. 2018, MNRAS, 480, 4842 [NASA ADS] [Google Scholar]
- Ceverino, D., Klessen, R. S., & Glover, S. C. O. 2019, MNRAS, 484, 1366 [NASA ADS] [CrossRef] [Google Scholar]
- Chevallard, J., Curtis-Lake, E., Charlot, S., et al. 2019, MNRAS, 483, 2621 [NASA ADS] [CrossRef] [Google Scholar]
- Dinerstein, H. L., Lester, D. F., & Werner, M. W. 1985, ApJ, 291, 561 [NASA ADS] [CrossRef] [Google Scholar]
- Eldridge, J. J., Stanway, E. R., Xiao, L., et al. 2017, PASA, 34, e058 [NASA ADS] [CrossRef] [Google Scholar]
- Faisst, A. L., Capak, P., Hsieh, B. C., et al. 2016, ApJ, 821, 122 [Google Scholar]
- Glasse, A., Rieke, G. H., Bauwens, E., et al. 2015, PASP, 127, 686 [NASA ADS] [CrossRef] [Google Scholar]
- Hashimoto, T., Laporte, N., Mawatari, K., et al. 2018, Nature, 557, 392 [NASA ADS] [CrossRef] [Google Scholar]
- Hashimoto, T., Inoue, A. K., Mawatari, K., et al. 2019, PASJ, 71, 71 [NASA ADS] [CrossRef] [Google Scholar]
- Hirschauer, A. S., Salzer, J. J., Skillman, E. D., et al. 2016, ApJ, 822, 108 [NASA ADS] [CrossRef] [Google Scholar]
- Inoue, A. K., Shimizu, I., Iwata, I., & Tanaka, M. 2014, MNRAS, 442, 1805 [NASA ADS] [CrossRef] [Google Scholar]
- Inoue, A. K., Tamura, Y., Matsuo, H., et al. 2016, Science, 352, 1559 [NASA ADS] [CrossRef] [Google Scholar]
- Izotov, Y. I., & Thuan, T. X. 2011, ApJ, 734, 82 [NASA ADS] [CrossRef] [Google Scholar]
- Izotov, Y. I., Guseva, N. G., Fricke, K. J., & Papaderos, P. 2009, A&A, 503, 61 [NASA ADS] [CrossRef] [EDP Sciences] [Google Scholar]
- Izotov, Y. I., Thuan, T. X., & Guseva, N. G. 2014, MNRAS, 445, 778 [NASA ADS] [CrossRef] [Google Scholar]
- Izotov, Y. I., Thuan, T. X., Guseva, N. G., & Liss, S. E. 2018, MNRAS, 473, 1956 [NASA ADS] [CrossRef] [Google Scholar]
- Jung, I., Finkelstein, S. L., Dickinson, M., et al. 2019, ApJ, 877, 146 [NASA ADS] [CrossRef] [Google Scholar]
- Katz, H., Laporte, N., Ellis, R. S., Devriendt, J., & Slyz, A. 2019, MNRAS, 484, 4054 [NASA ADS] [CrossRef] [Google Scholar]
- Keenan, F. P., & Aggarwal, K. M. 1990, ApJ, 350, 262 [NASA ADS] [CrossRef] [Google Scholar]
- Kennicutt, Jr., R. C. 1998, ApJ, 498, 541 [NASA ADS] [CrossRef] [Google Scholar]
- Kewley, L. J., Dopita, M. A., Leitherer, C., et al. 2013a, ApJ, 774, 100 [NASA ADS] [CrossRef] [Google Scholar]
- Kewley, L. J., Maier, C., Yabe, K., et al. 2013b, ApJ, 774, L10 [Google Scholar]
- Kravtsov, A. V. 2003, ApJ, 590, L1 [NASA ADS] [CrossRef] [Google Scholar]
- Kravtsov, A. V., Klypin, A. A., & Khokhlov, A. M. 1997, ApJS, 111, 73 [NASA ADS] [CrossRef] [Google Scholar]
- Kroupa, P. 2001, MNRAS, 322, 231 [NASA ADS] [CrossRef] [Google Scholar]
- Labbé, I., Oesch, P. A., Bouwens, R. J., et al. 2013, ApJ, 777, L19 [NASA ADS] [CrossRef] [Google Scholar]
- Lam, D., Bouwens, R. J., Labbe, I., et al. 2019, A&A, 627, A164 [NASA ADS] [CrossRef] [EDP Sciences] [Google Scholar]
- Laporte, N., Ellis, R. S., Boone, F., et al. 2017, ApJ, 837, L21 [NASA ADS] [CrossRef] [Google Scholar]
- Maiolino, R., & Mannucci, F. 2019, A&ARv, 27, 3 [NASA ADS] [CrossRef] [Google Scholar]
- Mármol-Queraltó, E., McLure, R. J., Cullen, F., et al. 2016, MNRAS, 460, 3587 [NASA ADS] [CrossRef] [Google Scholar]
- Matthee, J., Sobral, D., Best, P., et al. 2017, MNRAS, 465, 3637 [NASA ADS] [CrossRef] [Google Scholar]
- Oesch, P. A., Bouwens, R. J., Illingworth, G. D., et al. 2015a, ApJ, 808, 104 [NASA ADS] [CrossRef] [Google Scholar]
- Oesch, P. A., van Dokkum, P. G., Illingworth, G. D., et al. 2015b, ApJ, 804, L30 [Google Scholar]
- Oesch, P. A., Bouwens, R. J., Illingworth, G. D., Labbé, I., & Stefanon, M. 2018, ApJ, 855, 105 [NASA ADS] [CrossRef] [Google Scholar]
- Osterbrock, D. E. 1989, Astrophysics of Gaseous Nebulae and Active Galactic Nuclei, 422 [Google Scholar]
- Pentericci, L., Fontana, A., Vanzella, E., et al. 2011, ApJ, 743, 132 [NASA ADS] [CrossRef] [Google Scholar]
- Porter, R. L., Bauman, R. P., Ferland, G. J., & MacAdam, K. B. 2005, ApJ, 622, L73 [NASA ADS] [CrossRef] [Google Scholar]
- Rasappu, N., Smit, R., Labbé, I., et al. 2016, MNRAS, 461, 3886 [NASA ADS] [CrossRef] [Google Scholar]
- Ribeiro, B., Le Fèvre, O., Tasca, L. A. M., et al. 2016, A&A, 593, A22 [NASA ADS] [CrossRef] [EDP Sciences] [Google Scholar]
- Roberts-Borsani, G. W., Bouwens, R. J., Oesch, P. A., et al. 2016, ApJ, 823, 143 [NASA ADS] [CrossRef] [Google Scholar]
- Schaerer, D., & de Barros, S. 2009, A&A, 502, 423 [NASA ADS] [CrossRef] [EDP Sciences] [Google Scholar]
- Shibuya, T., Ouchi, M., Harikane, Y., & Nakajima, K. 2019, ApJ, 871, 164 [NASA ADS] [CrossRef] [Google Scholar]
- Smit, R., Bouwens, R. J., Franx, M., et al. 2015, ApJ, 801, 122 [NASA ADS] [CrossRef] [Google Scholar]
- Smit, R., Bouwens, R. J., Labbé, I., et al. 2016, ApJ, 833, 254 [NASA ADS] [CrossRef] [Google Scholar]
- Smit, R., Bouwens, R. J., Carniani, S., et al. 2018, Nature, 553, 178 [NASA ADS] [CrossRef] [Google Scholar]
- Stark, D. P., Schenker, M. A., Ellis, R., et al. 2013, ApJ, 763, 129 [NASA ADS] [CrossRef] [Google Scholar]
- Stark, D. P., Ellis, R. S., Charlot, S., et al. 2017, MNRAS, 464, 469 [NASA ADS] [CrossRef] [Google Scholar]
- Stefanon, M., Labbé, I., Bouwens, R. J., et al. 2017, ApJ, 851, 43 [NASA ADS] [CrossRef] [Google Scholar]
- Tamura, Y., Mawatari, K., Hashimoto, T., et al. 2019, ApJ, 874, 27 [NASA ADS] [CrossRef] [Google Scholar]
- Thuan, T. X., & Izotov, Y. I. 2005, ApJS, 161, 240 [NASA ADS] [CrossRef] [Google Scholar]
- Wells, M., Pel, J.-W., Glasse, A., et al. 2015, PASP, 127, 646 [NASA ADS] [CrossRef] [Google Scholar]
- Wright, G. S., Wright, D., Goodson, G. B., et al. 2015, PASP, 127, 595 [NASA ADS] [CrossRef] [Google Scholar]
- Zheng, W., Postman, M., Zitrin, A., et al. 2012, Nature, 489, 406 [NASA ADS] [CrossRef] [PubMed] [Google Scholar]
- Zitrin, A., Labbé, I., Belli, S., et al. 2015, ApJ, 810, L12 [NASA ADS] [CrossRef] [Google Scholar]
All Tables
All Figures
|
Fig. 1. Relation between [OIII]/Hα and Hα fluxes of the FIRSTLIGHT simulated galaxies at 6.5 < z < 10.5. The most luminous galaxies present similar Hα and [OIII] fluxes, whereas for fainter galaxies, Hα tends to be relatively brighter than [OIII], similar to the values found in metal-poor, low-z galaxies. |
| In the text | |
|
Fig. 2. Predicted Hα fluxes as a function of star formation rate (left), stellar mass (middle), and specific star formation rate (right) for the FIRSTLIGHT simulated galaxies at 6.5 < z < 10.5. Grey and black horizontal dashed lines mark respectively the 10σ and 5σ limits of medium deep (10 ks) and deep (40 ks) MRS spectroscopic observations. Other known z > 7 galaxies with detected [OIII] 88μm emission lines (Inoue et al. 2016; Laporte et al. 2017; Hashimoto et al. 2019, 2018; Tamura et al. 2019) are also shown with filled symbols (SFR and stellar mass measurements of A2444_YD4 SXFD-NB10006-2 have been corrected for the lower proportion of low-mass stars in the Kroupa IMF relative to the standard Salpeter assumed in Inoue et al. 2016; Laporte et al. 2017, respectively). For these galaxies, ratios of [OIII] 88μm/[OIII] 0.5007 μm = 10 and [OIII] 0.5007 μm/Hα = 1.1 are used to derive the expected Hα fluxes (vertical lines show the minimum and maximum expected Hα fluxes considering different line ratios of R[OIII] and [OIII]0.5007 μm/Hα; see text for details). For the galaxies magnified by gravitational lensing, such as MACS1149-JD1, A2744_YD4, and MACS0416_Y1, the de-magnified expected fluxes are shown as empty symbols (SFR and M* measurements refer to intrinsic values). |
| In the text | |
|
Fig. 3. Spectral templates used on the MRS simulated observations (see Table 2 for details). Upper panel shows the brightest optical and near-IR emission lines in the range from Hβ to Paβ. The bottom panel is a zoom-in of the dashed line rectangle shown in the upper panel, and illustrates the fainter optical and near-IR emission lines in the range from Hα to Paβ. The spectra have a line width of 154 km s−1 (FWHM) and are normalized to the peak of the [OIII]0.5007 μm emission line; the continuum is set to zero. |
| In the text | |
|
Fig. 4. Simulated B14-65666 system. It illustrates the integrated Hα map for a deep (40 ks) MRS observations, where two components are simulated as point-like source separated by 1″, and with metallicities of 0.2 and 0.04 Z⊙. |
| In the text | |
|
Fig. 5. Simulated medium-deep (10 ks) MRS observation of MACS1149-JD1 at a redshift of 9.11. It illustrates the simulated spectrum with metallicities of 0.02 Z⊙ (blue), 0.04 Z⊙ (green), and 0.2 Z⊙ (red). The main emission lines are shown as dashed lines, and their derived integrated fluxes can be found in Table 4. |
| In the text | |
|
Fig. 6. Simulated deep (40 ks) MRS observation of B14-65666 at a redshift of 7.15. Upper panel shows the B14-65666_0.2_solar component spectrum with a metallicity of 0.2 Z⊙, and bottom panel illustrates the B14-65666_0.04_solar component with a metallicity of 0.04 Z⊙. The emission lines are shown as a dashed line, and their derived integrated fluxes can be found in Table 5. |
| In the text | |
Current usage metrics show cumulative count of Article Views (full-text article views including HTML views, PDF and ePub downloads, according to the available data) and Abstracts Views on Vision4Press platform.
Data correspond to usage on the plateform after 2015. The current usage metrics is available 48-96 hours after online publication and is updated daily on week days.
Initial download of the metrics may take a while.