Fig. 2.
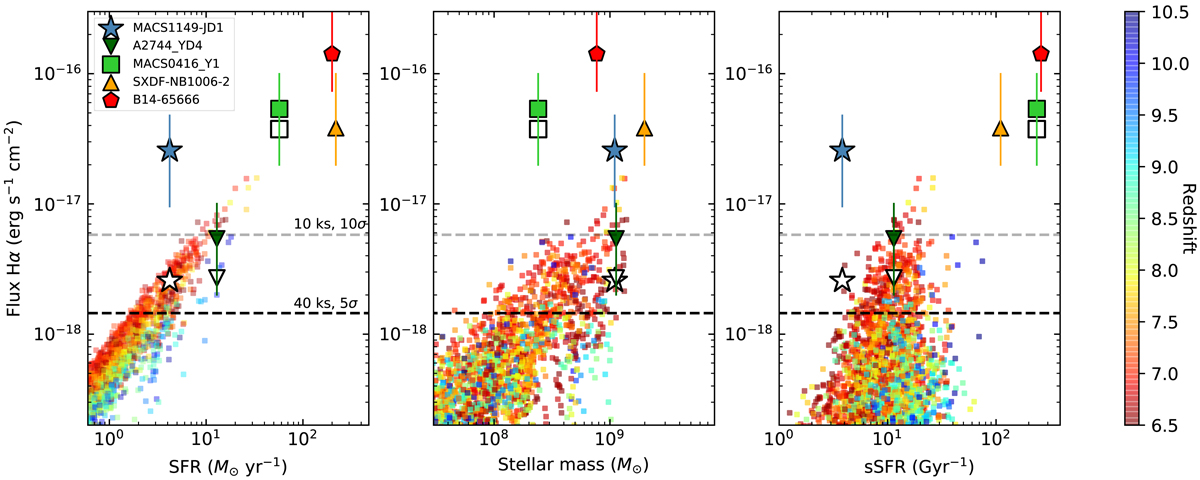
Predicted Hα fluxes as a function of star formation rate (left), stellar mass (middle), and specific star formation rate (right) for the FIRSTLIGHT simulated galaxies at 6.5 < z < 10.5. Grey and black horizontal dashed lines mark respectively the 10σ and 5σ limits of medium deep (10 ks) and deep (40 ks) MRS spectroscopic observations. Other known z > 7 galaxies with detected [OIII] 88μm emission lines (Inoue et al. 2016; Laporte et al. 2017; Hashimoto et al. 2019, 2018; Tamura et al. 2019) are also shown with filled symbols (SFR and stellar mass measurements of A2444_YD4 SXFD-NB10006-2 have been corrected for the lower proportion of low-mass stars in the Kroupa IMF relative to the standard Salpeter assumed in Inoue et al. 2016; Laporte et al. 2017, respectively). For these galaxies, ratios of [OIII] 88μm/[OIII] 0.5007 μm = 10 and [OIII] 0.5007 μm/Hα = 1.1 are used to derive the expected Hα fluxes (vertical lines show the minimum and maximum expected Hα fluxes considering different line ratios of R[OIII] and [OIII]0.5007 μm/Hα; see text for details). For the galaxies magnified by gravitational lensing, such as MACS1149-JD1, A2744_YD4, and MACS0416_Y1, the de-magnified expected fluxes are shown as empty symbols (SFR and M* measurements refer to intrinsic values).
Current usage metrics show cumulative count of Article Views (full-text article views including HTML views, PDF and ePub downloads, according to the available data) and Abstracts Views on Vision4Press platform.
Data correspond to usage on the plateform after 2015. The current usage metrics is available 48-96 hours after online publication and is updated daily on week days.
Initial download of the metrics may take a while.