Fig. 3.
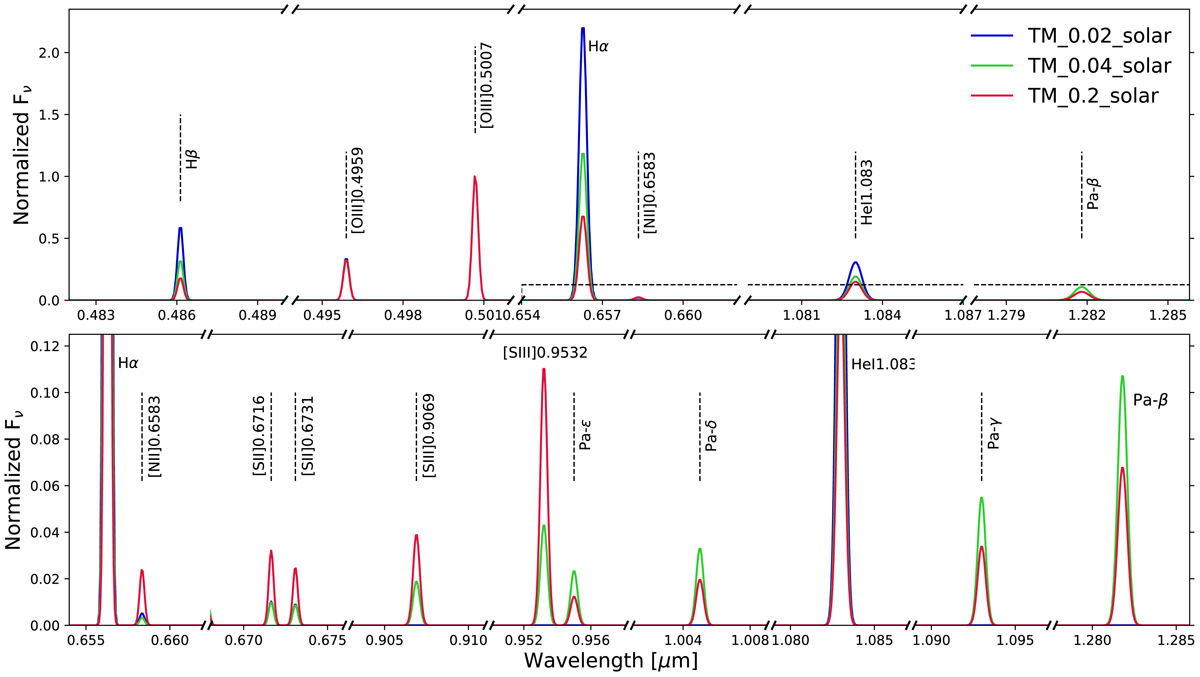
Spectral templates used on the MRS simulated observations (see Table 2 for details). Upper panel shows the brightest optical and near-IR emission lines in the range from Hβ to Paβ. The bottom panel is a zoom-in of the dashed line rectangle shown in the upper panel, and illustrates the fainter optical and near-IR emission lines in the range from Hα to Paβ. The spectra have a line width of 154 km s−1 (FWHM) and are normalized to the peak of the [OIII]0.5007 μm emission line; the continuum is set to zero.
Current usage metrics show cumulative count of Article Views (full-text article views including HTML views, PDF and ePub downloads, according to the available data) and Abstracts Views on Vision4Press platform.
Data correspond to usage on the plateform after 2015. The current usage metrics is available 48-96 hours after online publication and is updated daily on week days.
Initial download of the metrics may take a while.