| Issue |
A&A
Volume 597, January 2017
|
|
|---|---|---|
| Article Number | L10 | |
| Number of page(s) | 6 | |
| Section | Letters | |
| DOI | https://doi.org/10.1051/0004-6361/201629447 | |
| Published online | 20 January 2017 | |
Brightness variations of the FUor-type eruptive star V346 Normae⋆
1 Konkoly Observatory, Research Centre for Astronomy and Earth Sciences, Hungarian Academy of Sciences, PO Box 67, 1525 Budapest, Hungary
e-mail: kospal@konkoly.hu
2 Astronomisches Institut, Ruhr-Universität Bochum, Universitätsstraße 150, 44801 Bochum, Germany
Received: 1 August 2016
Accepted: 1 January 2017
Decades after the beginning of its FU Orionis-type outburst, V346 Nor unexpectedly underwent a fading event of ΔK = 4.6 mag around 2010. We obtained near-infrared observations and re-analyzed data from the VISTA/VVV survey to outline the brightness evolution. In our VLT/NaCO images, we discovered a halo of scattered light around V346 Nor with a size of about 0".04 (30 au). The VISTA data outlined a well-defined minimum in the light curve in late 2010/early 2011, and tentatively revealed a small-amplitude periodic modulation of 58 days. Our latest data points from 2016 demonstrate that the source is still brightening but has not yet reached the 2008 level. We used a simple accretion disk model with varying accretion rate and line-of-sight extinction to reproduce the observed near-infrared magnitudes and colors. We found that the flux changes of V346 Nor before 2008 were caused by a correlated change of extinction and accretion rate, while the minimum around 2010 was mostly due to decreasing accretion. The source reached a highest accretion rate of ≈ 10-4M⊙ yr-1 in 1992. A combination of accretion and extinction changes has been invoked in the literature to interpret the flux variations of certain embedded young eruptive stars.
Key words: stars: formation / circumstellar matter / infrared: stars / stars: individual: V346 Nor
© ESO, 2017
1. Introduction
FU Orionis-type stars (FUors) are low-mass pre-main-sequence objects characterized by four to six magnitude optical outbursts that are due to temporarily enhanced accretion from the circumstellar disk to the star (Hartmann & Kenyon 1996). Following the outburst of the first such object, FU Ori in 1937, more than two dozen FUors and FUor candidates are known today (Audard et al. 2014). V346 Nor was discovered by Elias (1980) as a source within a few arcseconds of the HH 57 nebulosity, which is a faint, compact Hα-emitting knot (Schwartz 1977) located in the Sa 187 molecular cloud within the Norma 1 association, at a distance of 700 pc (Reipurth 1981, see also Fig. 1). A few years later, Graham (1983) reported the appearance of a star-like source at the northeastern tip of HH 57, which probably coincides with the source in Elias (1980). Graham described that the star was not visible in 1976 (Schwartz 1977), but a diffuse patch is clearly discernible in the blue plates of the ESO/SERC Sky Survey, obtained in April–June 1975 (Holmberg et al. 1974; Reipurth 1981). Therefore, V346 Nor transformed from a faint diffuse nebula to a bright point-source at some time between 1976 and 1980. Based on this and on the spectroscopic properties of the star, Reipurth & Krautter (1983) suggested that V346 Nor was undergoing a FUor-type outburst. Frogel & Graham (1983) presented photometry from 2.2 to 20μm and remarked that the colors of the object are similar to those of FU Ori and V1057 Cyg.
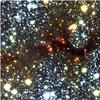 |
Fig. 1 V346 Nor (black plus sign in the center) and its surroundings in a JHKS color-composit image. The observations were taken within the VISTA Variables in the Via Lactea (VVV) Survey on March 15, 2010. North is up and east is to the left. The displayed area is 2 |
Subsequent near-infrared (near-IR) photometry indicated that V346 Nor was gradually brightening in the K band, reaching a broad maximum between about 1990 and 2000 (Frogel & Graham (1983, Reipurth & Wamsteker 1983; Reipurth 1985; Kenyon & Hartmann 1991; Molinari et al. 1993; Prusti et al. 1993; Reipurth et al. 1997; Ábrahám et al. 2004, see also Fig. 3). Kenyon & Hartmann (1991) presented the broadband optical-IR spectral energy distribution (SED) of V346 Nor, while Weintraub et al. (1991) published submillimeter and millimeter photometry for it. Both groups concluded that the object is surrounded by a significant amount of circumstellar material, in the form of an actively accreting disk and a flattened envelope. Recently, Kraus et al. (2016) reported a dramatic brightness decrease of V346 Nor and a subsequent brightening. They interpreted these results as a drop in the accretion rate of 2–3 orders of magnitude, followed by the onset of a new outburst. In order to better understand this spectacular event and to follow up the evolution of the system, we present new near-IR observations of V346 Nor and reevaluate the data taken by the VISTA telescope. We analyze the brightness and color variations observed in V346 Nor and compare the results with similar fading events of highly accreting young stellar objects from the literature.
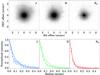 |
Fig. 2 Top: VLT/NaCo J, H, and KS images of V346 Nor from 2008. The color scale is logarithmic. Bottom: radial intensity profiles of V346 Nor (solid curves) and of another fainter star that is visible in the field of view (dashed curves) measured in our NaCo J, H, and KS images. The uncertainty of the brightness profile of the fainter star is indicated by error bars, while the uncertainty in the profile of V346 Nor is less than the curve thickness. |
2. Observations, data reduction, and photometry
We observed V346 Nor with the NaCo adaptive optics instrument on the UT4 of European Southern Observatory’s Very Large Telescope (VLT) at Cerro Paranal, Chile, on April 10/11, 2008, as part of project 381.C-0241 (PI: Á. Kóspál). The weather conditions were good and the typical optical seeing was around 1′′. We obtained J, H, and KS-band images with the N20C80 dichroic and the 13 mas pixel-1 scale camera. We observed 2MASS J16323308−4457314 as a photometric standard with the same instrumental setup as the science target. This star is only 2′ away from V346 Nor and has similar 2MASS magnitudes (J = 10.288 mag, H = 8.395 mag, KS = 7.242 mag). Our NaCo images are displayed in Fig. 2. We obtained aperture photometry for both V346 Nor and the photometric standard using an aperture radius of 2′′ and sky annulus between 2 6 and 39. This large aperture was chosen to include the entire flux of V346 Nor, which appears slightly extended in our NaCo images (see below). Our photometry can therefore be compared to earlier unresolved photometry from the literature. The obtained instrumental magnitudes were converted into standard magnitudes using the 2MASS values for the photometric standard. We also downloaded archival J and KS-band NaCo observations from June 12, 2003, and reduced and extracted photometry from them in a similar way. The obtained brightnesses of V346 Nor are presented in Table B.1.
Our group observed the area around V346 Nor with the InfraRed Imaging System (IRIS) at Bochum Observatory near Cerro Armazones. IRIS is a 80 cm telescope equipped with a 1k×1k infrared camera. The system provides a resolution of 0.74′′/pixel and a field of view of 13′ × 13′. Data were taken between June 26, 2010 and July 1, 2010, as well as between August 22 and 25, 2016, in the J, H and KS bands. Individual frames were combined to eliminate the sky signal and correct for flatfield differences. V346 Nor was not visible in the J band, but was detected in all H and KS frames. All J-band images obtained on the same night were combined into mosaics, and 3σ upper limits were determined. For the other filters, we performed aperture photometry using the same aperture and sky annulus sizes as for the NaCo images. For the photometric calibration, we used a set of about 50 2MASS stars with quality flag “A” to determine the offset between the instrumental and the 2MASS magnitudes. We found that no color term was needed for this transformation. The uncertainty of the final photometry is the quadratic sum of the formal uncertainty of the aperture photometry and the photometric calibration. The resulting J upper limits and HKS magnitudes are presented in Table B.1.
We observed V346 Nor with the SMARTS 1.3 m telescope at Cerro Tololo on June 7 and August 9, 2016. The telescope is equipped with the ANDICAM instrument, which provides simultaneous optical and IR images. The CCD for the ANDICAM is a Fairchild 447 2k×2k chip, which we used with 2 × 2 binning, resulting in a binned pixel scale of 0.371′′/pixel, and a field of view of about 6′ × 6′. The IR array for the ANDICAM is a Rockwell 1k×1k HgCdTe “Hawaii” array, also used with 2×2 binning, with 0.276′′/pixel binned scale and 2 4×24 field of view. We used the Johnson-Kron-Cousins VRI optical and CIT/CTIO JHK IR filters. A five-point dithering was made to enable bad pixel removal and sky subtraction in the IR images. Bias and flat correction for the optical images were made by the Yale SMARTS team. Although HH 57 is faintly visible in our V and R images, V346 Nor itself is not detected in the optical. We used magnitude values from the UCAC4 catalog (Zacharias et al. 2013) to calibrate the images and determined 3σ upper limits of V > 20.8 mag, R > 19.6 mag, and I>18.8 mag for V346 Nor. In the near-IR regime, V346 Nor was detected in all three bands, and we performed photometry the same way as described for the IRIS images. The resulting JHK magnitudes for V346 Nor are presented in Table B.1.
V346 Nor was covered as part of the VISTA Variables in the Via Lactea Survey, an ESO public survey using the VISTA 4.1 m telescope and the VIRCAM near-IR camera (Minniti et al. 2010). We downloaded all VIRCAM images from this survey that cover V346 Nor. To obtain photometry that can be compared with our NaCO, IRIS, and SMARTS data, we performed our own flux extraction with the same aperture as described above. At some epochs, our values differ from those published by Kraus et al. (2016) for the same measurements. The reason is probably a different treatment of the known nonlinearity of the VIRCAM detectors for bright sources (e.g., Saito et al. 2012). The correction we applied is described in detail in Appendix A. The J and H photometry and the KS-band results after the nonlinearity correction are also given in Table B.1.
3. Results
The top part of Fig. 2 shows our NaCo JHKS images from 2008 of V346 Nor, while the bottom panel displays the normalized azimuthally averaged radial brightness distributions of V346 Nor, and another fainter star visible in the field of view at a distance of 57, position angle of 13° east of north. Assuming that this nearby faint star is a point source, the comparison of the brightness profiles shows that V346 Nor is extended in the J and H bands, while it is consistent with a point source in the KS band. Deconvolved sizes using Gaussian deconvolution are 0041±0016 (29 ± 11 au) in J, 0037±0010 (25 ± 7 au) in H, and we can give an upper limit of 002 (13 au) for the KS-band size. The size of the near-IR emitting region in circumstellar disks is typically only a few au, therefore the emission seen in the NaCo images has to be scattered light. The J and H images are slightly asymmetric with the northern part slightly more extended than the southern part. No such asymmetry is evident in the KS image.
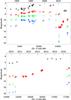 |
Fig. 3 Near-IR light curves of V346 Nor. Data points are from Elias (1980), Frogel & Graham (1983), Graham & Frogel (1985), Reipurth & Krautter (1983, Reipurth & Wamsteker (1983), Reipurth (1985), Kenyon & Hartmann (1991), Molinari et al. (1993), Prusti et al. (1993), Reipurth et al. (1997), Quanz et al. (2007), Connelley et al. (2008), the 2MASS, DENIS, AllWISE and NEOWISE catalogs (Cutri et al. 2003, 2015; Cutri 2013), and this work. Downward arrows indicate upper limits. |
Figure 3 shows the near-IR light curves of V346 Nor. The first few data points indicate a brightening between 1979 and 1983, followed by a relatively constant period until about 1988. The K and L-band data later show a gradual brightening until 1992, as has been reported in Ábrahám et al. (2004). The J and H light curves were rather flat, with small brightness variations of <1 mag. After 2003–2004 the source significantly faded, especially at short wavelengths and in 2008 displayed similar brightness although slightly redder color than the first JHK photometry in 1979.
At some time around 2008, V346 Nor started to fade dramatically and reached a minimum around late 2010 to early 2011 (Fig. 3, bottom). The source later quickly brightened by ΔK = 2.4 mag in about three years and another ΔK = 0.6 mag in the following three years, indicating a slower brightening rate. As of 2016 August, V346 Nor has not yet reached the brightness level it displayed in 1980–2000. This is well visible in the near-IR light curves, but our optical upper limits also support this, as the star would have been visible in our VRI images had it been as bright as it was between 1980–2000. The deep minimum was also visible in the WISE 3.4μm photometry, although with smaller amplitude.
The lower panel of Fig. 3 shows that the minimum in the K band has a parabola-like light curve shape. By fitting and subtracting a second-order polynomial from the photometry between 2010 and 2014, the obtained residuals are on the order of 0.2 mag and suggest a possible periodic modulation. We calculated a Lomb-Scargle periodogram for the residuals and found a tentative 58 ± 2 day period in the data with a false-alarm probability of 3×10⁻³ (see also Fig. B.1). Similar periodicities in the light curves have been found in V1647 Ori, for example, where they were explained by an orbiting dust cloud (Acosta-Pulido et al. 2007), and in V960 Mon, where they were explained by a putative close companion (Hackstein et al. 2015).
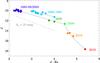 |
Fig. 4 Near-IR color–magnitude diagram for V346 Nor. The reddening path is marked with a dashed line (Cardelli et al. 1989). The solid gray curves indicate our reddened accretion disk model fits (see details in text). |
4. Discussion and conclusions
The color–magnitude diagram in Fig. 4 shows that all data points until 2008 form an approximately linear strip, while the later measurements deviate from this trend, suggesting different physical mechanisms for the brightness and color changes before and after 2008. In order to reproduce the observations, we fit the JHKS data points in each epoch by a steady optically thick and geometrically thin viscous accretion disk, with a radially constant mass-accretion rate. Such disk models were successfully proposed and used to reproduce the SEDs of FUors by Hartmann & Kenyon (1996), Zhu et al. (2007), and Kóspál et al. (2016). We calculated the disk SED by integrating the fluxes of concentric annuli between the stellar radius and Rout, assuming blackbody emission. We reddened the model fluxes by different AV values, using the extinction law from Savage & Mathis (1979) with RV = 3.1. Fixing the outer radius of the accretion disk (Rout = 2 au, the exact value has a negligible effect on the near-IR fluxes), we have only two free parameters, the product of the stellar mass and the accretion rate MṀ, and the extinction AV. We fixed the stellar mass and radius to typical low-mass YSO values of 1M⊙ and 3.0R⊙ (the resulting accretion rate is inversely proportional to the adopted stellar mass). The inclination of the V346 Nor disk is not known, thus we adopted 2/π ≈ 40°, the mean expected value if the disk is randomly oriented. The fitting procedure was performed with χ2 minimization. More extreme extinction laws (up to RV = 5.3, Cardelli et al. 1989) would change the fitted AV and Ṁ values by less than 15%, which is within the formal uncertainty of our fitting procedure.
The bluest points in Fig. 4 correspond to measurements obtained in 1983–88 and 2003, when the system exhibited approximately the same brightness and color. We found that these points can be well fit by our disk model with Ṁ = 1.0 × 10⁻⁵M⊙ yr-1 and line-of-sight reddening of AV = 6.7 mag. We obtained similarly good fits for the 1979 and 2008 SEDs with Ṁ = 2.1 × 10⁻⁵M⊙ yr-1 and Ṁ = 4.5 × 10⁻⁵M⊙ yr-1, respectively. The reddening, however, was significantly higher, 16.7 mag in 1979 and 21.5 mag in 2008. We simulated the time evolution of the system by computing a sequence of models of gradually changing AV from 21.5 to 6.7 mag and Ṁ from 4.5 × 10⁻⁵ to 1.0 × 10⁻⁵M⊙ yr-1. The resulting line is plotted in Fig. 4. For most epochs, our disk model fits the SED shape well with typical formal uncertainties of 1–2 mag in AV and 10–30% in Ṁ. After the minimum in 2010, the shape of the SEDs can be reproduced less well with the accretion disk model, resulting in formal uncertainties of 6–8 mag in AV, and up to a factor of 6 in Ṁ.
The data points obtained between 1989 and 1999 are situated above the model line. These SEDs can also be fit with our disk model, but with higher Ṁ values than at any time before. AV was between 12.1 and 19.2 mag in this period. In particular, we found that the accretion rate showed a maximum in 1992 January, with Ṁ = 9.8 × 10⁻⁵ and AV = 16.8 mag. Here, we again computed a sequence of models with gradually changing AV from 19.2 to 12.1 mag and Ṁ from 9.8 × 10⁻⁵ to 3.5 × 10⁻⁵M⊙ yr-1, also plotted in Fig. 4.
Kraus et al. (2016) suggested that the minimum around 2010 is related to a large drop in the accretion rate. Using our accretion disk model, we found that by keeping a constant AV = 21.5 mag between 2008 and 2010 and adding an accretion disk model of gradually increasing Ṁ to the SED measured in 2010, we can reach the 2008 data point (Fig. 4). In the minimum, the measured fluxes constrain the model accretion rate below 4 × 10⁻⁷M⊙ yr-1, thus the change in accretion rate was at least a factor of 100 or more, in agreement with the findings of Kraus et al. (2016). We did not include the scattered light component that is indicated by our NaCo observations in 2008 in our modeling since treating it consistently would be beyond the scope of this Letter.
Our results demonstrated that while the rapid fading in 2010 was an accretion event, the flux evolution beforehand was due to a combined correlated change in extinction and accretion rate. That is, the increasing accretion rate is accompanied by growing extinction toward the source. V346 Nor is similar to a group of highly variable young stellar objects whose flux changes are due to a combined effect of changing accretion rate and variable circumstellar extinction. Objects like this are Hα11, PV Cep, V1647 Ori, and V899 Mon (Kun et al. 2011a,b; Mosoni et al. 2013; Ninan et al. 2015). V346 Nor also resembles the young eruptive star V2492 Cyg in several aspects: the pre-outburst position of V2492 Cyg in the near-IR color–color diagram is close to the point of the 2010 minimum of V346 Nor, it also underwent a large accretion change at the beginning of its outburst, and in the high state, the line-of-sight extinction varies continuously (Kóspál et al. 2011, 2013; Hillenbrand et al. 2013). Therefore, the observed variability in both V346 Nor and V2492 Cyg is governed by a combination of changing accretion and extinction.
The minimum of V346 Nor in 2010 was immediately followed by the rebrightening of the source. As of 2016, the source is returning to its 2008 state in the color–magnitude diagram (Fig. 4). This suggests that the brightening is governed by the same process that was responsible for the fading, namely changing accretion at a constant high extinction. Our simple accretion disk model can reproduce the JHKS fluxes measured in 2016 by assuming Ṁ = 3.3 × 10⁻⁶M⊙ yr-1, and AV = 19.8 mag. The brightening of the source is still ongoing, and our latest observations suggest that after a relatively constant period after 2013, V346 Nor might have again entered a fast brightening phase.
In the classical FUor outburst models, the eruption ends when the inner disk completely depletes, and a new eruption can start only when the disk material is replenished, typically in several thousand or ten thousand years (Bell & Lin 1994). Therefore, the relatively short minimum of V346 Nor is unlikely to signal the end of the large FUor outburst in the classical sense. It was more likely a temporary halt of the accretion onto the star. A similar phenomenon was observed in V899 Mon by Ninan et al. (2015), and in V1647 Ori, where the 2004–2006 outburst ended and then restarted a few years later. The physical mechanism of this temporary stop is as yet unknown. Ninan et al. (2015) speculated about several possible explanations, with the constraint that these processes should be able to return the system to the pre-fading state within a few years. The detailed understanding of the evolution of the V346 Nor outburst will bring us closer to the understanding of these enigmatic sudden fadings of eruptive stars.
Acknowledgments
The authors thank the referee for useful comments. This work was supported by the Momentum grant of the MTA CSFK Lendület Disk Research Group, and by the NKFIH research fund OTKA 101393.
References
- Ábrahám, P., Kóspál, Á., Csizmadia, S., et al. 2004, A&A, 428, 89 [NASA ADS] [CrossRef] [EDP Sciences] [Google Scholar]
- Acosta-Pulido, J. A., Kun, M., Ábrahám, P., et al. 2007, AJ, 133, 2020 [NASA ADS] [CrossRef] [Google Scholar]
- Audard, M., Ábrahám, P., Dunham, M. M., et al. 2014, Protostars and Planets VI, 387 [Google Scholar]
- Bell, K. R., & Lin, D. N. C. 1994, ApJ, 427, 987 [NASA ADS] [CrossRef] [Google Scholar]
- Cardelli, J. A., Clayton, G. C., & Mathis, J. S. 1989, ApJ, 345, 245 [NASA ADS] [CrossRef] [Google Scholar]
- Connelley, M. S., Reipurth, B., & Tokunaga, A. T. 2008, AJ, 135, 2496 [NASA ADS] [CrossRef] [Google Scholar]
- Cutri, R. M. 2013, VizieR Online Data Catalog: II/328 [Google Scholar]
- Cutri, R. M., Mainzer, A., Conrow, T., et al. 2015, Explanatory Supplement to the NEOWISE Data Release Products, Tech. rep. [Google Scholar]
- Cutri, R. M., Skrutskie, M. F., van Dyk, S., et al. 2003, VizieR Online Data Catalog: II/246 [Google Scholar]
- Elias, J. H. 1980, ApJ, 241, 728 [NASA ADS] [CrossRef] [Google Scholar]
- Frogel, J. A., & Graham, J. A. 1983, IAU Circ., 3792, 2 [NASA ADS] [Google Scholar]
- Graham, J. A. 1983, IAU Circ., 3785, 1 [NASA ADS] [Google Scholar]
- Graham, J. A., & Frogel, J. A. 1985, ApJ, 289, 331 [NASA ADS] [CrossRef] [Google Scholar]
- Hackstein, M., Haas, M., Kóspál, Á., et al. 2015, A&A, 582, L12 [NASA ADS] [CrossRef] [EDP Sciences] [Google Scholar]
- Hartmann, L., & Kenyon, S. J. 1996, ARA&A, 34, 207 [NASA ADS] [CrossRef] [EDP Sciences] [MathSciNet] [Google Scholar]
- Hillenbrand, L. A., Miller, A. A., Covey, K. R., et al. 2013, AJ, 145, 59 [NASA ADS] [CrossRef] [Google Scholar]
- Holmberg, E. B., Lauberts, A., Schuster, H.-E., & West, R. M. 1974, A&AS, 18, 463 [NASA ADS] [Google Scholar]
- Kenyon, S. J., & Hartmann, L. W. 1991, ApJ, 383, 664 [NASA ADS] [CrossRef] [Google Scholar]
- Kóspál, Á., Ábrahám, P., Acosta-Pulido, J. A., et al. 2011, A&A, 527, A133 [NASA ADS] [CrossRef] [EDP Sciences] [Google Scholar]
- Kóspál, Á., Ábrahám, P., Acosta-Pulido, J. A., et al. 2013, A&A, 551, A62 [NASA ADS] [CrossRef] [EDP Sciences] [Google Scholar]
- Kóspál, Á., Ábrahám, P., Acosta-Pulido, J. A., et al. 2016, A&A, 596, A52 [NASA ADS] [CrossRef] [EDP Sciences] [Google Scholar]
- Kraus, S., Caratti o Garatti, A., Garcia-Lopez, R., et al. 2016, MNRAS, 462, L61 [NASA ADS] [CrossRef] [Google Scholar]
- Kun, M., Szegedi-Elek, E., Moór, A., et al. 2011a, ApJ, 733, L8 [NASA ADS] [CrossRef] [Google Scholar]
- Kun, M., Szegedi-Elek, E., Moór, A., et al. 2011b, MNRAS, 413, 2689 [NASA ADS] [CrossRef] [Google Scholar]
- Minniti, D., Lucas, P. W., Emerson, J. P., et al. 2010, New Astron, 15, 433 [Google Scholar]
- Molinari, S., Liseau, R., Lorenzetti, D., & Graham, J. 1993, IAU Circ., 5727, 1 [NASA ADS] [Google Scholar]
- Mosoni, L., Sipos, N., Ábrahám, P., et al. 2013, A&A, 552, A62 [NASA ADS] [CrossRef] [EDP Sciences] [Google Scholar]
- Ninan, J. P., Ojha, D. K., Baug, T., et al. 2015, ApJ, 815, 4 [NASA ADS] [CrossRef] [Google Scholar]
- Prusti, T., Bontekoe, T. R., Chiar, J. E., Kester, D. J. M., & Whittet, D. C. B. 1993, A&A, 279, 163 [NASA ADS] [Google Scholar]
- Quanz, S. P., Henning, T., Bouwman, J., et al. 2007, ApJ, 668, 359 [NASA ADS] [CrossRef] [Google Scholar]
- Reipurth, B. 1981, A&AS, 44, 379 [NASA ADS] [Google Scholar]
- Reipurth, B. 1985, A&A, 143, 435 [NASA ADS] [Google Scholar]
- Reipurth, B., & Krautter, J. 1983, IAU Circ., 3823 [Google Scholar]
- Reipurth, B., & Wamsteker, W. 1983, A&A, 119, 14 [NASA ADS] [Google Scholar]
- Reipurth, B., Olberg, M., Gredel, R., & Booth, R. S. 1997, A&A, 327, 1164 [NASA ADS] [Google Scholar]
- Saito, R. K., Hempel, M., Minniti, D., et al. 2012, A&A, 537, A107 [NASA ADS] [CrossRef] [EDP Sciences] [Google Scholar]
- Savage, B. D., & Mathis, J. S. 1979, ARA&A, 17, 73 [NASA ADS] [CrossRef] [Google Scholar]
- Schwartz, R. D. 1977, ApJS, 35, 161 [Google Scholar]
- Weintraub, D. A., Sandell, G., & Duncan, W. D. 1991, ApJ, 382, 270 [NASA ADS] [CrossRef] [Google Scholar]
- Zacharias, N., Finch, C. T., Girard, T. M., et al. 2013, AJ, 145, 44 [NASA ADS] [CrossRef] [EDP Sciences] [Google Scholar]
- Zhu, Z., Hartmann, L., Calvet, N., et al. 2007, ApJ, 669, 483 [NASA ADS] [CrossRef] [Google Scholar]
Appendix A: Near-IR photometry of V346 Nor
The comparison of our aperture photometry with the 2MASS catalog revealed the known detector issue that stars brighter than about 11 mag in the KS band enter the nonlinear regime of the VIRCAM detector (Saito et al. 2012). While close to its minimum V346 Nor was below this limit, after about May 2013, it became brighter than 11 mag. In order to correct for the underestimation of the signal, we plotted the offsets between the instrumental and the 2MASS magnitudes for all stars with quality flag “A” in the image as a function of the instrumental magnitude. We fit the distribution of points with a first- or second-order polynomial, and determined the offset valid for V346 Nor from this fit (for an example, see Fig. A.1). The necessary correction due to the nonlinearity was typically in the 0.1–0.2 mag range, with a few higher values up to 0.4–0.6 mag. Figure A.2 shows the KS-band light curve without and with the nonlinearity correction, demonstrating that our correction significantly reduced the scatter of the data points obtained close in time.
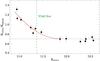 |
Fig. A.1 Demonstration of the nonlinearity correction applied for the photometry of V346 Nor. |
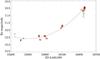 |
Fig. A.2 VISTA/VIRCAM photometry of V346 Nor without (green plus signs) and with (red circles) correction for nonlinearity. Asterisks indicate our IRIS photometry. The black solid curve is a parabola fit to the data points to remove the long-term trend before the period analysis (see Appendix B). |
Appendix B: Period analysis
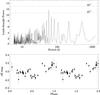 |
Fig. B.1 Top: Lomb-Scargle periodogram of the light curve of V346 Nor after removing a parabolic trend, as illustrated in Fig. A.2. The highest peak corresponds to a period of 58 days. The dashed lines show the powers corresponding to false-alarm probabilities of 10-3 and 10-2. Bottom: phase-folded light curve showing the data points after removing the parabolic trend and folded with a period of 58 days. |
Near-IR photometry of V346 Nor.
All Tables
All Figures
|
Fig. 1 V346 Nor (black plus sign in the center) and its surroundings in a JHKS color-composit image. The observations were taken within the VISTA Variables in the Via Lactea (VVV) Survey on March 15, 2010. North is up and east is to the left. The displayed area is 2 |
| In the text | |
|
Fig. 2 Top: VLT/NaCo J, H, and KS images of V346 Nor from 2008. The color scale is logarithmic. Bottom: radial intensity profiles of V346 Nor (solid curves) and of another fainter star that is visible in the field of view (dashed curves) measured in our NaCo J, H, and KS images. The uncertainty of the brightness profile of the fainter star is indicated by error bars, while the uncertainty in the profile of V346 Nor is less than the curve thickness. |
| In the text | |
|
Fig. 3 Near-IR light curves of V346 Nor. Data points are from Elias (1980), Frogel & Graham (1983), Graham & Frogel (1985), Reipurth & Krautter (1983, Reipurth & Wamsteker (1983), Reipurth (1985), Kenyon & Hartmann (1991), Molinari et al. (1993), Prusti et al. (1993), Reipurth et al. (1997), Quanz et al. (2007), Connelley et al. (2008), the 2MASS, DENIS, AllWISE and NEOWISE catalogs (Cutri et al. 2003, 2015; Cutri 2013), and this work. Downward arrows indicate upper limits. |
| In the text | |
|
Fig. 4 Near-IR color–magnitude diagram for V346 Nor. The reddening path is marked with a dashed line (Cardelli et al. 1989). The solid gray curves indicate our reddened accretion disk model fits (see details in text). |
| In the text | |
|
Fig. A.1 Demonstration of the nonlinearity correction applied for the photometry of V346 Nor. |
| In the text | |
|
Fig. A.2 VISTA/VIRCAM photometry of V346 Nor without (green plus signs) and with (red circles) correction for nonlinearity. Asterisks indicate our IRIS photometry. The black solid curve is a parabola fit to the data points to remove the long-term trend before the period analysis (see Appendix B). |
| In the text | |
|
Fig. B.1 Top: Lomb-Scargle periodogram of the light curve of V346 Nor after removing a parabolic trend, as illustrated in Fig. A.2. The highest peak corresponds to a period of 58 days. The dashed lines show the powers corresponding to false-alarm probabilities of 10-3 and 10-2. Bottom: phase-folded light curve showing the data points after removing the parabolic trend and folded with a period of 58 days. |
| In the text | |
Current usage metrics show cumulative count of Article Views (full-text article views including HTML views, PDF and ePub downloads, according to the available data) and Abstracts Views on Vision4Press platform.
Data correspond to usage on the plateform after 2015. The current usage metrics is available 48-96 hours after online publication and is updated daily on week days.
Initial download of the metrics may take a while.