Fig. B.1
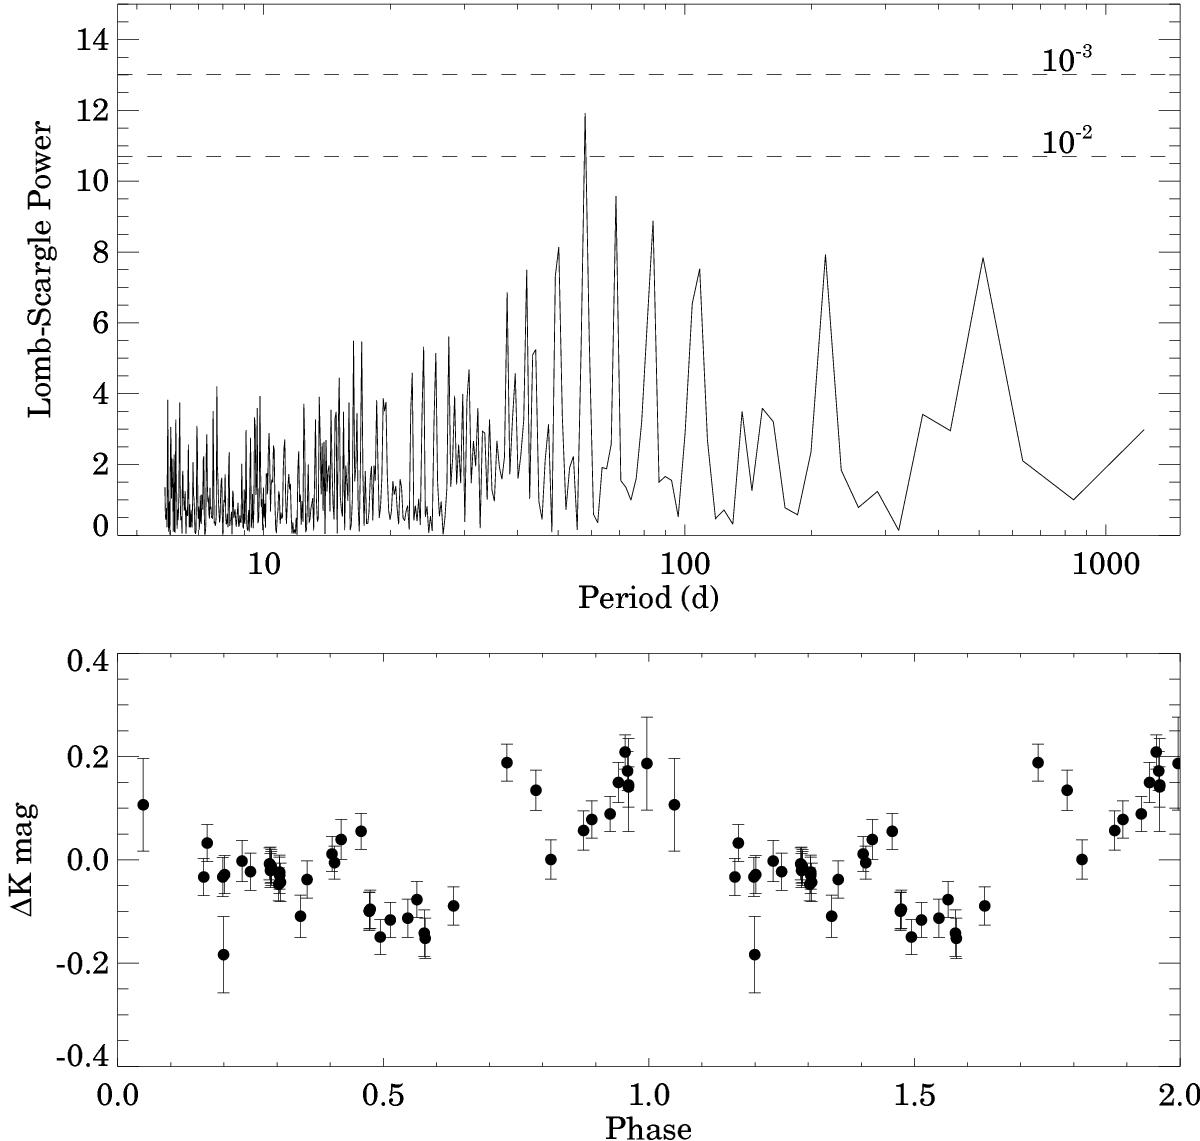
Top: Lomb-Scargle periodogram of the light curve of V346 Nor after removing a parabolic trend, as illustrated in Fig. A.2. The highest peak corresponds to a period of 58 days. The dashed lines show the powers corresponding to false-alarm probabilities of 10-3 and 10-2. Bottom: phase-folded light curve showing the data points after removing the parabolic trend and folded with a period of 58 days.
Current usage metrics show cumulative count of Article Views (full-text article views including HTML views, PDF and ePub downloads, according to the available data) and Abstracts Views on Vision4Press platform.
Data correspond to usage on the plateform after 2015. The current usage metrics is available 48-96 hours after online publication and is updated daily on week days.
Initial download of the metrics may take a while.