Fig. 1
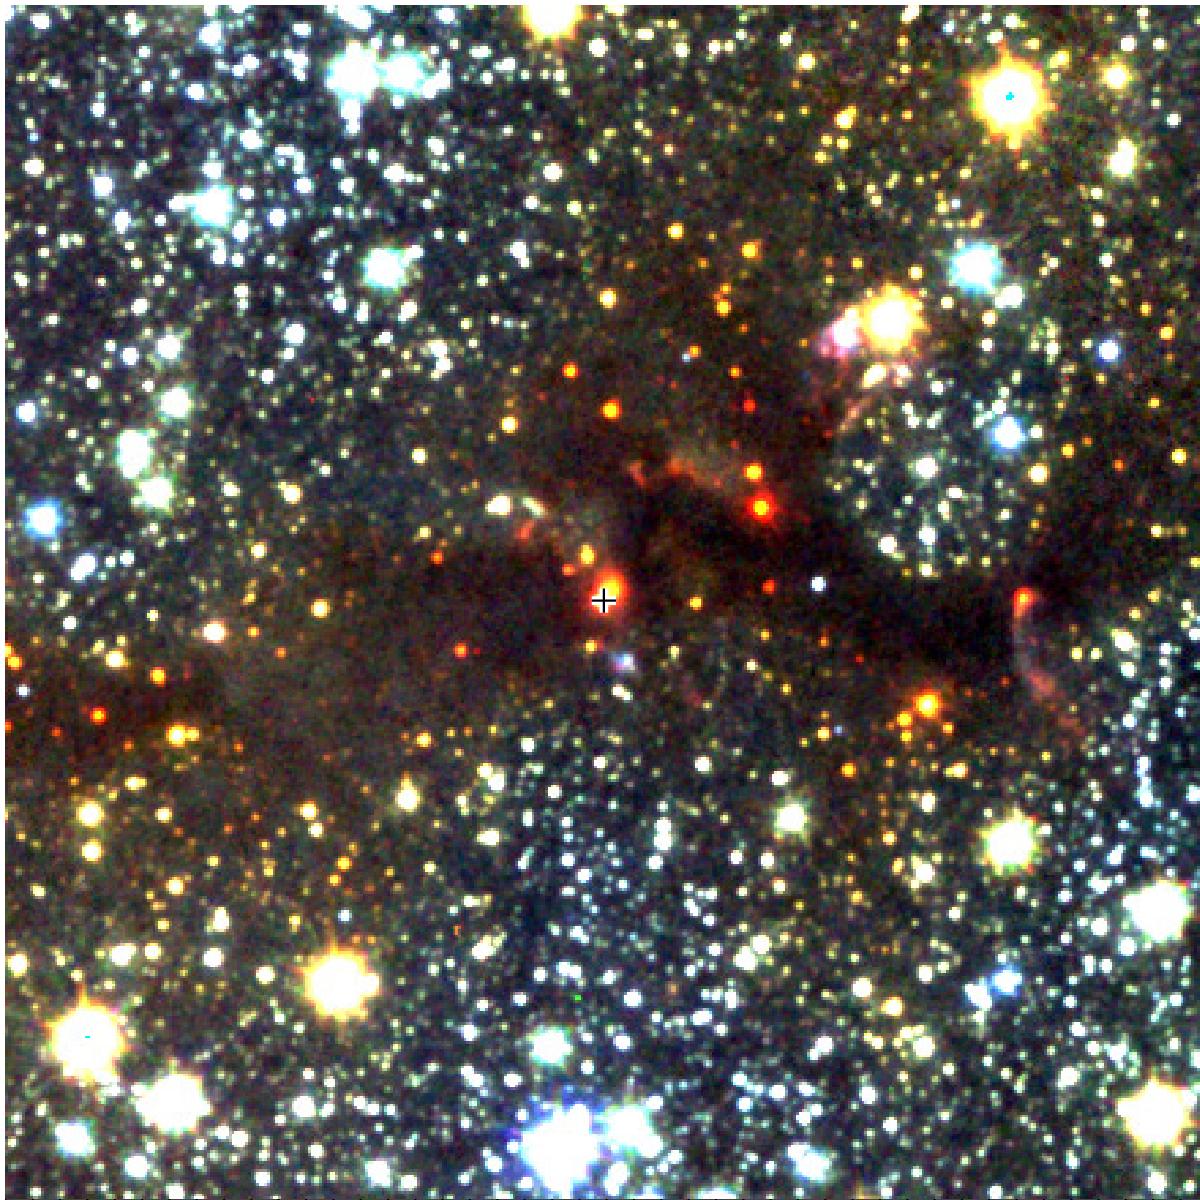
V346 Nor (black plus sign in the center) and its surroundings in a JHKS color-composit image. The observations were taken within the VISTA Variables in the Via Lactea (VVV) Survey on March 15, 2010. North is up and east is to the left. The displayed area is 2![]() 5×2
5×2![]() 5 in size. The dark lane across the image is due to extinction by the Sa 187 molecular cloud.
5 in size. The dark lane across the image is due to extinction by the Sa 187 molecular cloud.
Current usage metrics show cumulative count of Article Views (full-text article views including HTML views, PDF and ePub downloads, according to the available data) and Abstracts Views on Vision4Press platform.
Data correspond to usage on the plateform after 2015. The current usage metrics is available 48-96 hours after online publication and is updated daily on week days.
Initial download of the metrics may take a while.