Free Access
Fig. A.2
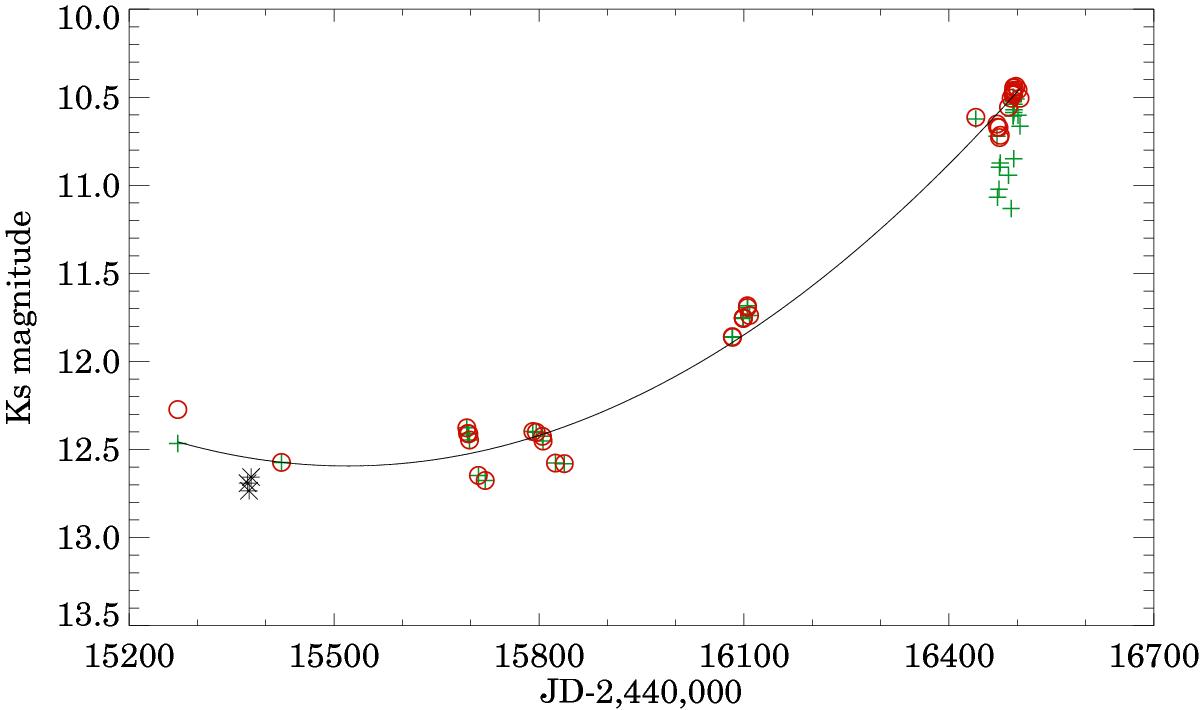
VISTA/VIRCAM photometry of V346 Nor without (green plus signs) and with (red circles) correction for nonlinearity. Asterisks indicate our IRIS photometry. The black solid curve is a parabola fit to the data points to remove the long-term trend before the period analysis (see Appendix B).
Current usage metrics show cumulative count of Article Views (full-text article views including HTML views, PDF and ePub downloads, according to the available data) and Abstracts Views on Vision4Press platform.
Data correspond to usage on the plateform after 2015. The current usage metrics is available 48-96 hours after online publication and is updated daily on week days.
Initial download of the metrics may take a while.